
|
|||||
|
 | |
| |
| |
| |
| |
| |
|
Gene: USP40 |
Gene summary for USP40 |
| Gene information | Species | Human | Gene symbol | USP40 | Gene ID | 55230 |
| Gene name | ubiquitin specific peptidase 40 | |
| Gene Alias | USP40 | |
| Cytomap | 2q37.1 | |
| Gene Type | protein-coding | GO ID | GO:0006464 | UniProtAcc | Q9NVE5 |
Top |
Malignant transformation analysis |
| Identification of the aberrant gene expression in precancerous and cancerous lesions by comparing the gene expression of stem-like cells in diseased tissues with normal stem cells |
| Entrez ID | Symbol | Replicates | Species | Organ | Tissue | Adj P-value | Log2FC | Malignancy |
| 55230 | USP40 | LZE4T | Human | Esophagus | ESCC | 2.56e-05 | 1.67e-01 | 0.0811 |
| 55230 | USP40 | LZE24T | Human | Esophagus | ESCC | 5.10e-12 | 2.66e-01 | 0.0596 |
| 55230 | USP40 | LZE21T | Human | Esophagus | ESCC | 1.27e-03 | 2.99e-01 | 0.0655 |
| 55230 | USP40 | P2T-E | Human | Esophagus | ESCC | 5.86e-09 | 1.80e-01 | 0.1177 |
| 55230 | USP40 | P4T-E | Human | Esophagus | ESCC | 1.16e-10 | 2.58e-01 | 0.1323 |
| 55230 | USP40 | P5T-E | Human | Esophagus | ESCC | 4.61e-06 | 1.23e-01 | 0.1327 |
| 55230 | USP40 | P8T-E | Human | Esophagus | ESCC | 5.56e-17 | 2.72e-01 | 0.0889 |
| 55230 | USP40 | P9T-E | Human | Esophagus | ESCC | 1.13e-05 | 1.50e-01 | 0.1131 |
| 55230 | USP40 | P10T-E | Human | Esophagus | ESCC | 9.67e-18 | 2.69e-01 | 0.116 |
| 55230 | USP40 | P12T-E | Human | Esophagus | ESCC | 5.15e-15 | 2.92e-01 | 0.1122 |
| 55230 | USP40 | P15T-E | Human | Esophagus | ESCC | 1.46e-17 | 4.12e-01 | 0.1149 |
| 55230 | USP40 | P16T-E | Human | Esophagus | ESCC | 2.24e-14 | 2.78e-01 | 0.1153 |
| 55230 | USP40 | P20T-E | Human | Esophagus | ESCC | 8.14e-06 | 1.75e-01 | 0.1124 |
| 55230 | USP40 | P21T-E | Human | Esophagus | ESCC | 2.56e-09 | 1.88e-01 | 0.1617 |
| 55230 | USP40 | P22T-E | Human | Esophagus | ESCC | 1.13e-09 | 1.72e-01 | 0.1236 |
| 55230 | USP40 | P23T-E | Human | Esophagus | ESCC | 6.25e-05 | 1.03e-01 | 0.108 |
| 55230 | USP40 | P24T-E | Human | Esophagus | ESCC | 1.97e-10 | 2.06e-01 | 0.1287 |
| 55230 | USP40 | P26T-E | Human | Esophagus | ESCC | 2.80e-08 | 1.30e-01 | 0.1276 |
| 55230 | USP40 | P27T-E | Human | Esophagus | ESCC | 1.38e-11 | 1.79e-01 | 0.1055 |
| 55230 | USP40 | P28T-E | Human | Esophagus | ESCC | 1.66e-12 | 2.82e-01 | 0.1149 |
| Page: 1 2 3 4 5 |
| Tissue | Expression Dynamics | Abbreviation |
| Esophagus | 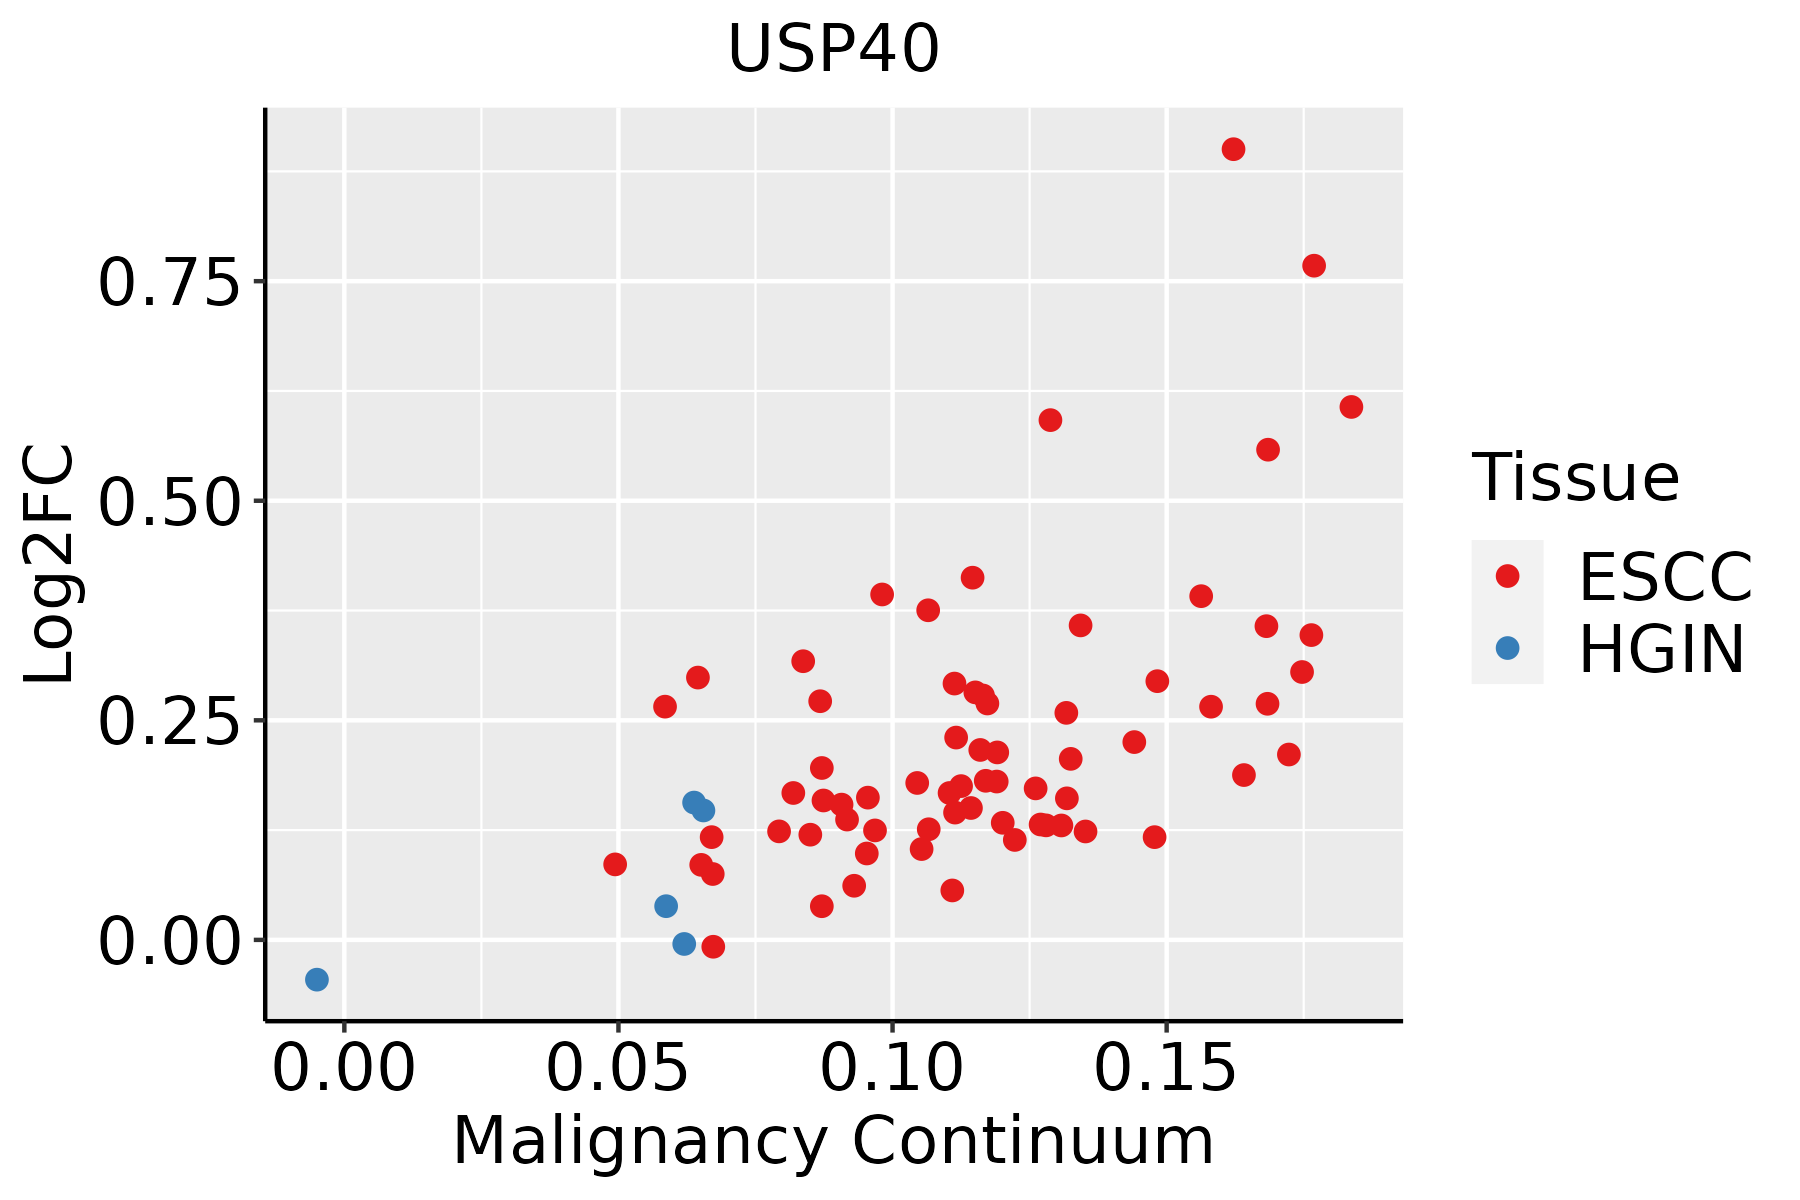 | ESCC: Esophageal squamous cell carcinoma |
| HGIN: High-grade intraepithelial neoplasias | ||
| LGIN: Low-grade intraepithelial neoplasias | ||
| Liver | 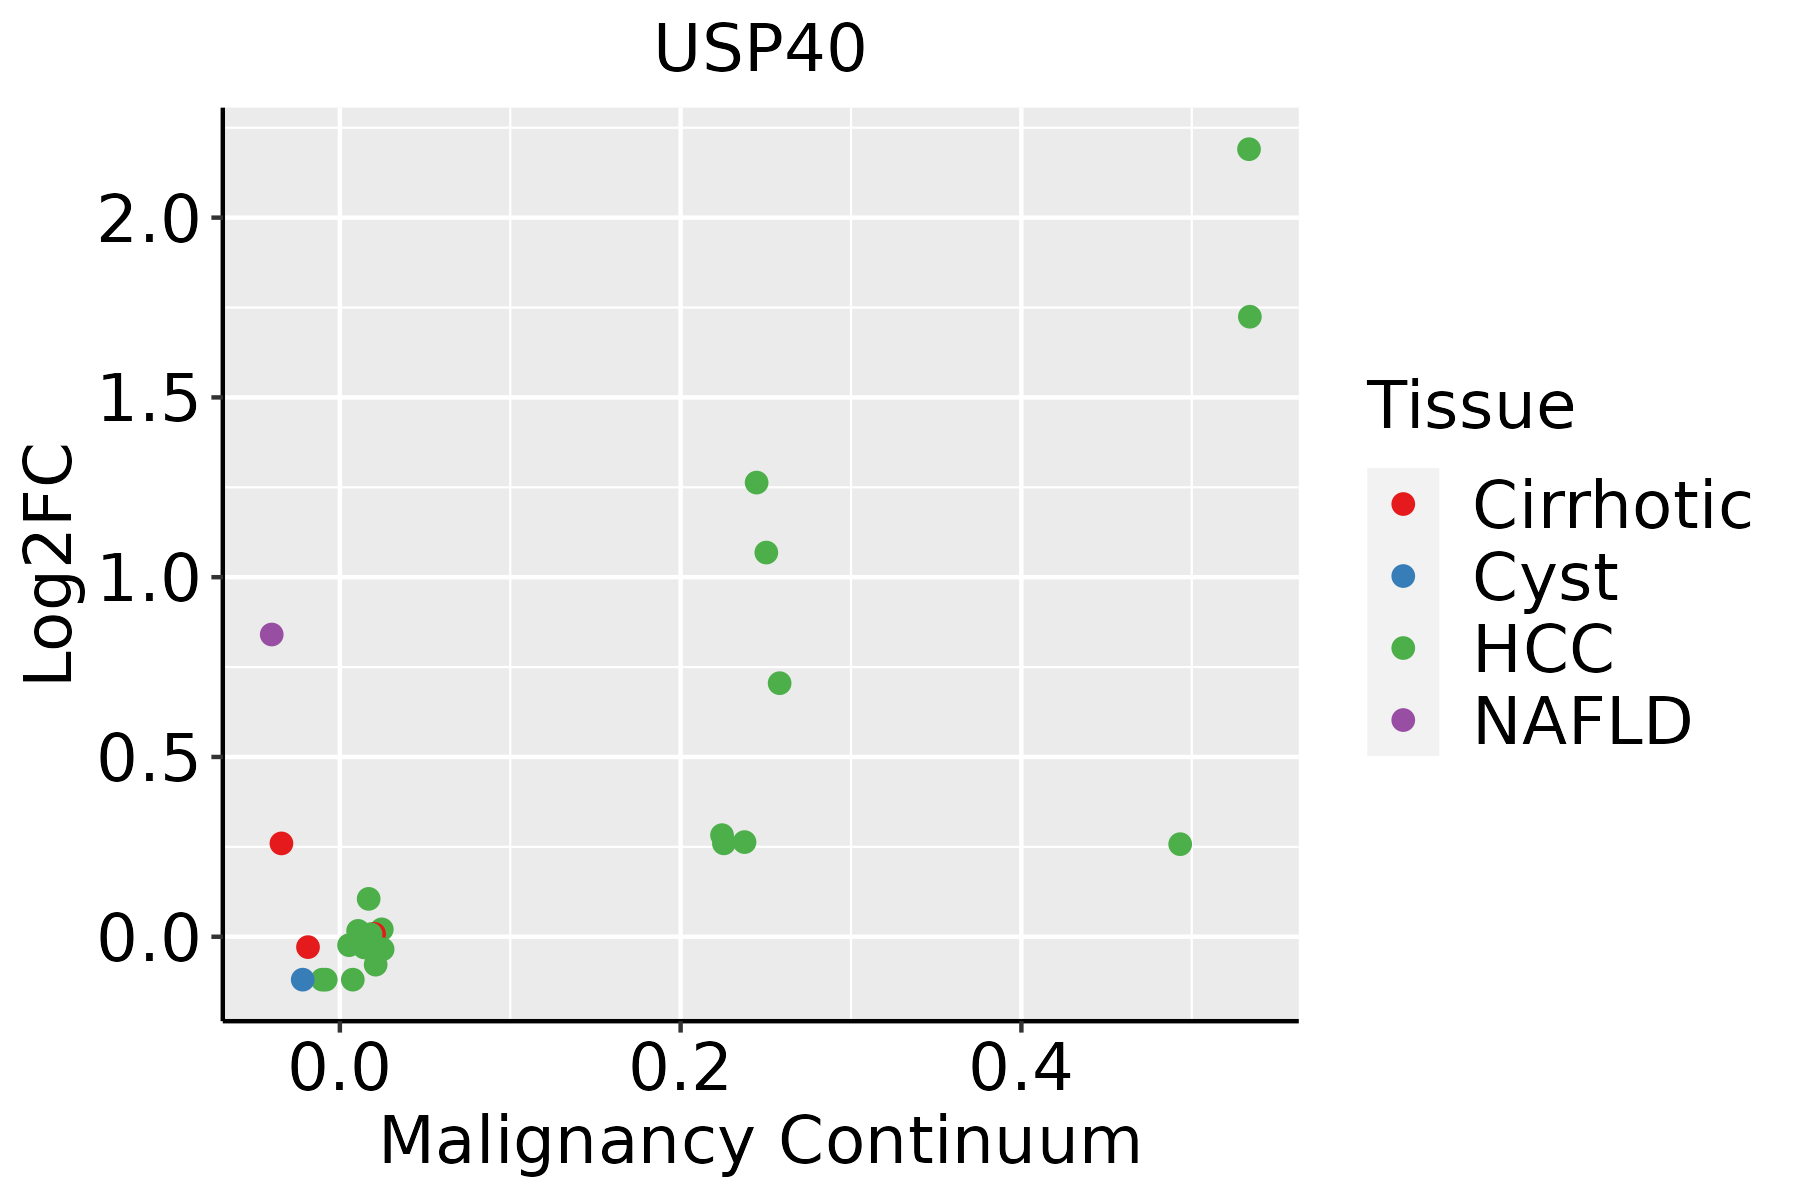 | HCC: Hepatocellular carcinoma |
| NAFLD: Non-alcoholic fatty liver disease | ||
| Lung | 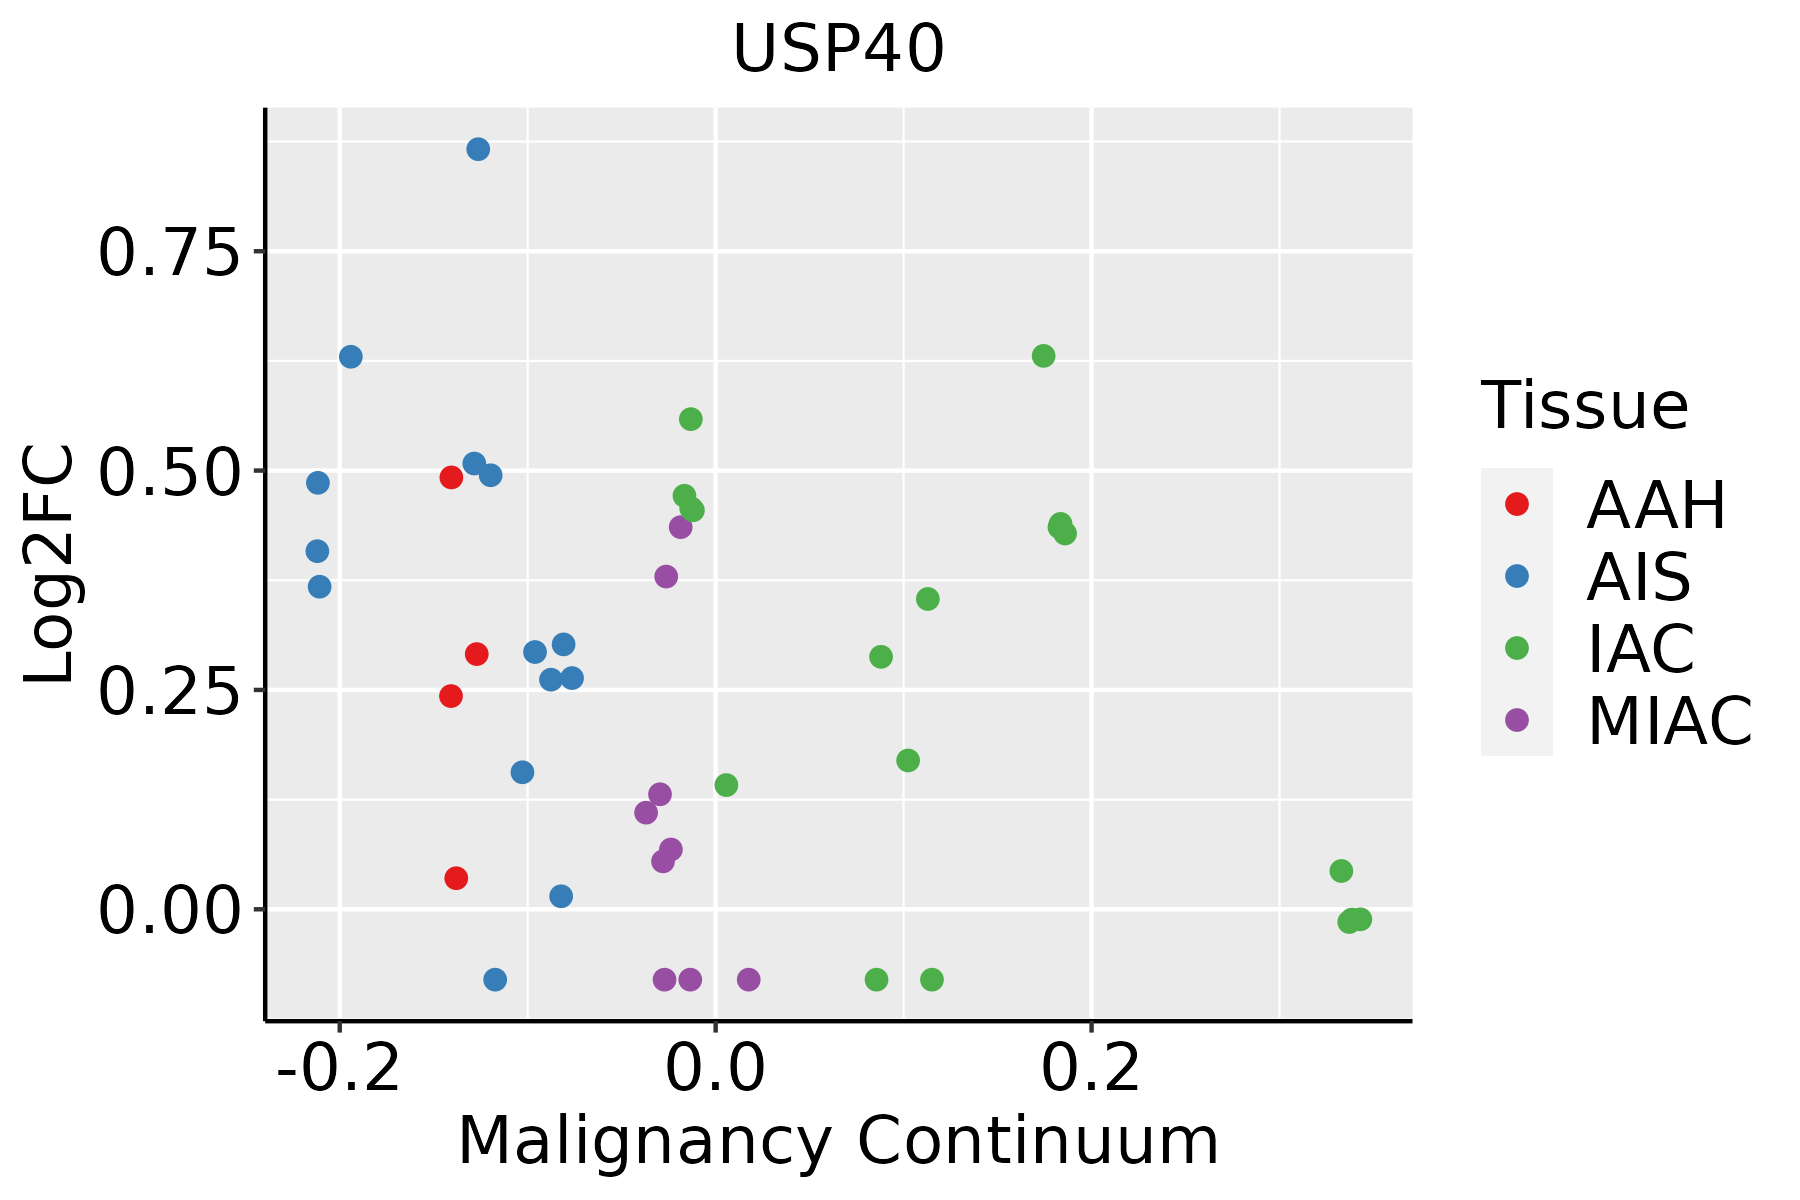 | AAH: Atypical adenomatous hyperplasia |
| AIS: Adenocarcinoma in situ | ||
| IAC: Invasive lung adenocarcinoma | ||
| MIA: Minimally invasive adenocarcinoma | ||
| Thyroid |  | ATC: Anaplastic thyroid cancer |
| HT: Hashimoto's thyroiditis | ||
| PTC: Papillary thyroid cancer |
| ∗log2FC in expression of this searched gene in stem-like cells from each diseased tissue sample relative to stem-like cells in normal samples in each tissue plotted against the malignancy continuum. Samples are colored based on if they are from different disease stage. |
Top |
Malignant transformation related pathway analysis |
| Find out the enriched GO biological processes and KEGG pathways involved in transition from healthy to precancer to cancer |
| Tissue | Disease Stage | Enriched GO biological Processes |
| Colorectum | AD |  |
| Colorectum | SER |  |
| Colorectum | MSS |  |
| Colorectum | MSI-H |  |
| Colorectum | FAP |  |
| ∗Top 15 enriched GO BP terms are showed in the bar plot of each disease state in each tissue. Each row represents a significant GO biological process which is colored according to the -log10(p.adjust). |
| Page: 1 2 3 4 5 6 7 8 9 |
| GO ID | Tissue | Disease Stage | Description | Gene Ratio | Bg Ratio | pvalue | p.adjust | Count |
| GO:0031647111 | Esophagus | ESCC | regulation of protein stability | 223/8552 | 298/18723 | 5.76e-25 | 1.52e-22 | 223 |
| GO:007064612 | Esophagus | ESCC | protein modification by small protein removal | 95/8552 | 157/18723 | 1.25e-04 | 8.56e-04 | 95 |
| GO:00165793 | Esophagus | ESCC | protein deubiquitination | 79/8552 | 139/18723 | 5.23e-03 | 1.97e-02 | 79 |
| GO:00316477 | Liver | NAFLD | regulation of protein stability | 61/1882 | 298/18723 | 5.00e-08 | 4.71e-06 | 61 |
| GO:0070646 | Liver | NAFLD | protein modification by small protein removal | 29/1882 | 157/18723 | 9.11e-04 | 1.09e-02 | 29 |
| GO:0016579 | Liver | NAFLD | protein deubiquitination | 26/1882 | 139/18723 | 1.35e-03 | 1.52e-02 | 26 |
| GO:003164722 | Liver | HCC | regulation of protein stability | 211/7958 | 298/18723 | 2.29e-23 | 5.01e-21 | 211 |
| GO:00706461 | Liver | HCC | protein modification by small protein removal | 91/7958 | 157/18723 | 6.50e-05 | 5.92e-04 | 91 |
| GO:00165791 | Liver | HCC | protein deubiquitination | 78/7958 | 139/18723 | 8.13e-04 | 4.87e-03 | 78 |
| GO:00316478 | Lung | IAC | regulation of protein stability | 62/2061 | 298/18723 | 5.37e-07 | 3.32e-05 | 62 |
| GO:003164713 | Lung | AIS | regulation of protein stability | 62/1849 | 298/18723 | 1.06e-08 | 1.63e-06 | 62 |
| GO:0031647113 | Thyroid | PTC | regulation of protein stability | 174/5968 | 298/18723 | 2.05e-21 | 4.05e-19 | 174 |
| GO:00706465 | Thyroid | PTC | protein modification by small protein removal | 71/5968 | 157/18723 | 3.03e-04 | 2.12e-03 | 71 |
| GO:00165794 | Thyroid | PTC | protein deubiquitination | 59/5968 | 139/18723 | 5.50e-03 | 2.50e-02 | 59 |
| GO:003164734 | Thyroid | ATC | regulation of protein stability | 177/6293 | 298/18723 | 4.08e-20 | 6.46e-18 | 177 |
| GO:007064613 | Thyroid | ATC | protein modification by small protein removal | 71/6293 | 157/18723 | 1.59e-03 | 7.99e-03 | 71 |
| Page: 1 |
| Pathway ID | Tissue | Disease Stage | Description | Gene Ratio | Bg Ratio | pvalue | p.adjust | qvalue | Count |
| Page: 1 |
Top |
Cell-cell communication analysis |
| Identification of potential cell-cell interactions between two cell types and their ligand-receptor pairs for different disease states |
| Ligand | Receptor | LRpair | Pathway | Tissue | Disease Stage |
| Page: 1 |
Top |
Single-cell gene regulatory network inference analysis |
| Find out the significant the regulons (TFs) and the target genes of each regulon across cell types for different disease states |
| TF | Cell Type | Tissue | Disease Stage | Target Gene | RSS | Regulon Activity |
| ∗The dot plots of a searched regulon are shown for all cell subpopulations in each disease state of each tissue based on the regulon specific score inferred using pySCENIC and by calculating the average expression. |
| Page: 1 |
Top |
Somatic mutation of malignant transformation related genes |
| Annotation of somatic variants for genes involved in malignant transformation |
| Hugo Symbol | Variant Class | Variant Classification | dbSNP RS | HGVSc | HGVSp | HGVSp Short | SWISSPROT | BIOTYPE | SIFT | PolyPhen | Tumor Sample Barcode | Tissue | Histology | Sex | Age | Stage | Therapy Types | Drugs | Outcome |
| USP40 | SNV | Missense_Mutation | c.1846N>A | p.Asp616Asn | p.D616N | Q9NVE5 | protein_coding | deleterious(0.05) | benign(0.191) | TCGA-AC-A23H-01 | Breast | breast invasive carcinoma | Female | >=65 | I/II | Unknown | Unknown | PD | |
| USP40 | SNV | Missense_Mutation | novel | c.82N>C | p.Asn28His | p.N28H | Q9NVE5 | protein_coding | deleterious(0.03) | benign(0.412) | TCGA-AN-A046-01 | Breast | breast invasive carcinoma | Female | >=65 | I/II | Unknown | Unknown | SD |
| USP40 | SNV | Missense_Mutation | novel | c.1227N>G | p.Ile409Met | p.I409M | Q9NVE5 | protein_coding | tolerated(0.07) | benign(0.031) | TCGA-B6-A0RS-01 | Breast | breast invasive carcinoma | Female | <65 | I/II | Unknown | Unknown | PD |
| USP40 | SNV | Missense_Mutation | c.3391N>C | p.Ile1131Leu | p.I1131L | Q9NVE5 | protein_coding | tolerated(0.49) | benign(0.254) | TCGA-D8-A1XK-01 | Breast | breast invasive carcinoma | Female | <65 | I/II | Chemotherapy | doxorubicine+cyclophosphamide | SD | |
| USP40 | SNV | Missense_Mutation | novel | c.2138N>T | p.Thr713Met | p.T713M | Q9NVE5 | protein_coding | tolerated(0.11) | possibly_damaging(0.472) | TCGA-E9-A1ND-01 | Breast | breast invasive carcinoma | Female | >=65 | I/II | Hormone Therapy | aromasin | SD |
| USP40 | insertion | Frame_Shift_Ins | novel | c.3493_3494insTACCAAGACAAAGCAGAGAAGTCGGAGA | p.Gly1165ValfsTer24 | p.G1165Vfs*24 | Q9NVE5 | protein_coding | TCGA-A1-A0SO-01 | Breast | breast invasive carcinoma | Female | >=65 | I/II | Chemotherapy | SD | |||
| USP40 | insertion | Frame_Shift_Ins | novel | c.3206_3207insATCGAACGGATTCATCATTGCTCCCGTCGCTCTGCCCCCTTATTCT | p.Leu1070SerfsTer38 | p.L1070Sfs*38 | Q9NVE5 | protein_coding | TCGA-BH-A0EE-01 | Breast | breast invasive carcinoma | Female | >=65 | I/II | Chemotherapy | docetaxel | SD | ||
| USP40 | deletion | Frame_Shift_Del | rs766340074 | c.3477delA | p.Lys1159AsnfsTer12 | p.K1159Nfs*12 | Q9NVE5 | protein_coding | TCGA-BH-A18G-01 | Breast | breast invasive carcinoma | Female | >=65 | I/II | Unknown | Unknown | SD | ||
| USP40 | deletion | Frame_Shift_Del | novel | c.3046delG | p.Ala1016ProfsTer2 | p.A1016Pfs*2 | Q9NVE5 | protein_coding | TCGA-D8-A27V-01 | Breast | breast invasive carcinoma | Female | <65 | I/II | Hormone Therapy | tamoxiphen | SD | ||
| USP40 | SNV | Missense_Mutation | novel | c.2434A>G | p.Arg812Gly | p.R812G | Q9NVE5 | protein_coding | deleterious(0) | probably_damaging(0.983) | TCGA-2W-A8YY-01 | Cervix | cervical & endocervical cancer | Female | <65 | I/II | Chemotherapy | cisplatin | CR |
| Page: 1 2 3 4 5 6 7 8 9 10 11 12 13 |
Top |
Related drugs of malignant transformation related genes |
| Identification of chemicals and drugs interact with genes involved in malignant transfromation |
| (DGIdb 4.0) |
| Entrez ID | Symbol | Category | Interaction Types | Drug Claim Name | Drug Name | PMIDs |
| Page: 1 |

Copyright 2023-Present -The University of Texas Health Science Center at Houston |