
|
|||||
|
 | |
| |
| |
| |
| |
| |
|
Gene: USP36 |
Gene summary for USP36 |
| Gene information | Species | Human | Gene symbol | USP36 | Gene ID | 57602 |
| Gene name | ubiquitin specific peptidase 36 | |
| Gene Alias | DUB1 | |
| Cytomap | 17q25.3 | |
| Gene Type | protein-coding | GO ID | GO:0000422 | UniProtAcc | A0A024R8V6 |
Top |
Malignant transformation analysis |
| Identification of the aberrant gene expression in precancerous and cancerous lesions by comparing the gene expression of stem-like cells in diseased tissues with normal stem cells |
| Entrez ID | Symbol | Replicates | Species | Organ | Tissue | Adj P-value | Log2FC | Malignancy |
| 57602 | USP36 | LZE4T | Human | Esophagus | ESCC | 6.53e-05 | 9.17e-02 | 0.0811 |
| 57602 | USP36 | LZE7T | Human | Esophagus | ESCC | 1.21e-05 | 3.23e-01 | 0.0667 |
| 57602 | USP36 | LZE21D1 | Human | Esophagus | HGIN | 8.31e-03 | 4.01e-01 | 0.0632 |
| 57602 | USP36 | LZE24T | Human | Esophagus | ESCC | 2.90e-08 | 2.98e-01 | 0.0596 |
| 57602 | USP36 | LZE21T | Human | Esophagus | ESCC | 1.51e-04 | 1.68e-01 | 0.0655 |
| 57602 | USP36 | LZE6T | Human | Esophagus | ESCC | 4.20e-02 | 3.76e-02 | 0.0845 |
| 57602 | USP36 | P1T-E | Human | Esophagus | ESCC | 2.77e-06 | 1.84e-01 | 0.0875 |
| 57602 | USP36 | P2T-E | Human | Esophagus | ESCC | 1.53e-26 | 3.50e-01 | 0.1177 |
| 57602 | USP36 | P4T-E | Human | Esophagus | ESCC | 1.68e-06 | -1.40e-03 | 0.1323 |
| 57602 | USP36 | P5T-E | Human | Esophagus | ESCC | 8.08e-15 | -4.51e-02 | 0.1327 |
| 57602 | USP36 | P8T-E | Human | Esophagus | ESCC | 1.98e-23 | 6.52e-02 | 0.0889 |
| 57602 | USP36 | P9T-E | Human | Esophagus | ESCC | 3.96e-15 | 1.40e-01 | 0.1131 |
| 57602 | USP36 | P10T-E | Human | Esophagus | ESCC | 1.65e-19 | 1.75e-01 | 0.116 |
| 57602 | USP36 | P11T-E | Human | Esophagus | ESCC | 5.74e-09 | 5.80e-01 | 0.1426 |
| 57602 | USP36 | P12T-E | Human | Esophagus | ESCC | 4.28e-17 | 2.04e-01 | 0.1122 |
| 57602 | USP36 | P15T-E | Human | Esophagus | ESCC | 2.26e-10 | 2.03e-01 | 0.1149 |
| 57602 | USP36 | P16T-E | Human | Esophagus | ESCC | 4.19e-27 | 2.46e-01 | 0.1153 |
| 57602 | USP36 | P20T-E | Human | Esophagus | ESCC | 9.49e-39 | 1.02e+00 | 0.1124 |
| 57602 | USP36 | P21T-E | Human | Esophagus | ESCC | 1.24e-13 | 1.21e-01 | 0.1617 |
| 57602 | USP36 | P22T-E | Human | Esophagus | ESCC | 5.75e-13 | 1.27e-01 | 0.1236 |
| Page: 1 2 3 4 |
| Tissue | Expression Dynamics | Abbreviation |
| Esophagus | 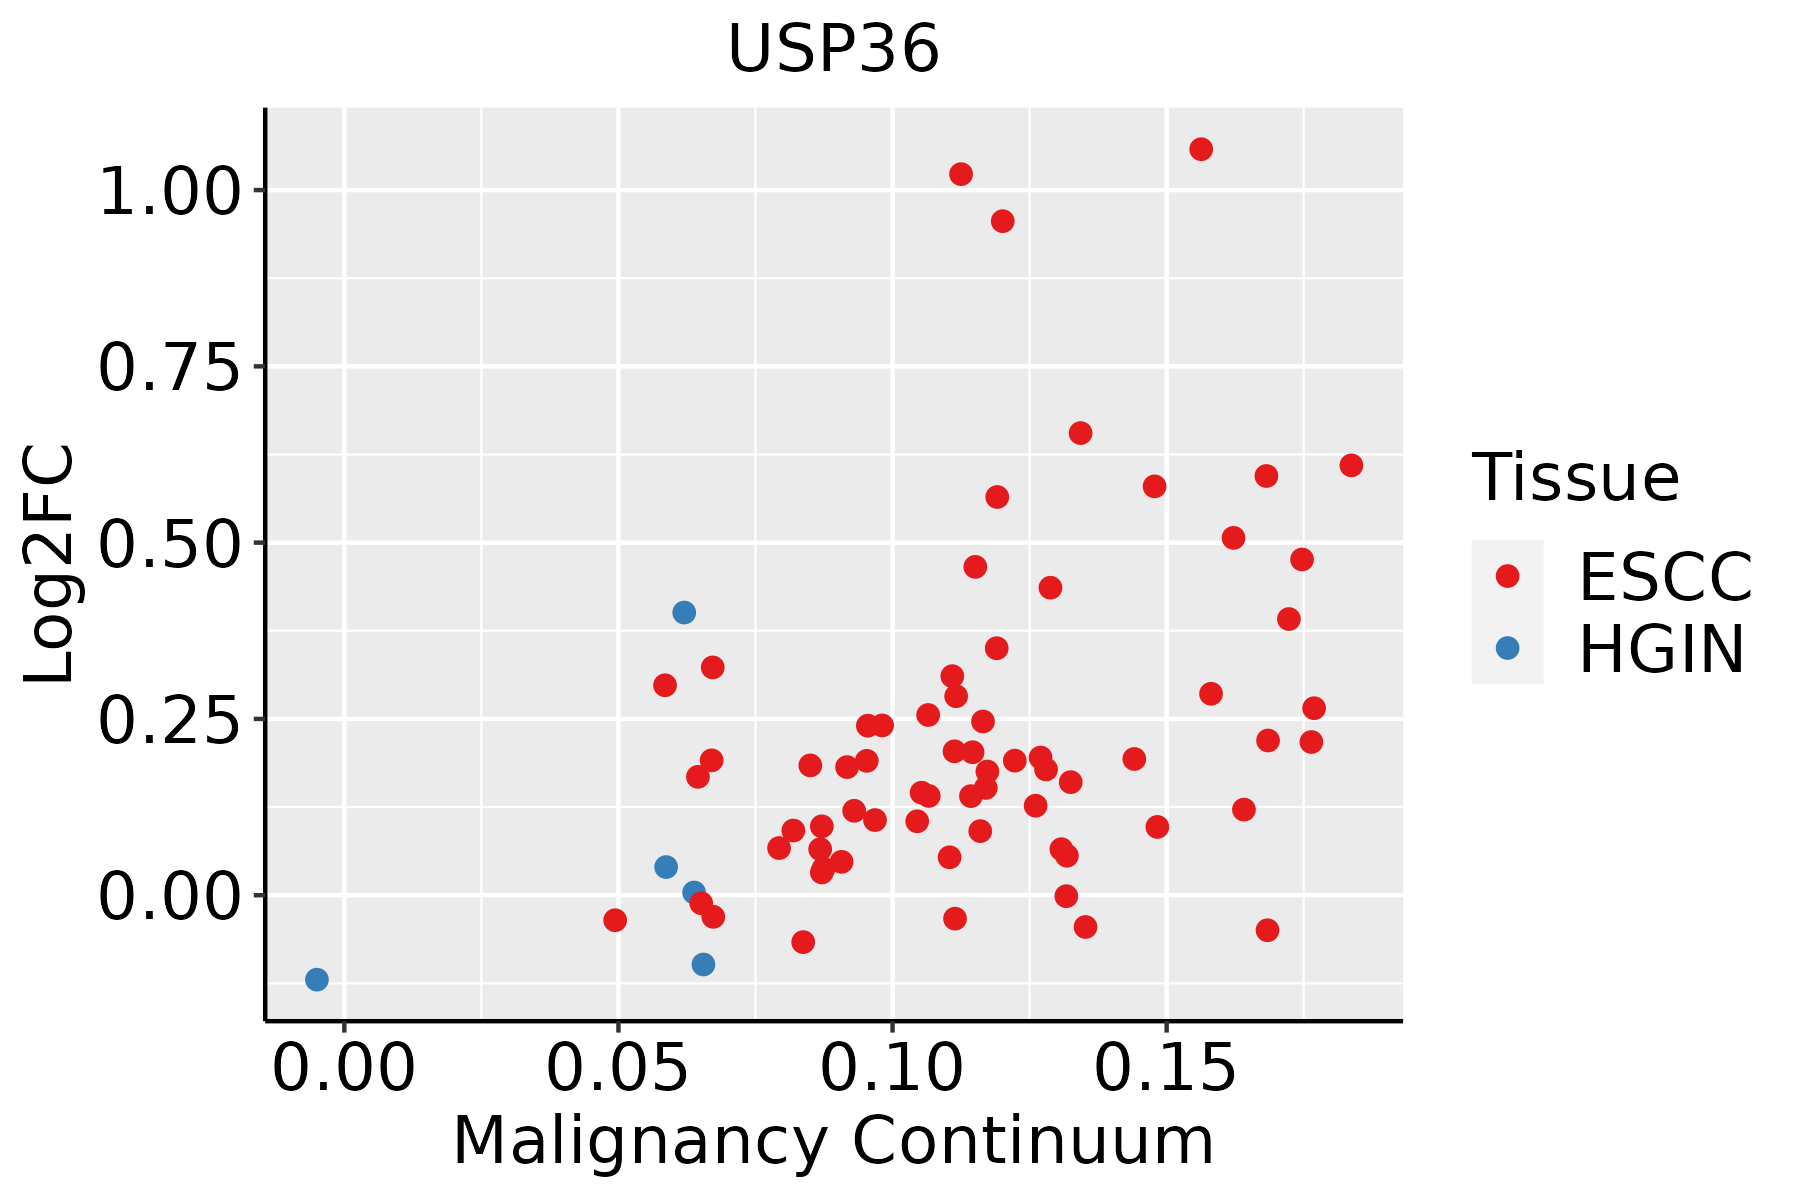 | ESCC: Esophageal squamous cell carcinoma |
| HGIN: High-grade intraepithelial neoplasias | ||
| LGIN: Low-grade intraepithelial neoplasias | ||
| Liver | 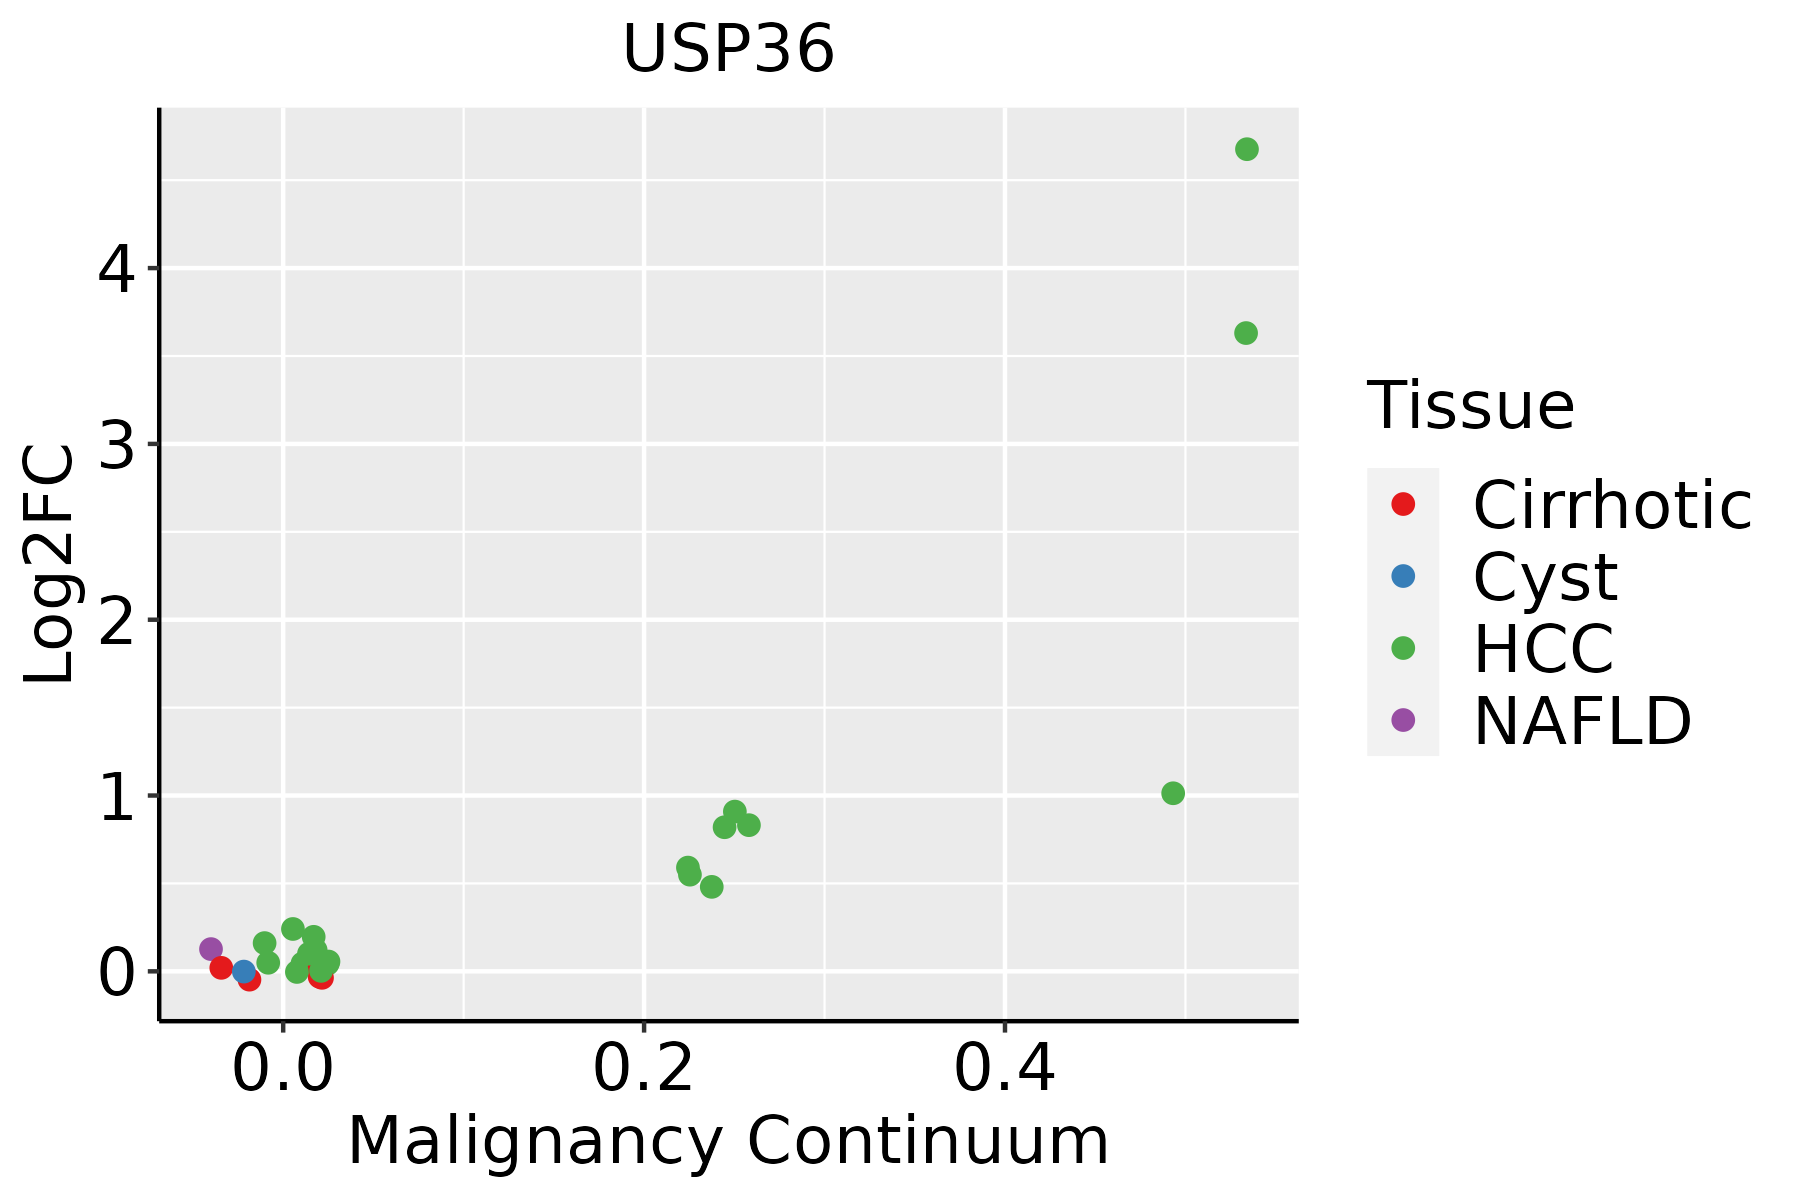 | HCC: Hepatocellular carcinoma |
| NAFLD: Non-alcoholic fatty liver disease | ||
| Thyroid |  | ATC: Anaplastic thyroid cancer |
| HT: Hashimoto's thyroiditis | ||
| PTC: Papillary thyroid cancer |
| ∗log2FC in expression of this searched gene in stem-like cells from each diseased tissue sample relative to stem-like cells in normal samples in each tissue plotted against the malignancy continuum. Samples are colored based on if they are from different disease stage. |
Top |
Malignant transformation related pathway analysis |
| Find out the enriched GO biological processes and KEGG pathways involved in transition from healthy to precancer to cancer |
| Tissue | Disease Stage | Enriched GO biological Processes |
| Colorectum | AD |  |
| Colorectum | SER |  |
| Colorectum | MSS |  |
| Colorectum | MSI-H |  |
| Colorectum | FAP |  |
| ∗Top 15 enriched GO BP terms are showed in the bar plot of each disease state in each tissue. Each row represents a significant GO biological process which is colored according to the -log10(p.adjust). |
| Page: 1 2 3 4 5 6 7 8 9 |
| GO ID | Tissue | Disease Stage | Description | Gene Ratio | Bg Ratio | pvalue | p.adjust | Count |
| GO:002261327 | Esophagus | HGIN | ribonucleoprotein complex biogenesis | 158/2587 | 463/18723 | 2.61e-29 | 5.23e-26 | 158 |
| GO:004225426 | Esophagus | HGIN | ribosome biogenesis | 101/2587 | 299/18723 | 8.74e-19 | 4.03e-16 | 101 |
| GO:003164727 | Esophagus | HGIN | regulation of protein stability | 96/2587 | 298/18723 | 2.21e-16 | 5.76e-14 | 96 |
| GO:007259420 | Esophagus | HGIN | establishment of protein localization to organelle | 120/2587 | 422/18723 | 1.73e-15 | 4.00e-13 | 120 |
| GO:005082127 | Esophagus | HGIN | protein stabilization | 64/2587 | 191/18723 | 3.11e-12 | 4.24e-10 | 64 |
| GO:001607219 | Esophagus | HGIN | rRNA metabolic process | 72/2587 | 236/18723 | 2.26e-11 | 2.56e-09 | 72 |
| GO:000636419 | Esophagus | HGIN | rRNA processing | 69/2587 | 225/18723 | 4.53e-11 | 5.04e-09 | 69 |
| GO:000683920 | Esophagus | HGIN | mitochondrial transport | 74/2587 | 254/18723 | 1.32e-10 | 1.32e-08 | 74 |
| GO:000989520 | Esophagus | HGIN | negative regulation of catabolic process | 87/2587 | 320/18723 | 1.74e-10 | 1.68e-08 | 87 |
| GO:003133026 | Esophagus | HGIN | negative regulation of cellular catabolic process | 74/2587 | 262/18723 | 6.27e-10 | 5.30e-08 | 74 |
| GO:001050616 | Esophagus | HGIN | regulation of autophagy | 84/2587 | 317/18723 | 1.39e-09 | 1.08e-07 | 84 |
| GO:190382926 | Esophagus | HGIN | positive regulation of cellular protein localization | 75/2587 | 276/18723 | 3.19e-09 | 2.30e-07 | 75 |
| GO:007058520 | Esophagus | HGIN | protein localization to mitochondrion | 43/2587 | 125/18723 | 4.43e-09 | 3.03e-07 | 43 |
| GO:003447010 | Esophagus | HGIN | ncRNA processing | 97/2587 | 395/18723 | 5.92e-09 | 3.90e-07 | 97 |
| GO:001623616 | Esophagus | HGIN | macroautophagy | 77/2587 | 291/18723 | 7.15e-09 | 4.61e-07 | 77 |
| GO:007265520 | Esophagus | HGIN | establishment of protein localization to mitochondrion | 41/2587 | 120/18723 | 1.26e-08 | 7.96e-07 | 41 |
| GO:002241120 | Esophagus | HGIN | cellular component disassembly | 102/2587 | 443/18723 | 8.31e-08 | 4.33e-06 | 102 |
| GO:000660525 | Esophagus | HGIN | protein targeting | 78/2587 | 314/18723 | 1.08e-07 | 5.47e-06 | 78 |
| GO:000662620 | Esophagus | HGIN | protein targeting to mitochondrion | 33/2587 | 100/18723 | 7.99e-07 | 3.35e-05 | 33 |
| GO:19030089 | Esophagus | HGIN | organelle disassembly | 36/2587 | 114/18723 | 8.60e-07 | 3.58e-05 | 36 |
| Page: 1 2 3 4 5 6 7 8 9 10 11 |
| Pathway ID | Tissue | Disease Stage | Description | Gene Ratio | Bg Ratio | pvalue | p.adjust | qvalue | Count |
| Page: 1 |
Top |
Cell-cell communication analysis |
| Identification of potential cell-cell interactions between two cell types and their ligand-receptor pairs for different disease states |
| Ligand | Receptor | LRpair | Pathway | Tissue | Disease Stage |
| Page: 1 |
Top |
Single-cell gene regulatory network inference analysis |
| Find out the significant the regulons (TFs) and the target genes of each regulon across cell types for different disease states |
| TF | Cell Type | Tissue | Disease Stage | Target Gene | RSS | Regulon Activity |
| ∗The dot plots of a searched regulon are shown for all cell subpopulations in each disease state of each tissue based on the regulon specific score inferred using pySCENIC and by calculating the average expression. |
| Page: 1 |
Top |
Somatic mutation of malignant transformation related genes |
| Annotation of somatic variants for genes involved in malignant transformation |
| Hugo Symbol | Variant Class | Variant Classification | dbSNP RS | HGVSc | HGVSp | HGVSp Short | SWISSPROT | BIOTYPE | SIFT | PolyPhen | Tumor Sample Barcode | Tissue | Histology | Sex | Age | Stage | Therapy Types | Drugs | Outcome |
| USP36 | SNV | Missense_Mutation | c.1030N>C | p.Gly344Arg | p.G344R | Q9P275 | protein_coding | deleterious(0.03) | possibly_damaging(0.754) | TCGA-A7-A13D-01 | Breast | breast invasive carcinoma | Female | <65 | I/II | Chemotherapy | cytoxan | SD | |
| USP36 | SNV | Missense_Mutation | rs750823481 | c.967N>A | p.Val323Ile | p.V323I | Q9P275 | protein_coding | deleterious(0.04) | probably_damaging(0.949) | TCGA-A8-A079-01 | Breast | breast invasive carcinoma | Female | >=65 | III/IV | Chemotherapy | 5-fluorouracil | SD |
| USP36 | SNV | Missense_Mutation | rs140856412 | c.2728N>A | p.Ala910Thr | p.A910T | Q9P275 | protein_coding | tolerated(0.07) | benign(0.038) | TCGA-AN-A046-01 | Breast | breast invasive carcinoma | Female | >=65 | I/II | Unknown | Unknown | SD |
| USP36 | SNV | Missense_Mutation | c.540C>A | p.Asn180Lys | p.N180K | Q9P275 | protein_coding | deleterious(0.01) | possibly_damaging(0.882) | TCGA-B6-A0IC-01 | Breast | breast invasive carcinoma | Female | >=65 | I/II | Unknown | Unknown | SD | |
| USP36 | SNV | Missense_Mutation | rs140856412 | c.2728N>A | p.Ala910Thr | p.A910T | Q9P275 | protein_coding | tolerated(0.07) | benign(0.038) | TCGA-B6-A0RI-01 | Breast | breast invasive carcinoma | Female | <65 | III/IV | Unknown | Unknown | PD |
| USP36 | SNV | Missense_Mutation | rs763717745 | c.2900N>A | p.Arg967Gln | p.R967Q | Q9P275 | protein_coding | tolerated(1) | benign(0) | TCGA-BH-A18G-01 | Breast | breast invasive carcinoma | Female | >=65 | I/II | Unknown | Unknown | SD |
| USP36 | SNV | Missense_Mutation | c.3334N>T | p.His1112Tyr | p.H1112Y | Q9P275 | protein_coding | deleterious(0) | probably_damaging(0.997) | TCGA-C8-A3M8-01 | Breast | breast invasive carcinoma | Female | >=65 | I/II | Hormone Therapy | tamoxiphen | CR | |
| USP36 | SNV | Missense_Mutation | rs747079506 | c.1538N>T | p.Ser513Phe | p.S513F | Q9P275 | protein_coding | tolerated(0.1) | possibly_damaging(0.894) | TCGA-E2-A15J-01 | Breast | breast invasive carcinoma | Female | <65 | I/II | Chemotherapy | docetaxel | SD |
| USP36 | insertion | Frame_Shift_Ins | novel | c.1454_1455insCTTTTTTTTCC | p.Gly486PhefsTer17 | p.G486Ffs*17 | Q9P275 | protein_coding | TCGA-B6-A0I6-01 | Breast | breast invasive carcinoma | Female | <65 | I/II | Unknown | Unknown | PD | ||
| USP36 | insertion | Nonsense_Mutation | novel | c.1452_1453insGTTGGAAAATAAATCCTCACGGG | p.Ile485ValfsTer4 | p.I485Vfs*4 | Q9P275 | protein_coding | TCGA-B6-A0I6-01 | Breast | breast invasive carcinoma | Female | <65 | I/II | Unknown | Unknown | PD |
| Page: 1 2 3 4 5 6 7 8 9 10 11 |
Top |
Related drugs of malignant transformation related genes |
| Identification of chemicals and drugs interact with genes involved in malignant transfromation |
| (DGIdb 4.0) |
| Entrez ID | Symbol | Category | Interaction Types | Drug Claim Name | Drug Name | PMIDs |
| Page: 1 |

Copyright 2023-Present -The University of Texas Health Science Center at Houston |