
|
|||||
|
 | |
| |
| |
| |
| |
| |
|
Gene: USP32 |
Gene summary for USP32 |
| Gene information | Species | Human | Gene symbol | USP32 | Gene ID | 84669 |
| Gene name | ubiquitin specific peptidase 32 | |
| Gene Alias | NY-REN-60 | |
| Cytomap | 17q23.1-q23.2 | |
| Gene Type | protein-coding | GO ID | GO:0006464 | UniProtAcc | Q8NFA0 |
Top |
Malignant transformation analysis |
| Identification of the aberrant gene expression in precancerous and cancerous lesions by comparing the gene expression of stem-like cells in diseased tissues with normal stem cells |
| Entrez ID | Symbol | Replicates | Species | Organ | Tissue | Adj P-value | Log2FC | Malignancy |
| 84669 | USP32 | CCI_1 | Human | Cervix | CC | 7.75e-06 | 7.71e-01 | 0.528 |
| 84669 | USP32 | CCI_2 | Human | Cervix | CC | 2.53e-07 | 9.00e-01 | 0.5249 |
| 84669 | USP32 | CCI_3 | Human | Cervix | CC | 4.92e-11 | 6.58e-01 | 0.516 |
| 84669 | USP32 | CCII_1 | Human | Cervix | CC | 3.73e-03 | 3.38e-01 | 0.3249 |
| 84669 | USP32 | HTA11_3410_2000001011 | Human | Colorectum | AD | 3.24e-07 | -4.41e-01 | 0.0155 |
| 84669 | USP32 | HTA11_866_3004761011 | Human | Colorectum | AD | 3.25e-04 | -3.74e-01 | 0.096 |
| 84669 | USP32 | HTA11_7696_3000711011 | Human | Colorectum | AD | 2.66e-06 | -3.21e-01 | 0.0674 |
| 84669 | USP32 | HTA11_99999971662_82457 | Human | Colorectum | MSS | 2.14e-02 | -1.92e-01 | 0.3859 |
| 84669 | USP32 | HTA11_99999974143_84620 | Human | Colorectum | MSS | 6.08e-09 | -4.04e-01 | 0.3005 |
| 84669 | USP32 | A002-C-010 | Human | Colorectum | FAP | 5.99e-04 | -1.83e-01 | 0.242 |
| 84669 | USP32 | A001-C-207 | Human | Colorectum | FAP | 4.07e-03 | -2.58e-01 | 0.1278 |
| 84669 | USP32 | A015-C-203 | Human | Colorectum | FAP | 4.30e-25 | -3.67e-01 | -0.1294 |
| 84669 | USP32 | A015-C-204 | Human | Colorectum | FAP | 4.33e-03 | -2.18e-01 | -0.0228 |
| 84669 | USP32 | A014-C-040 | Human | Colorectum | FAP | 1.10e-03 | -2.29e-01 | -0.1184 |
| 84669 | USP32 | A002-C-201 | Human | Colorectum | FAP | 2.42e-13 | -3.69e-01 | 0.0324 |
| 84669 | USP32 | A002-C-203 | Human | Colorectum | FAP | 6.01e-05 | -2.04e-01 | 0.2786 |
| 84669 | USP32 | A001-C-119 | Human | Colorectum | FAP | 1.18e-04 | -2.44e-01 | -0.1557 |
| 84669 | USP32 | A001-C-108 | Human | Colorectum | FAP | 8.27e-12 | -2.35e-01 | -0.0272 |
| 84669 | USP32 | A002-C-205 | Human | Colorectum | FAP | 4.04e-19 | -3.87e-01 | -0.1236 |
| 84669 | USP32 | A001-C-104 | Human | Colorectum | FAP | 8.94e-04 | -2.26e-01 | 0.0184 |
| Page: 1 2 3 4 5 6 7 |
| Tissue | Expression Dynamics | Abbreviation |
| Cervix | 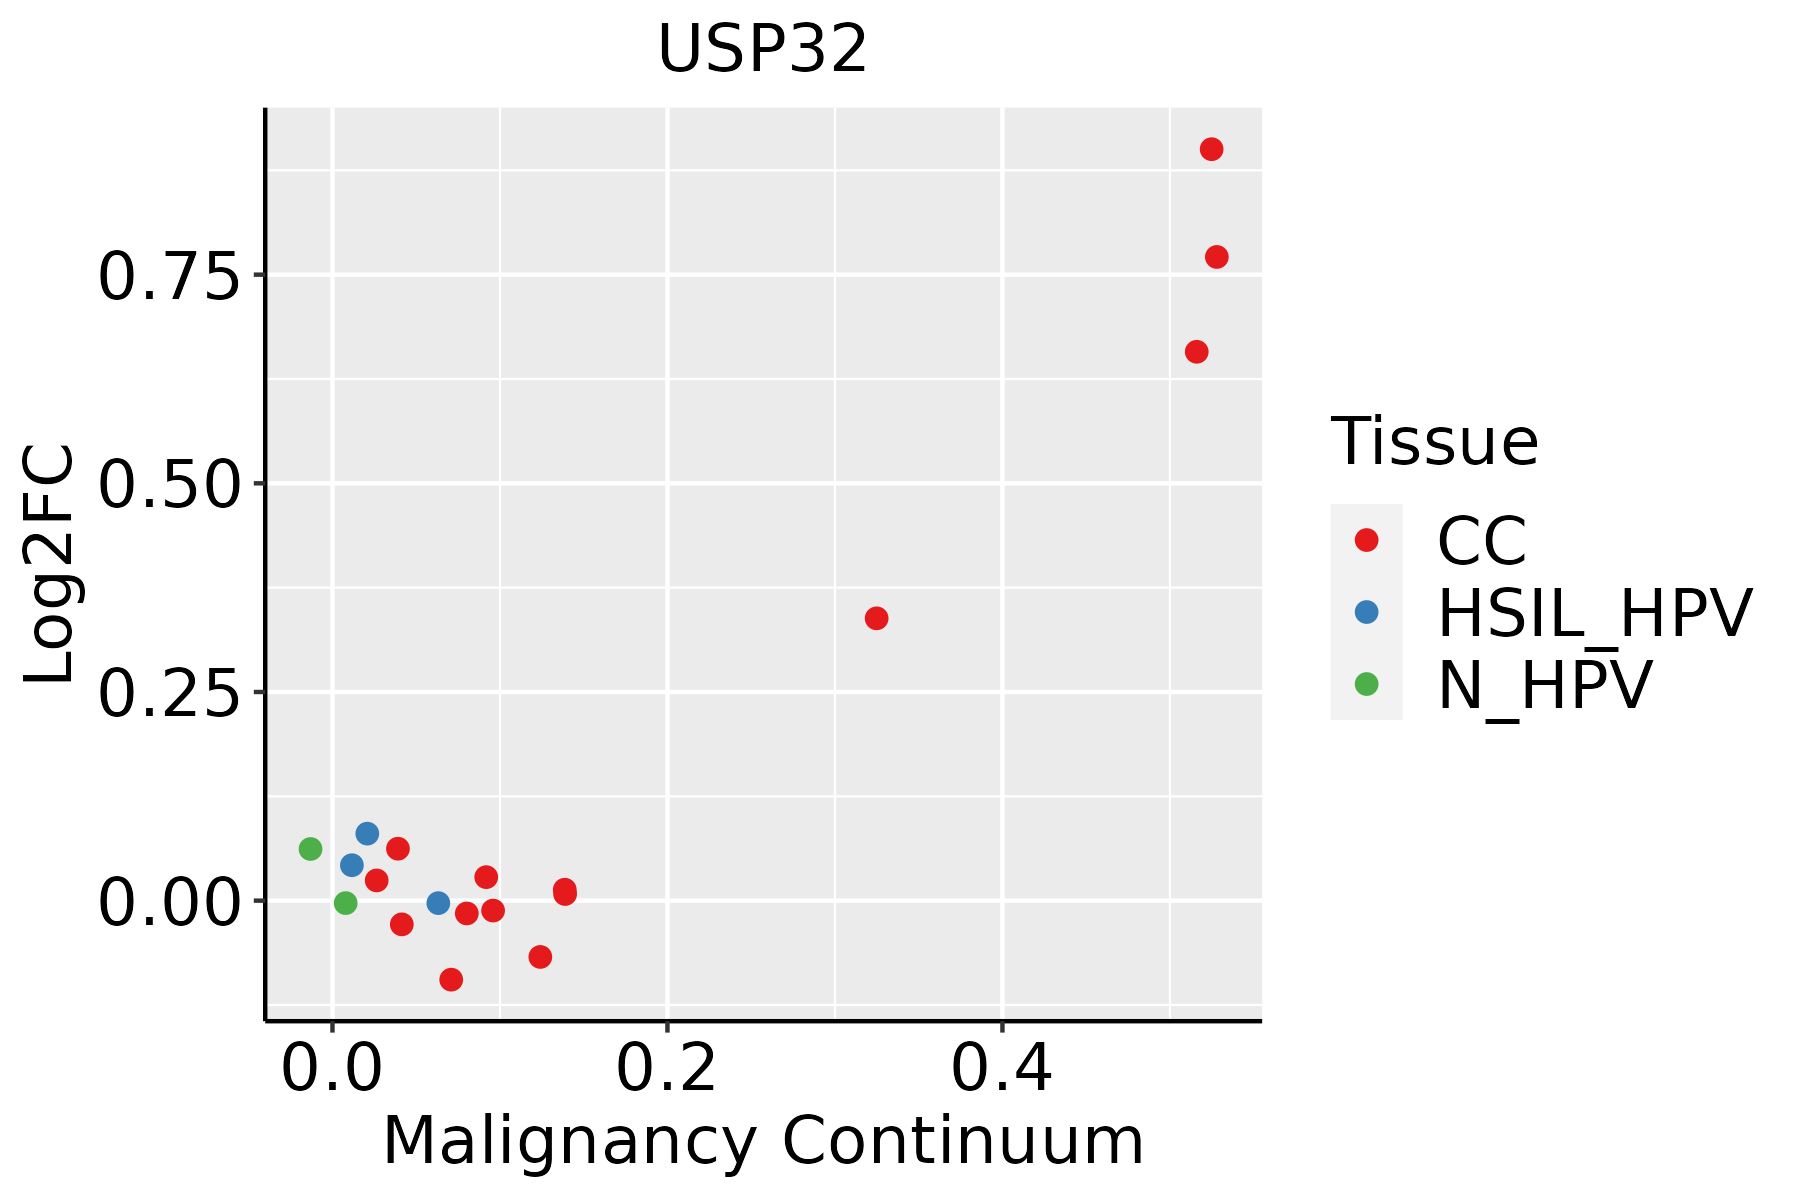 | CC: Cervix cancer |
| HSIL_HPV: HPV-infected high-grade squamous intraepithelial lesions | ||
| N_HPV: HPV-infected normal cervix | ||
| Colorectum (GSE201348) | 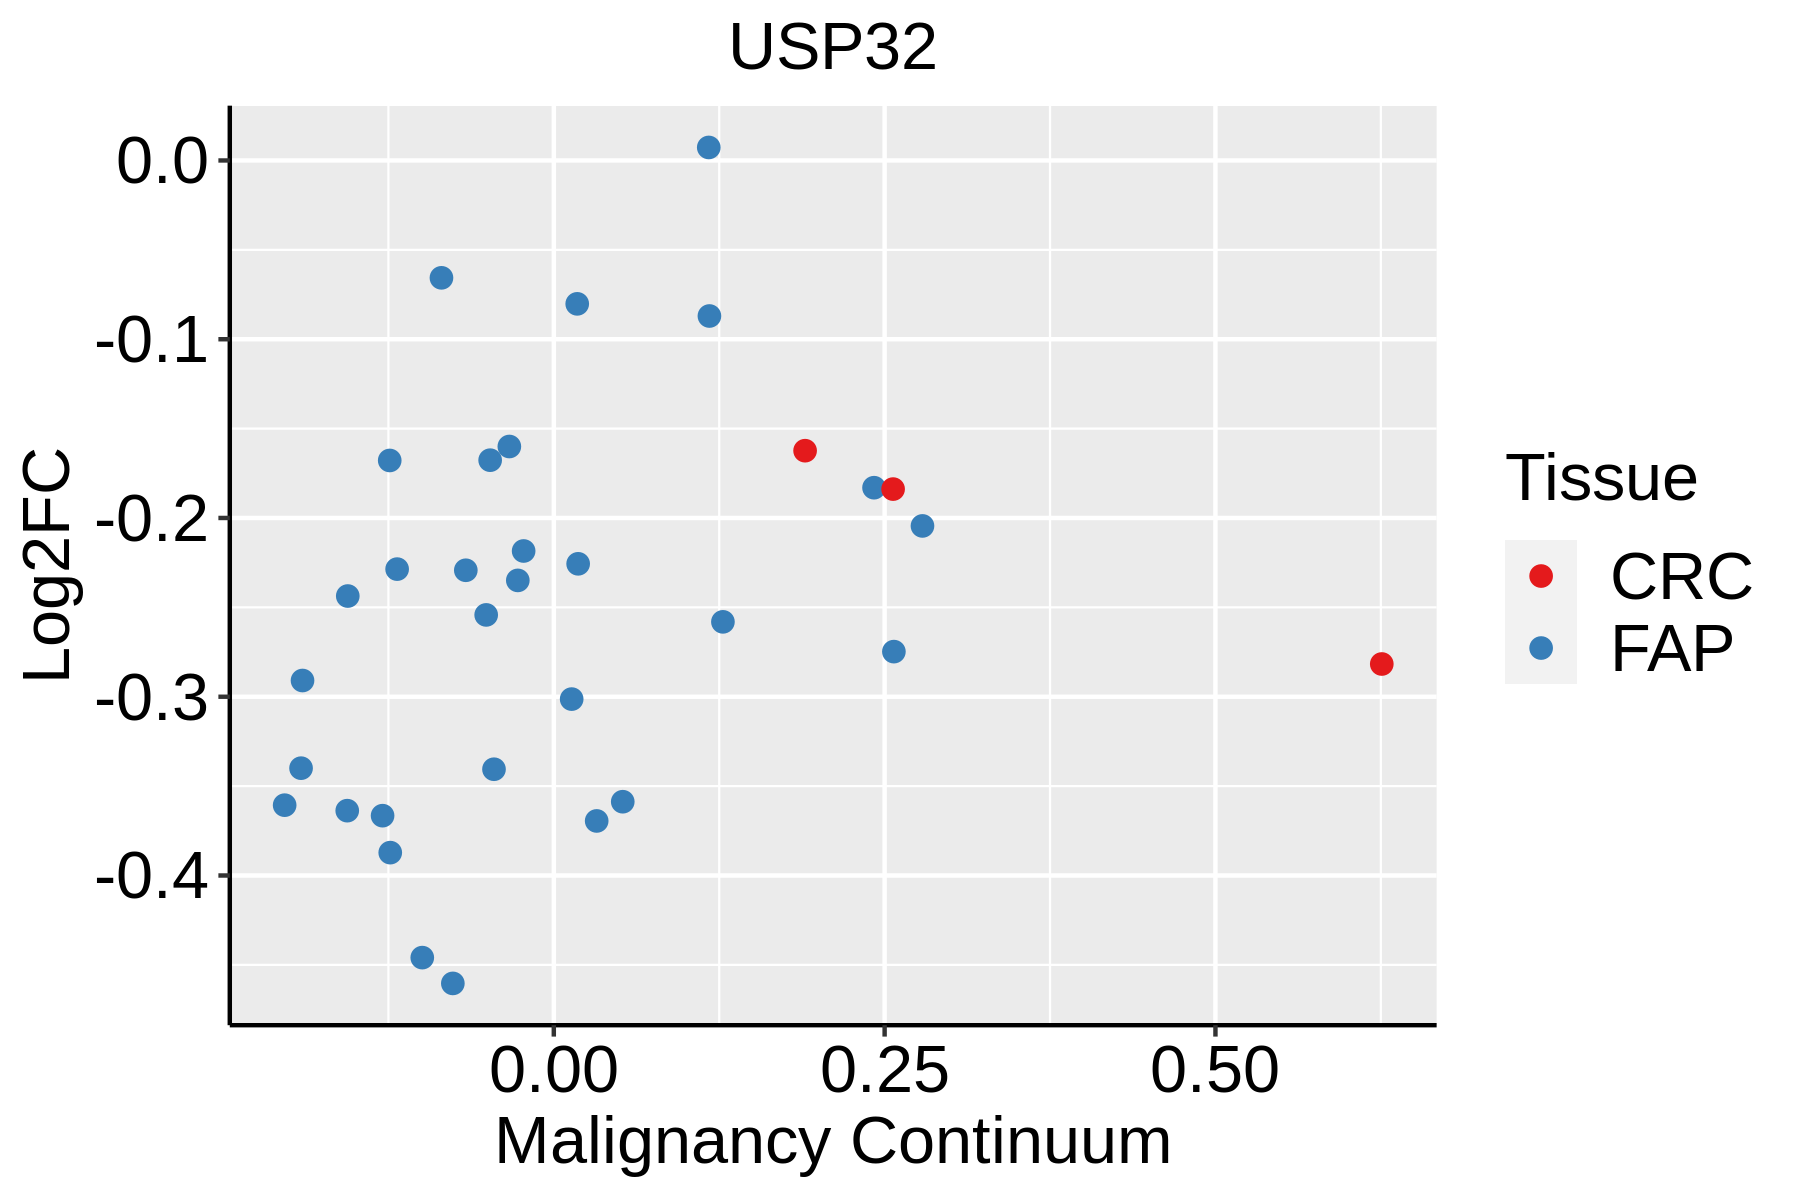 | FAP: Familial adenomatous polyposis |
| CRC: Colorectal cancer | ||
| Colorectum (HTA11) |  | AD: Adenomas |
| SER: Sessile serrated lesions | ||
| MSI-H: Microsatellite-high colorectal cancer | ||
| MSS: Microsatellite stable colorectal cancer | ||
| Endometrium | 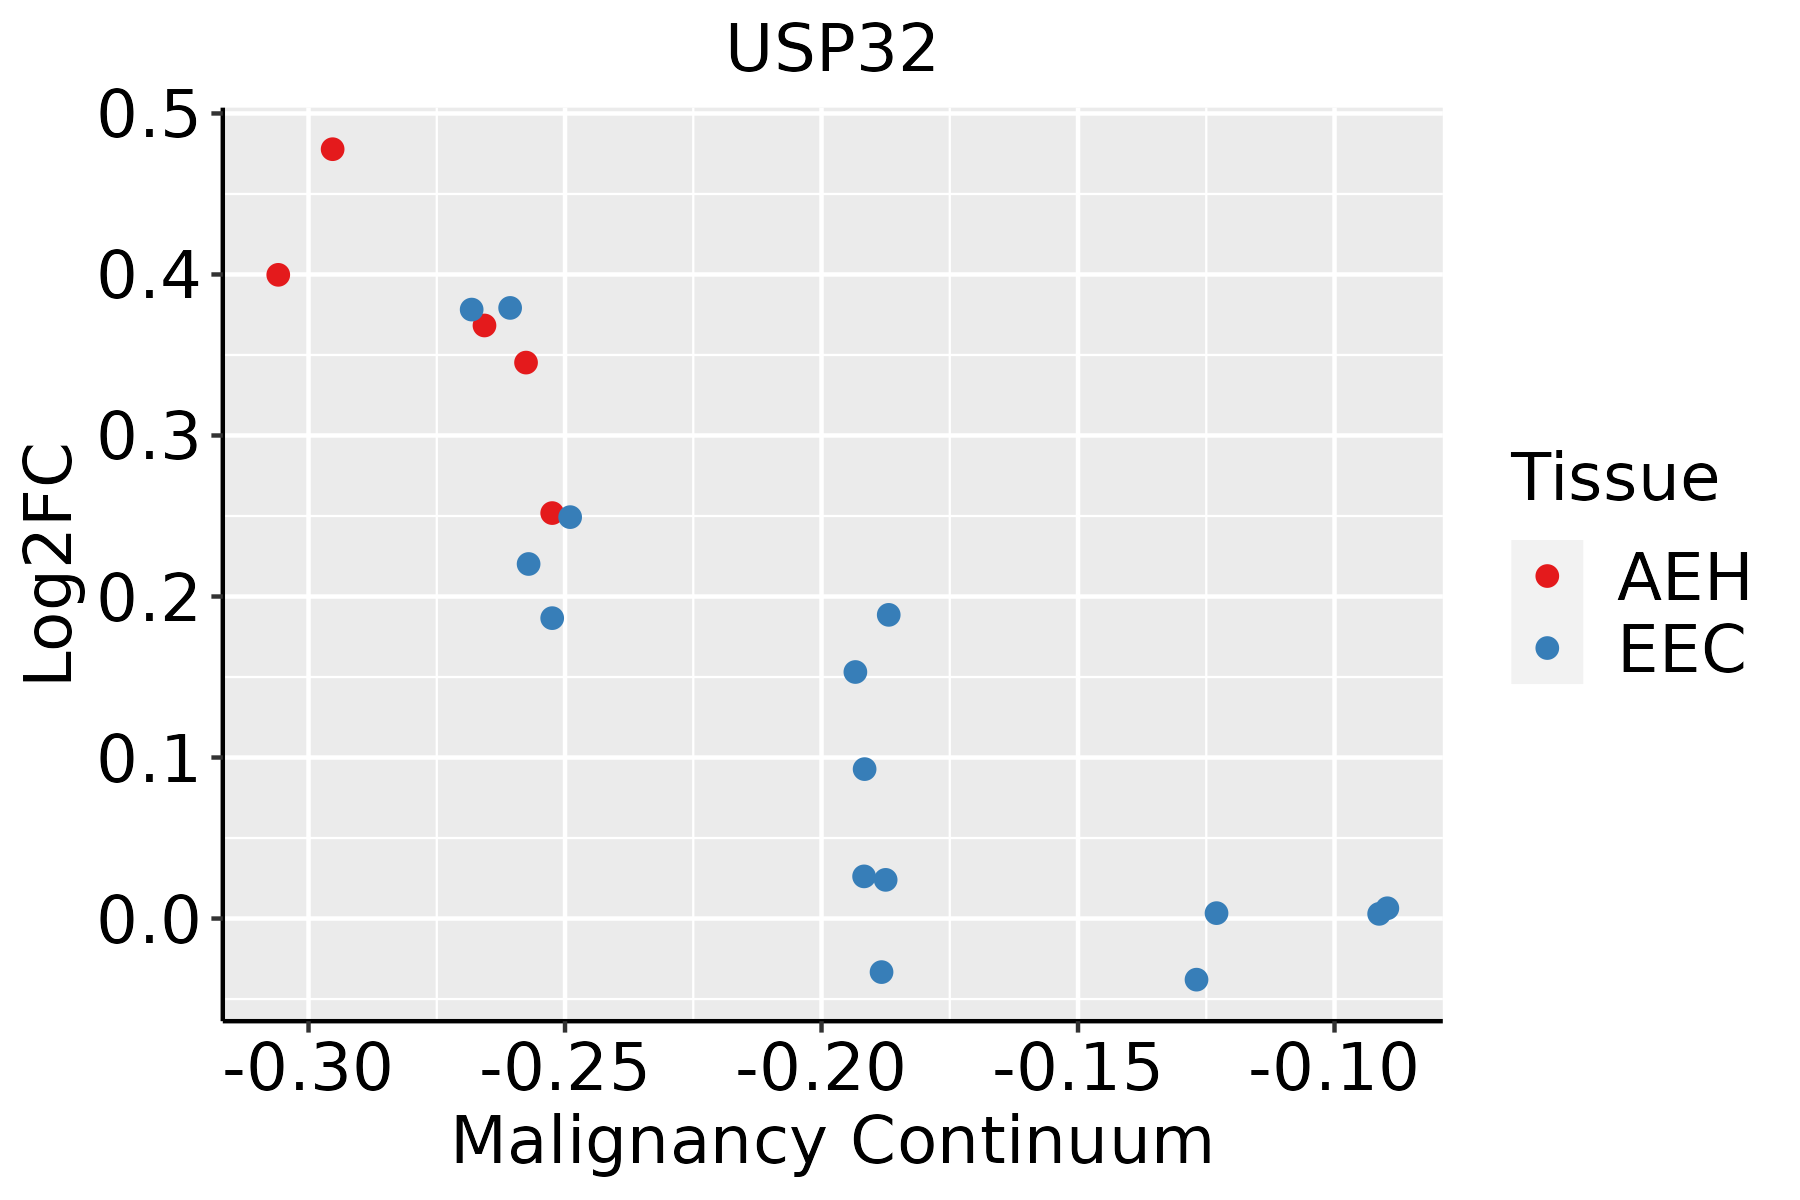 | AEH: Atypical endometrial hyperplasia |
| EEC: Endometrioid Cancer | ||
| Esophagus |  | ESCC: Esophageal squamous cell carcinoma |
| HGIN: High-grade intraepithelial neoplasias | ||
| LGIN: Low-grade intraepithelial neoplasias | ||
| Liver |  | HCC: Hepatocellular carcinoma |
| NAFLD: Non-alcoholic fatty liver disease | ||
| Lung | 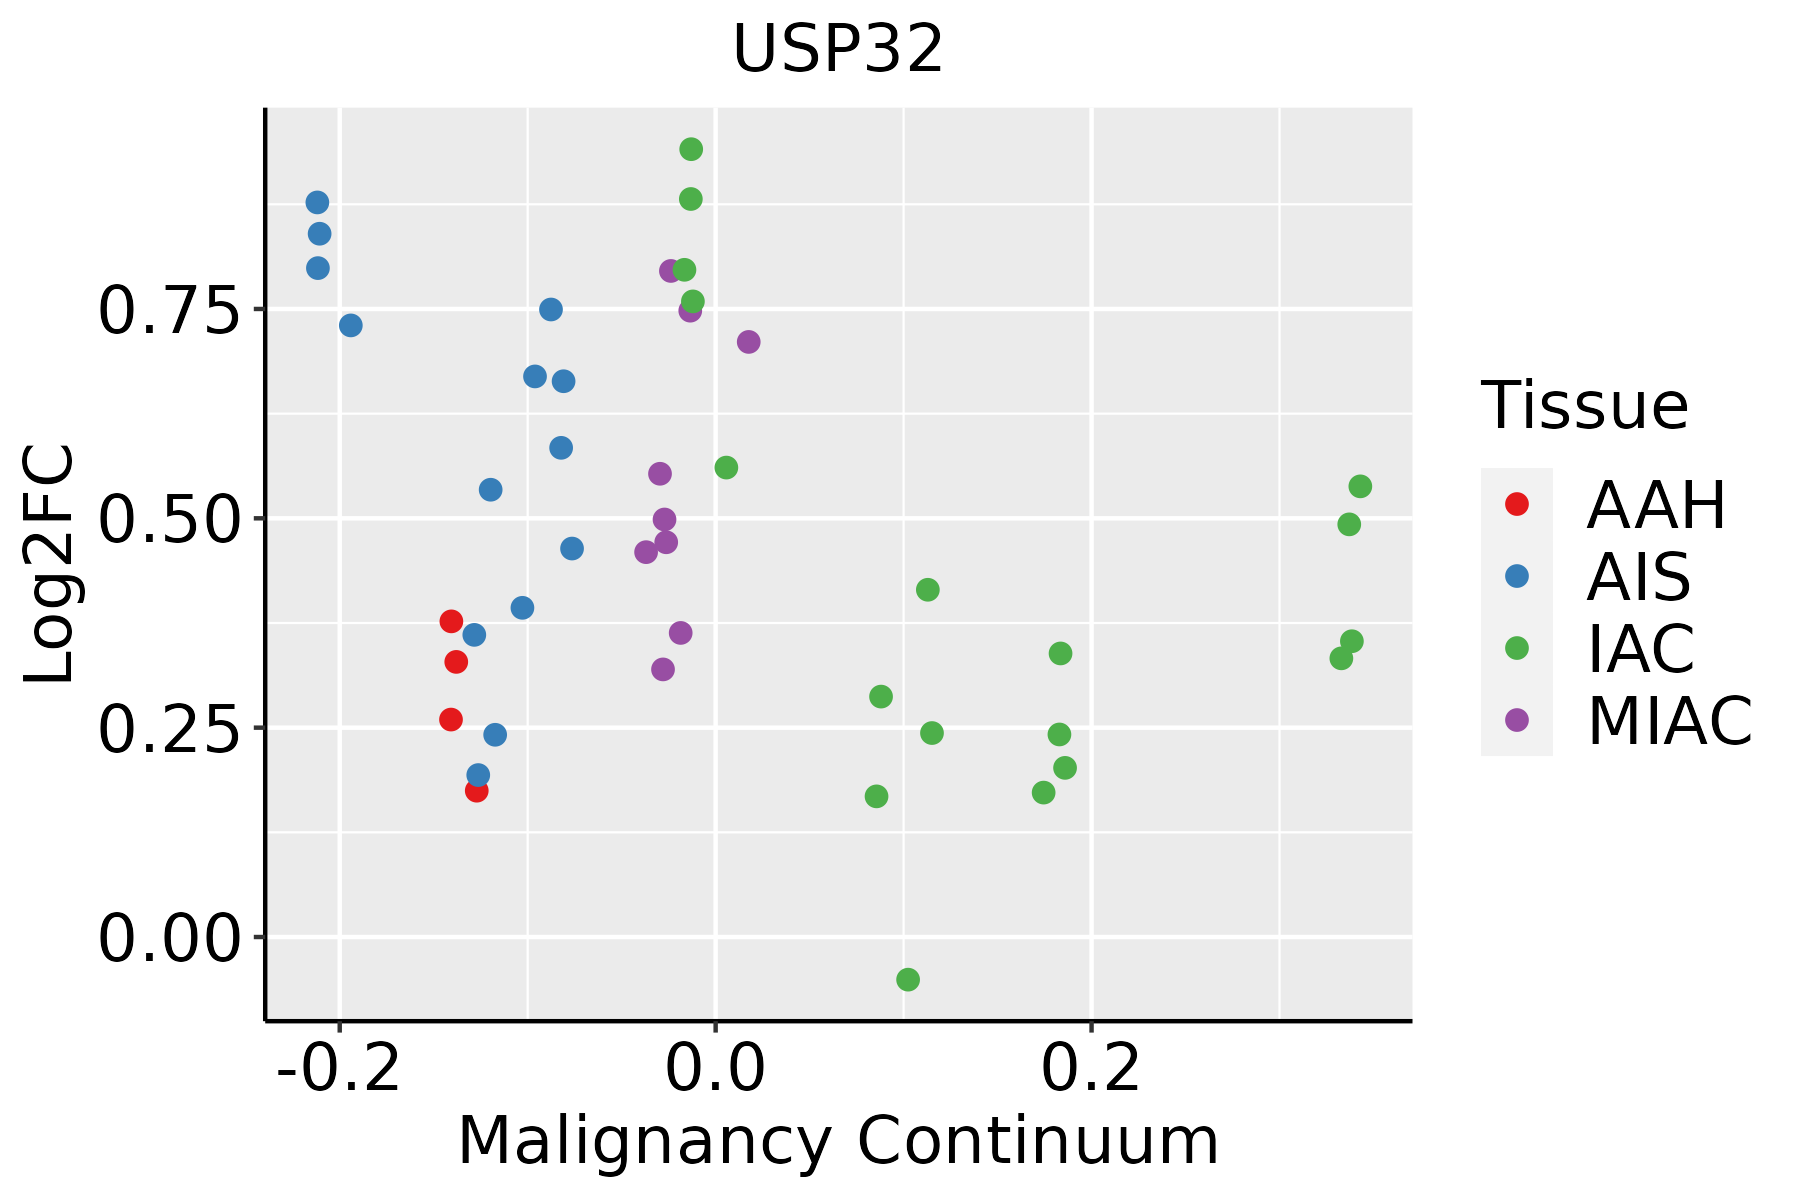 | AAH: Atypical adenomatous hyperplasia |
| AIS: Adenocarcinoma in situ | ||
| IAC: Invasive lung adenocarcinoma | ||
| MIA: Minimally invasive adenocarcinoma |
| ∗log2FC in expression of this searched gene in stem-like cells from each diseased tissue sample relative to stem-like cells in normal samples in each tissue plotted against the malignancy continuum. Samples are colored based on if they are from different disease stage. |
Top |
Malignant transformation related pathway analysis |
| Find out the enriched GO biological processes and KEGG pathways involved in transition from healthy to precancer to cancer |
| Tissue | Disease Stage | Enriched GO biological Processes |
| Colorectum | AD |  |
| Colorectum | SER |  |
| Colorectum | MSS |  |
| Colorectum | MSI-H |  |
| Colorectum | FAP |  |
| ∗Top 15 enriched GO BP terms are showed in the bar plot of each disease state in each tissue. Each row represents a significant GO biological process which is colored according to the -log10(p.adjust). |
| Page: 1 2 3 4 5 6 7 8 9 |
| GO ID | Tissue | Disease Stage | Description | Gene Ratio | Bg Ratio | pvalue | p.adjust | Count |
| GO:007064612 | Esophagus | ESCC | protein modification by small protein removal | 95/8552 | 157/18723 | 1.25e-04 | 8.56e-04 | 95 |
| GO:00165793 | Esophagus | ESCC | protein deubiquitination | 79/8552 | 139/18723 | 5.23e-03 | 1.97e-02 | 79 |
| GO:0070646 | Liver | NAFLD | protein modification by small protein removal | 29/1882 | 157/18723 | 9.11e-04 | 1.09e-02 | 29 |
| GO:0016579 | Liver | NAFLD | protein deubiquitination | 26/1882 | 139/18723 | 1.35e-03 | 1.52e-02 | 26 |
| GO:00706461 | Liver | HCC | protein modification by small protein removal | 91/7958 | 157/18723 | 6.50e-05 | 5.92e-04 | 91 |
| GO:00165791 | Liver | HCC | protein deubiquitination | 78/7958 | 139/18723 | 8.13e-04 | 4.87e-03 | 78 |
| Page: 1 |
| Pathway ID | Tissue | Disease Stage | Description | Gene Ratio | Bg Ratio | pvalue | p.adjust | qvalue | Count |
| Page: 1 |
Top |
Cell-cell communication analysis |
| Identification of potential cell-cell interactions between two cell types and their ligand-receptor pairs for different disease states |
| Ligand | Receptor | LRpair | Pathway | Tissue | Disease Stage |
| Page: 1 |
Top |
Single-cell gene regulatory network inference analysis |
| Find out the significant the regulons (TFs) and the target genes of each regulon across cell types for different disease states |
| TF | Cell Type | Tissue | Disease Stage | Target Gene | RSS | Regulon Activity |
| ∗The dot plots of a searched regulon are shown for all cell subpopulations in each disease state of each tissue based on the regulon specific score inferred using pySCENIC and by calculating the average expression. |
| Page: 1 |
Top |
Somatic mutation of malignant transformation related genes |
| Annotation of somatic variants for genes involved in malignant transformation |
| Hugo Symbol | Variant Class | Variant Classification | dbSNP RS | HGVSc | HGVSp | HGVSp Short | SWISSPROT | BIOTYPE | SIFT | PolyPhen | Tumor Sample Barcode | Tissue | Histology | Sex | Age | Stage | Therapy Types | Drugs | Outcome |
| USP32 | SNV | Missense_Mutation | novel | c.829G>A | p.Asp277Asn | p.D277N | Q8NFA0 | protein_coding | deleterious(0) | possibly_damaging(0.837) | TCGA-3C-AALK-01 | Breast | breast invasive carcinoma | Female | <65 | I/II | Chemotherapy | docetaxel | SD |
| USP32 | SNV | Missense_Mutation | c.1672N>C | p.Asp558His | p.D558H | Q8NFA0 | protein_coding | deleterious(0) | probably_damaging(0.985) | TCGA-A2-A04T-01 | Breast | breast invasive carcinoma | Female | <65 | I/II | Chemotherapy | cyclophosphamide | SD | |
| USP32 | SNV | Missense_Mutation | rs138623701 | c.590N>C | p.Ile197Thr | p.I197T | Q8NFA0 | protein_coding | tolerated(0.19) | benign(0.158) | TCGA-A7-A26E-01 | Breast | breast invasive carcinoma | Female | >=65 | III/IV | Chemotherapy | cytoxan | SD |
| USP32 | SNV | Missense_Mutation | c.40N>A | p.Glu14Lys | p.E14K | Q8NFA0 | protein_coding | deleterious(0.01) | benign(0.005) | TCGA-AC-A23H-01 | Breast | breast invasive carcinoma | Female | >=65 | I/II | Unknown | Unknown | PD | |
| USP32 | SNV | Missense_Mutation | novel | c.2146N>G | p.Ile716Val | p.I716V | Q8NFA0 | protein_coding | deleterious(0.03) | benign(0.063) | TCGA-AC-A3YJ-01 | Breast | breast invasive carcinoma | Female | >=65 | I/II | Hormone Therapy | arimidex | SD |
| USP32 | SNV | Missense_Mutation | rs755492407 | c.4049N>T | p.Ser1350Leu | p.S1350L | Q8NFA0 | protein_coding | tolerated_low_confidence(0.28) | benign(0.015) | TCGA-AN-A046-01 | Breast | breast invasive carcinoma | Female | >=65 | I/II | Unknown | Unknown | SD |
| USP32 | SNV | Missense_Mutation | novel | c.2308N>A | p.Glu770Lys | p.E770K | Q8NFA0 | protein_coding | deleterious(0) | probably_damaging(0.962) | TCGA-AO-A03P-01 | Breast | breast invasive carcinoma | Female | <65 | I/II | Hormone Therapy | letrozole | PD |
| USP32 | SNV | Missense_Mutation | c.3878N>C | p.Ile1293Thr | p.I1293T | Q8NFA0 | protein_coding | deleterious(0) | possibly_damaging(0.696) | TCGA-B6-A1KF-01 | Breast | breast invasive carcinoma | Female | >=65 | I/II | Unknown | Unknown | SD | |
| USP32 | SNV | Missense_Mutation | rs768752626 | c.1883C>T | p.Pro628Leu | p.P628L | Q8NFA0 | protein_coding | tolerated(0.06) | benign(0.048) | TCGA-BH-A0AW-01 | Breast | breast invasive carcinoma | Female | <65 | I/II | Chemotherapy | carboplatin | SD |
| USP32 | SNV | Missense_Mutation | c.4510N>G | p.Thr1504Ala | p.T1504A | Q8NFA0 | protein_coding | tolerated_low_confidence(0.46) | benign(0.006) | TCGA-BH-A18G-01 | Breast | breast invasive carcinoma | Female | >=65 | I/II | Unknown | Unknown | SD |
| Page: 1 2 3 4 5 6 7 8 9 10 11 12 13 14 15 16 |
Top |
Related drugs of malignant transformation related genes |
| Identification of chemicals and drugs interact with genes involved in malignant transfromation |
| (DGIdb 4.0) |
| Entrez ID | Symbol | Category | Interaction Types | Drug Claim Name | Drug Name | PMIDs |
| Page: 1 |

Copyright 2023-Present -The University of Texas Health Science Center at Houston |