
|
|||||
|
 | |
| |
| |
| |
| |
| |
|
Gene: USP31 |
Gene summary for USP31 |
| Gene information | Species | Human | Gene symbol | USP31 | Gene ID | 57478 |
| Gene name | ubiquitin specific peptidase 31 | |
| Gene Alias | USP31 | |
| Cytomap | 16p12.2 | |
| Gene Type | protein-coding | GO ID | GO:0006464 | UniProtAcc | Q70CQ4 |
Top |
Malignant transformation analysis |
| Identification of the aberrant gene expression in precancerous and cancerous lesions by comparing the gene expression of stem-like cells in diseased tissues with normal stem cells |
| Entrez ID | Symbol | Replicates | Species | Organ | Tissue | Adj P-value | Log2FC | Malignancy |
| 57478 | USP31 | CA_HPV_3 | Human | Cervix | CC | 2.16e-03 | 1.03e-01 | 0.0414 |
| 57478 | USP31 | CCI_2 | Human | Cervix | CC | 1.26e-08 | 1.09e+00 | 0.5249 |
| 57478 | USP31 | CCI_3 | Human | Cervix | CC | 6.98e-13 | 1.10e+00 | 0.516 |
| 57478 | USP31 | LZE4T | Human | Esophagus | ESCC | 3.81e-08 | 1.88e-01 | 0.0811 |
| 57478 | USP31 | LZE7T | Human | Esophagus | ESCC | 2.67e-04 | 1.69e-01 | 0.0667 |
| 57478 | USP31 | LZE24T | Human | Esophagus | ESCC | 3.90e-02 | 3.98e-02 | 0.0596 |
| 57478 | USP31 | P2T-E | Human | Esophagus | ESCC | 2.38e-23 | 5.88e-01 | 0.1177 |
| 57478 | USP31 | P4T-E | Human | Esophagus | ESCC | 1.85e-06 | 1.97e-01 | 0.1323 |
| 57478 | USP31 | P5T-E | Human | Esophagus | ESCC | 1.20e-11 | 2.20e-01 | 0.1327 |
| 57478 | USP31 | P8T-E | Human | Esophagus | ESCC | 2.30e-18 | 4.15e-01 | 0.0889 |
| 57478 | USP31 | P10T-E | Human | Esophagus | ESCC | 2.32e-22 | 4.15e-01 | 0.116 |
| 57478 | USP31 | P11T-E | Human | Esophagus | ESCC | 1.69e-07 | 3.96e-01 | 0.1426 |
| 57478 | USP31 | P12T-E | Human | Esophagus | ESCC | 9.92e-20 | 4.69e-01 | 0.1122 |
| 57478 | USP31 | P15T-E | Human | Esophagus | ESCC | 1.87e-13 | 3.32e-01 | 0.1149 |
| 57478 | USP31 | P16T-E | Human | Esophagus | ESCC | 9.54e-07 | 1.27e-01 | 0.1153 |
| 57478 | USP31 | P17T-E | Human | Esophagus | ESCC | 2.70e-07 | 2.40e-01 | 0.1278 |
| 57478 | USP31 | P21T-E | Human | Esophagus | ESCC | 2.96e-15 | 2.44e-01 | 0.1617 |
| 57478 | USP31 | P22T-E | Human | Esophagus | ESCC | 1.29e-15 | 2.73e-01 | 0.1236 |
| 57478 | USP31 | P23T-E | Human | Esophagus | ESCC | 2.03e-04 | 1.34e-01 | 0.108 |
| 57478 | USP31 | P24T-E | Human | Esophagus | ESCC | 8.52e-08 | 1.76e-01 | 0.1287 |
| Page: 1 2 3 4 5 |
| Tissue | Expression Dynamics | Abbreviation |
| Cervix | 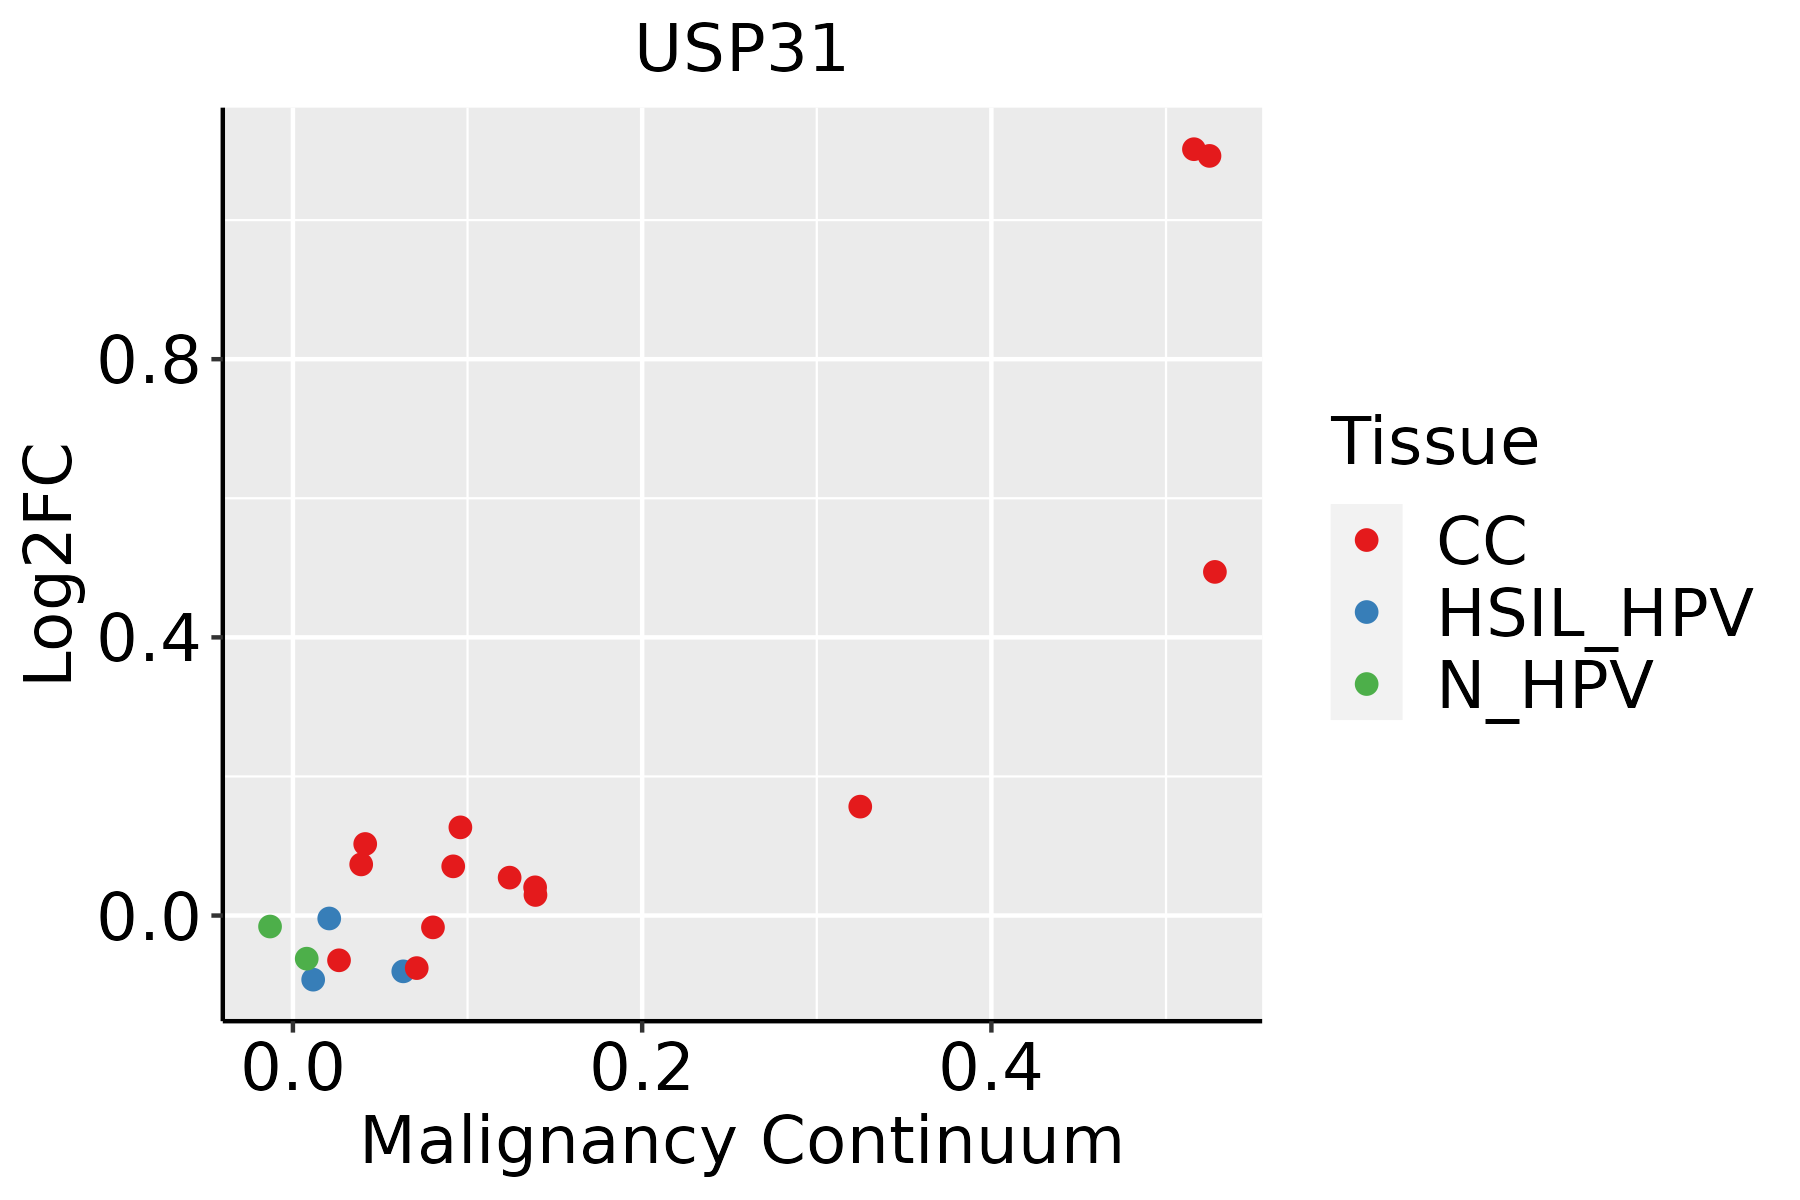 | CC: Cervix cancer |
| HSIL_HPV: HPV-infected high-grade squamous intraepithelial lesions | ||
| N_HPV: HPV-infected normal cervix | ||
| Esophagus | 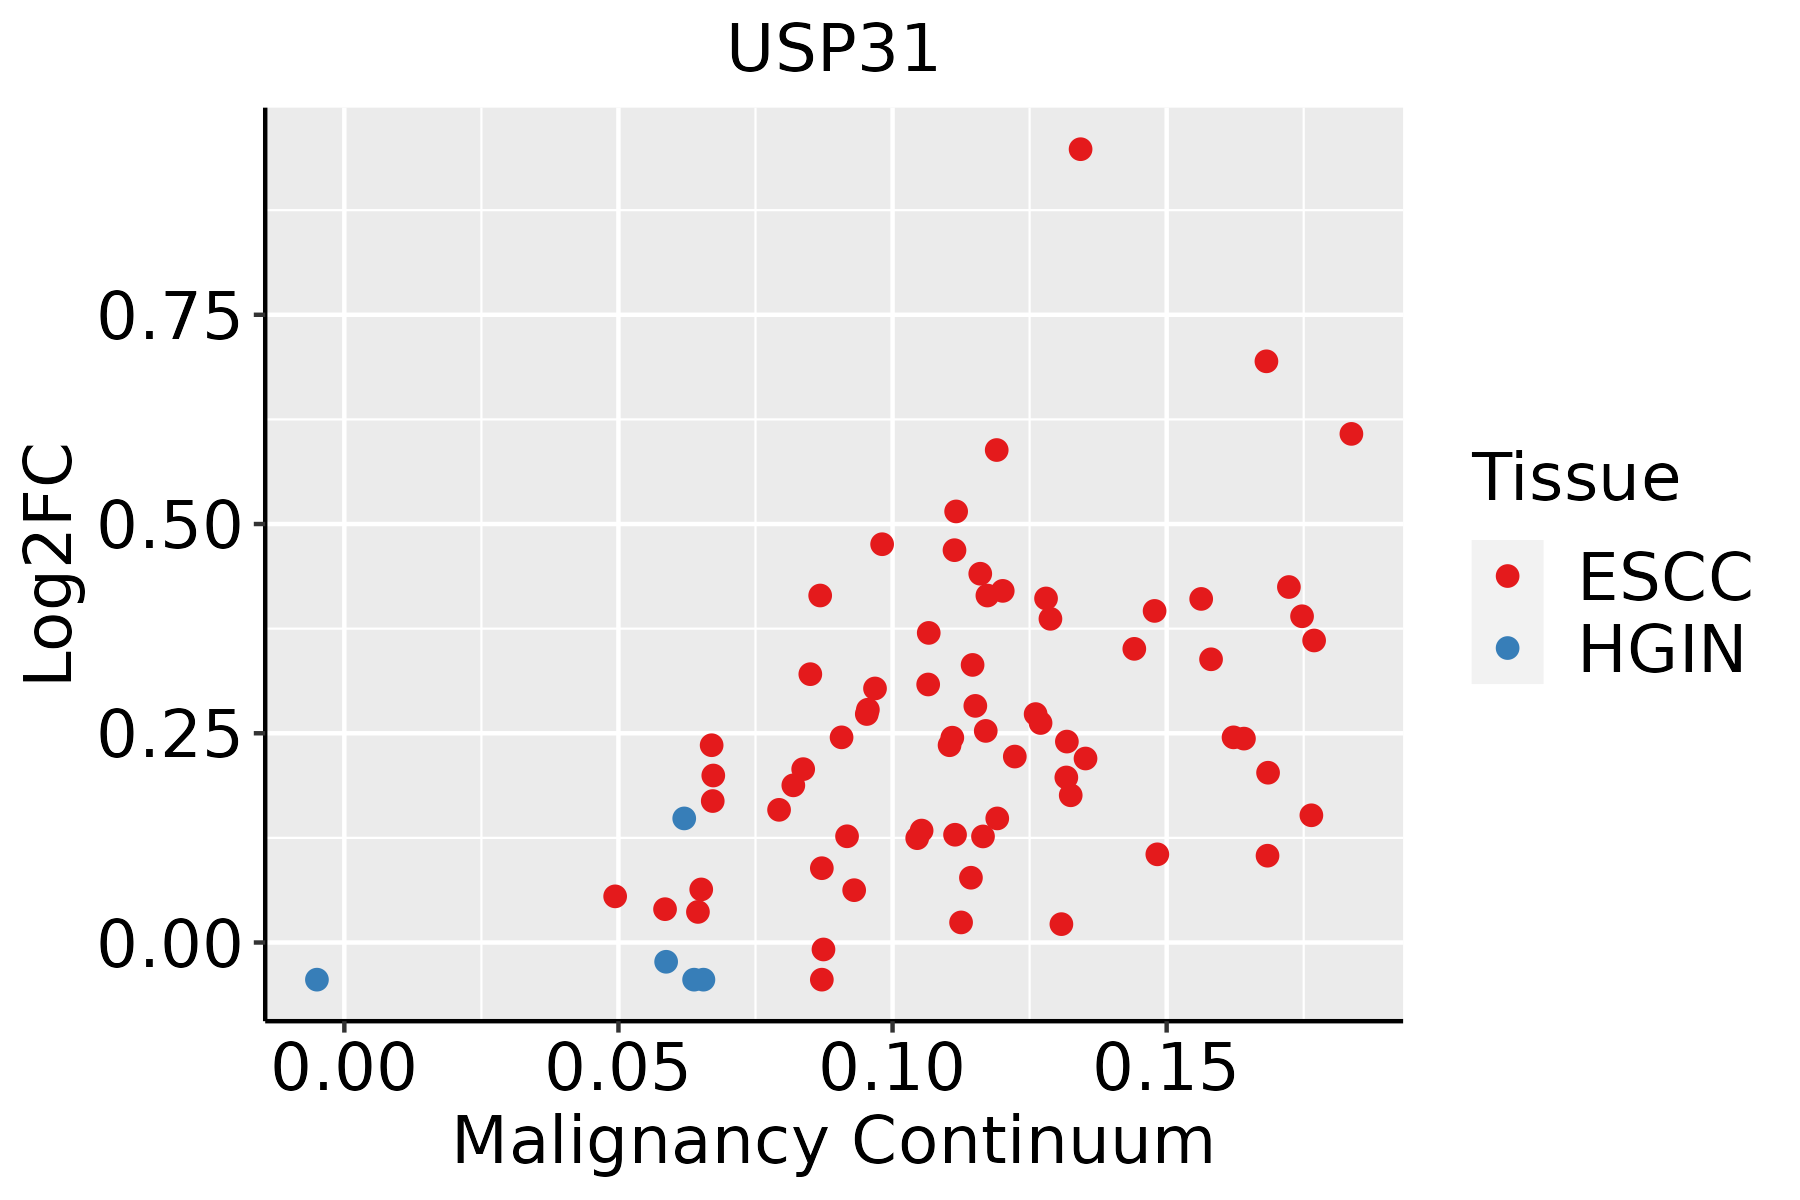 | ESCC: Esophageal squamous cell carcinoma |
| HGIN: High-grade intraepithelial neoplasias | ||
| LGIN: Low-grade intraepithelial neoplasias | ||
| Oral Cavity | 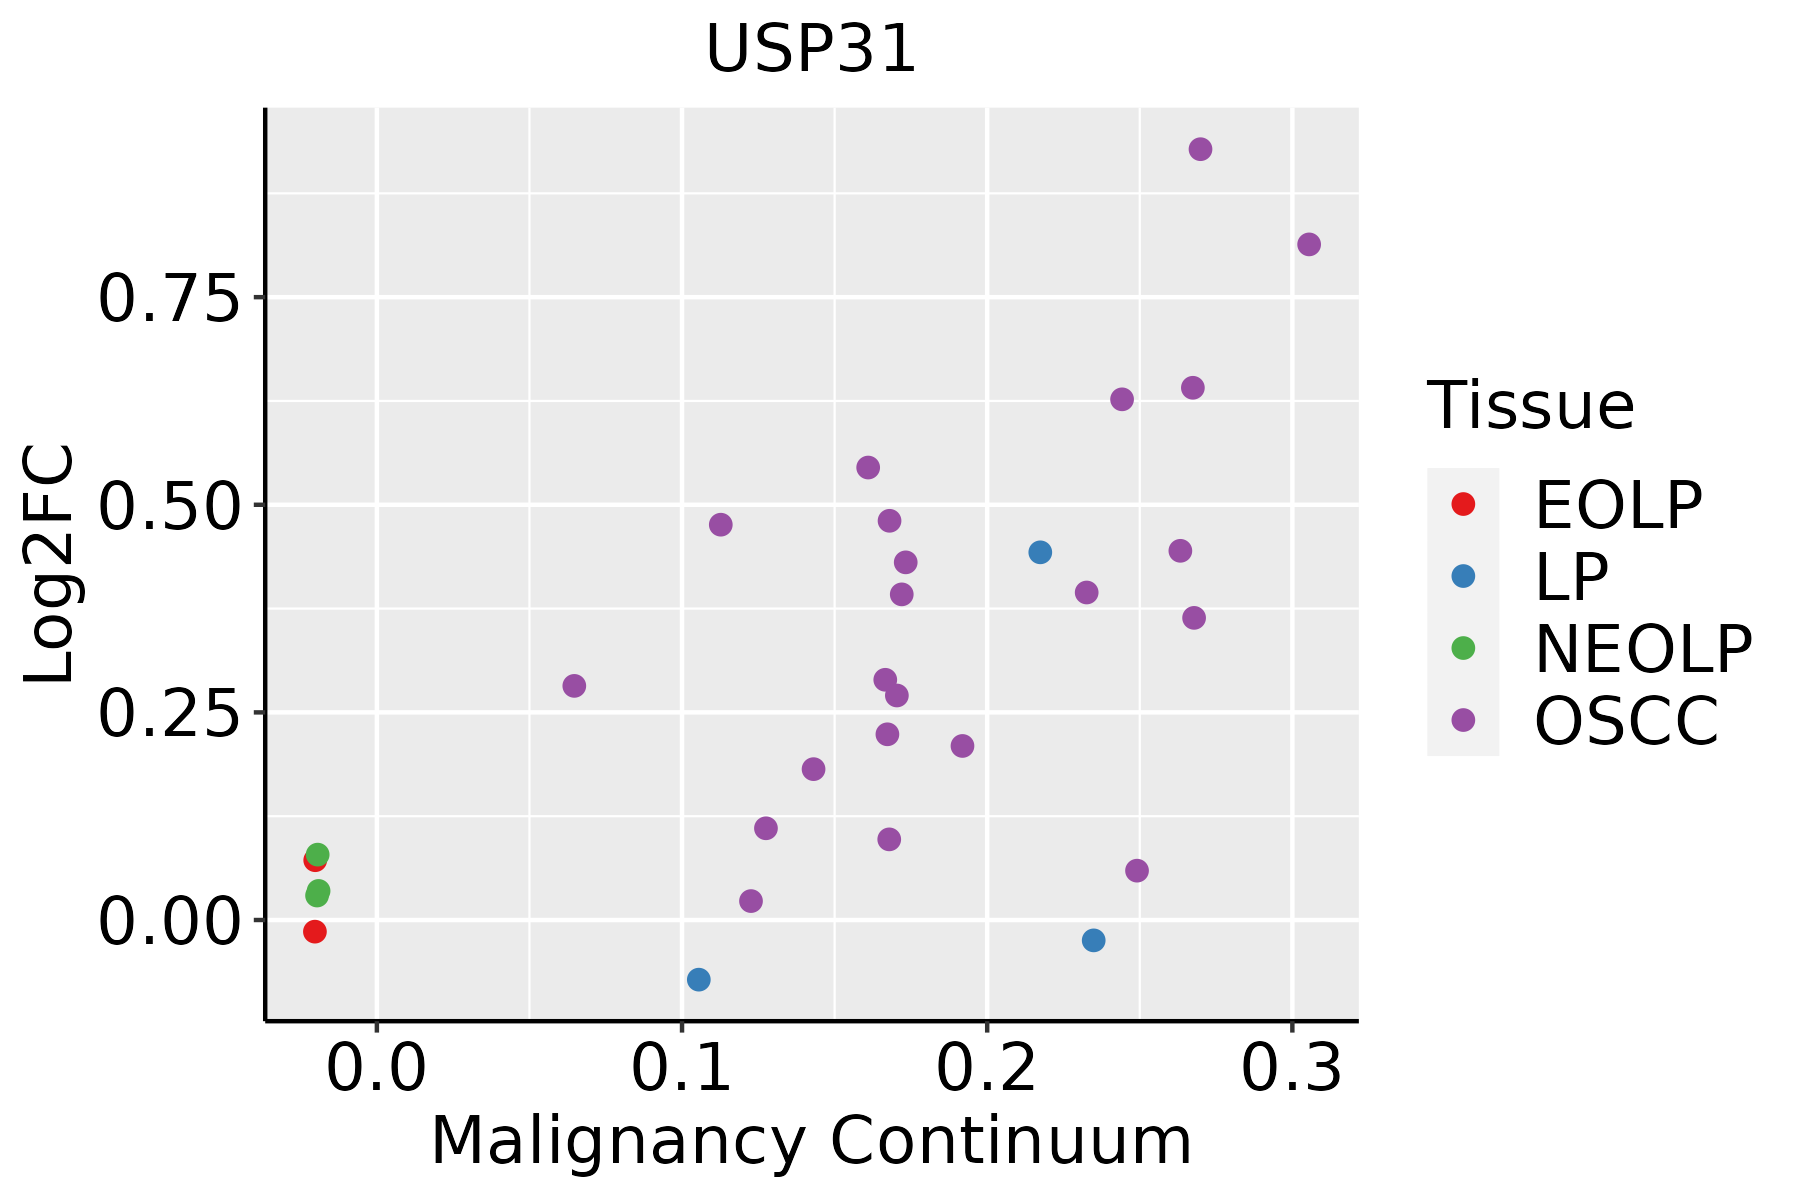 | EOLP: Erosive Oral lichen planus |
| LP: leukoplakia | ||
| NEOLP: Non-erosive oral lichen planus | ||
| OSCC: Oral squamous cell carcinoma | ||
| Prostate | 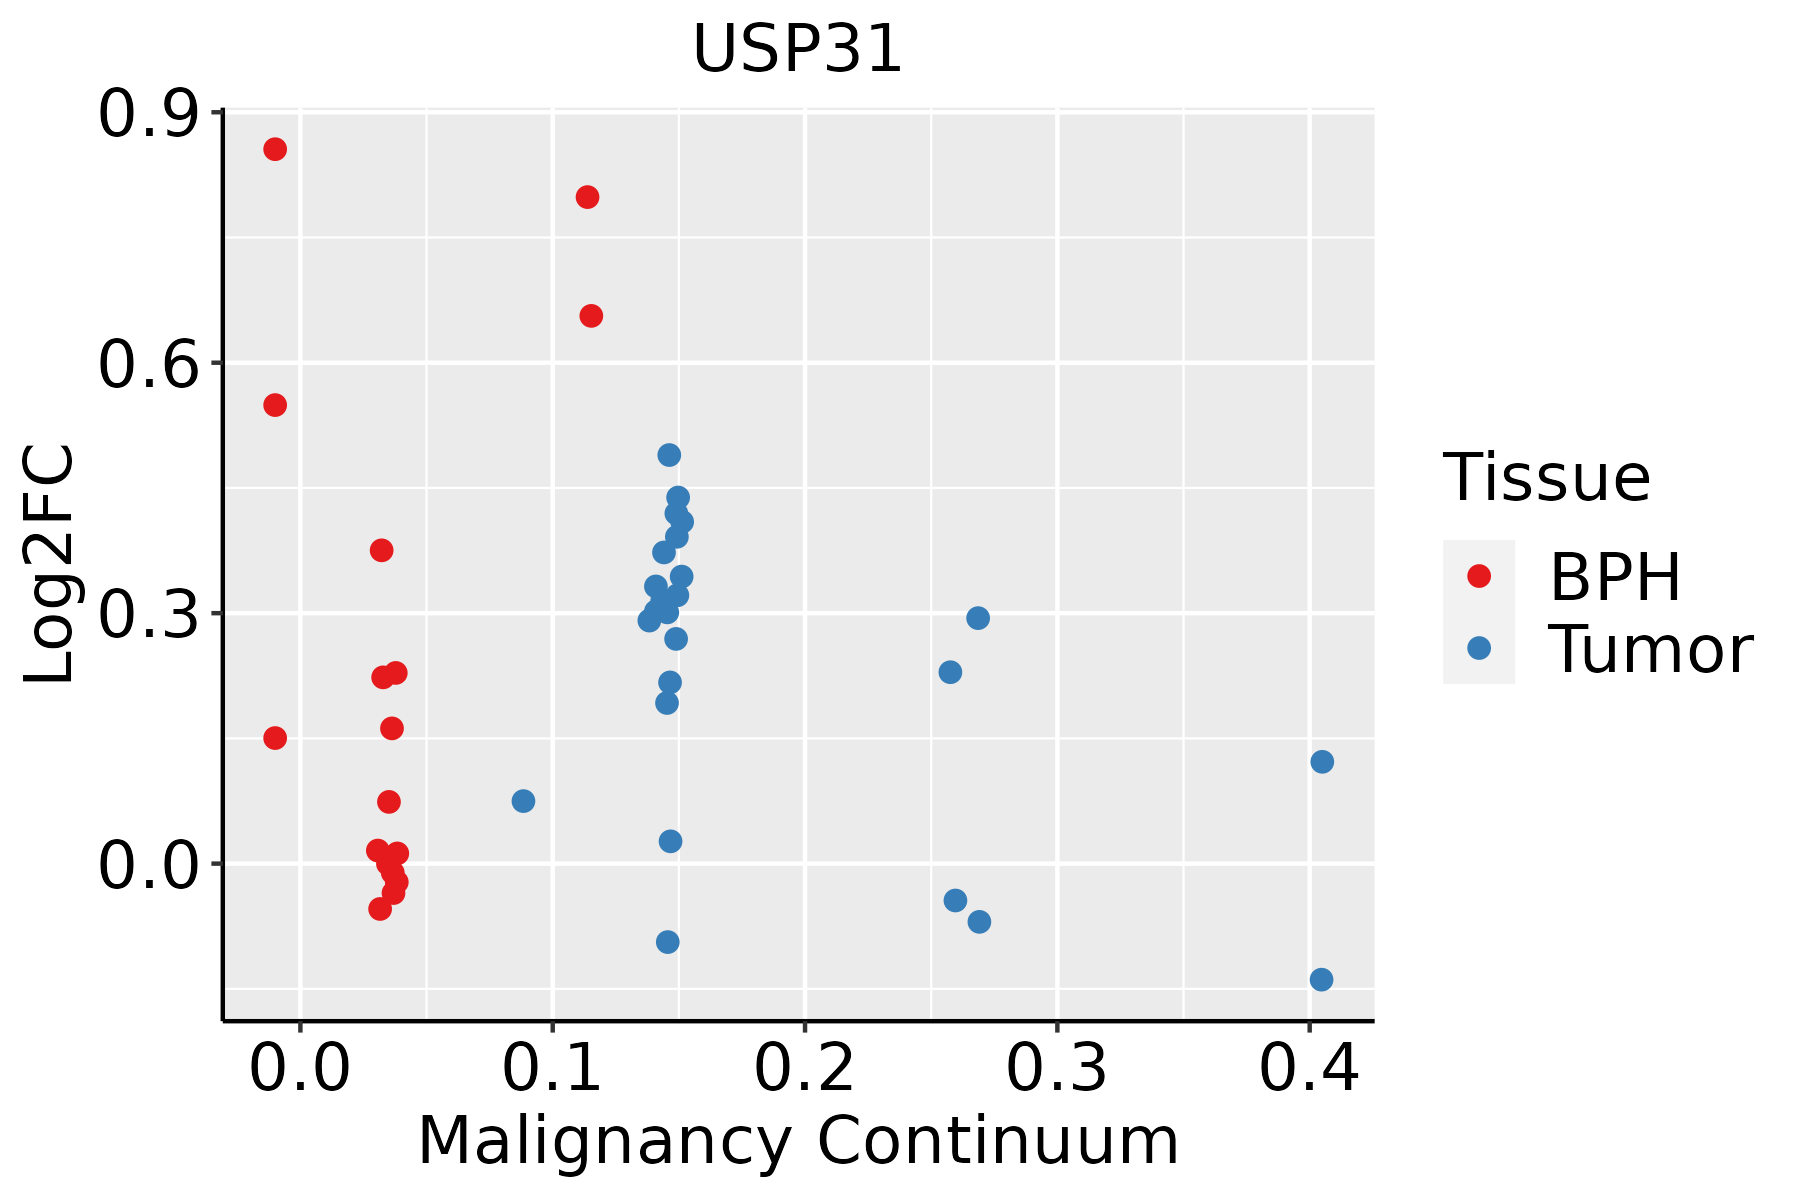 | BPH: Benign Prostatic Hyperplasia |
| ∗log2FC in expression of this searched gene in stem-like cells from each diseased tissue sample relative to stem-like cells in normal samples in each tissue plotted against the malignancy continuum. Samples are colored based on if they are from different disease stage. |
Top |
Malignant transformation related pathway analysis |
| Find out the enriched GO biological processes and KEGG pathways involved in transition from healthy to precancer to cancer |
| Tissue | Disease Stage | Enriched GO biological Processes |
| Colorectum | AD |  |
| Colorectum | SER |  |
| Colorectum | MSS |  |
| Colorectum | MSI-H |  |
| Colorectum | FAP |  |
| ∗Top 15 enriched GO BP terms are showed in the bar plot of each disease state in each tissue. Each row represents a significant GO biological process which is colored according to the -log10(p.adjust). |
| Page: 1 2 3 4 5 6 7 8 9 |
| GO ID | Tissue | Disease Stage | Description | Gene Ratio | Bg Ratio | pvalue | p.adjust | Count |
| GO:007064612 | Esophagus | ESCC | protein modification by small protein removal | 95/8552 | 157/18723 | 1.25e-04 | 8.56e-04 | 95 |
| GO:00165793 | Esophagus | ESCC | protein deubiquitination | 79/8552 | 139/18723 | 5.23e-03 | 1.97e-02 | 79 |
| GO:00706462 | Oral cavity | OSCC | protein modification by small protein removal | 77/7305 | 157/18723 | 6.55e-03 | 2.43e-02 | 77 |
| Page: 1 |
| Pathway ID | Tissue | Disease Stage | Description | Gene Ratio | Bg Ratio | pvalue | p.adjust | qvalue | Count |
| Page: 1 |
Top |
Cell-cell communication analysis |
| Identification of potential cell-cell interactions between two cell types and their ligand-receptor pairs for different disease states |
| Ligand | Receptor | LRpair | Pathway | Tissue | Disease Stage |
| Page: 1 |
Top |
Single-cell gene regulatory network inference analysis |
| Find out the significant the regulons (TFs) and the target genes of each regulon across cell types for different disease states |
| TF | Cell Type | Tissue | Disease Stage | Target Gene | RSS | Regulon Activity |
| ∗The dot plots of a searched regulon are shown for all cell subpopulations in each disease state of each tissue based on the regulon specific score inferred using pySCENIC and by calculating the average expression. |
| Page: 1 |
Top |
Somatic mutation of malignant transformation related genes |
| Annotation of somatic variants for genes involved in malignant transformation |
| Hugo Symbol | Variant Class | Variant Classification | dbSNP RS | HGVSc | HGVSp | HGVSp Short | SWISSPROT | BIOTYPE | SIFT | PolyPhen | Tumor Sample Barcode | Tissue | Histology | Sex | Age | Stage | Therapy Types | Drugs | Outcome |
| USP31 | SNV | Missense_Mutation | c.2254G>T | p.Val752Phe | p.V752F | Q70CQ4 | protein_coding | deleterious(0) | probably_damaging(0.999) | TCGA-A8-A06Y-01 | Breast | breast invasive carcinoma | Female | >=65 | I/II | Hormone Therapy | anastrozole | PD | |
| USP31 | SNV | Missense_Mutation | c.2597N>T | p.Ser866Leu | p.S866L | Q70CQ4 | protein_coding | tolerated(0.06) | benign(0.009) | TCGA-AC-A23H-01 | Breast | breast invasive carcinoma | Female | >=65 | I/II | Unknown | Unknown | PD | |
| USP31 | SNV | Missense_Mutation | c.2309N>T | p.Ser770Leu | p.S770L | Q70CQ4 | protein_coding | deleterious(0.03) | probably_damaging(0.983) | TCGA-AC-A23H-01 | Breast | breast invasive carcinoma | Female | >=65 | I/II | Unknown | Unknown | PD | |
| USP31 | SNV | Missense_Mutation | novel | c.2380N>T | p.Pro794Ser | p.P794S | Q70CQ4 | protein_coding | tolerated(0.22) | possibly_damaging(0.841) | TCGA-AC-A62Y-01 | Breast | breast invasive carcinoma | Female | >=65 | I/II | Unknown | Unknown | SD |
| USP31 | SNV | Missense_Mutation | novel | c.2504G>A | p.Arg835Gln | p.R835Q | Q70CQ4 | protein_coding | deleterious(0.01) | benign(0.049) | TCGA-AN-A046-01 | Breast | breast invasive carcinoma | Female | >=65 | I/II | Unknown | Unknown | SD |
| USP31 | SNV | Missense_Mutation | c.1337N>T | p.Ser446Phe | p.S446F | Q70CQ4 | protein_coding | tolerated(0.19) | benign(0.066) | TCGA-BH-A0W7-01 | Breast | breast invasive carcinoma | Female | <65 | I/II | Chemotherapy | taxotere | CR | |
| USP31 | SNV | Missense_Mutation | c.1751G>A | p.Arg584His | p.R584H | Q70CQ4 | protein_coding | deleterious(0.02) | probably_damaging(0.961) | TCGA-E2-A14T-01 | Breast | breast invasive carcinoma | Female | <65 | I/II | Chemotherapy | doxorubicin | SD | |
| USP31 | insertion | Frame_Shift_Ins | novel | c.1063_1064insATGCTCCTGTGAACATTCCACACAAGTTTTTGTGTGG | p.Met355AsnfsTer20 | p.M355Nfs*20 | Q70CQ4 | protein_coding | TCGA-A8-A0A2-01 | Breast | breast invasive carcinoma | Female | >=65 | I/II | Hormone Therapy | tamoxiphen | SD | ||
| USP31 | deletion | Frame_Shift_Del | novel | c.2458delG | p.Glu820ArgfsTer2 | p.E820Rfs*2 | Q70CQ4 | protein_coding | TCGA-EW-A2FV-01 | Breast | breast invasive carcinoma | Female | <65 | III/IV | Chemotherapy | docetaxel | SD | ||
| USP31 | deletion | Frame_Shift_Del | novel | c.2138delG | p.Cys713SerfsTer78 | p.C713Sfs*78 | Q70CQ4 | protein_coding | TCGA-EW-A2FV-01 | Breast | breast invasive carcinoma | Female | <65 | III/IV | Chemotherapy | docetaxel | SD |
| Page: 1 2 3 4 5 6 7 8 9 10 11 12 13 14 15 |
Top |
Related drugs of malignant transformation related genes |
| Identification of chemicals and drugs interact with genes involved in malignant transfromation |
| (DGIdb 4.0) |
| Entrez ID | Symbol | Category | Interaction Types | Drug Claim Name | Drug Name | PMIDs |
| Page: 1 |

Copyright 2023-Present -The University of Texas Health Science Center at Houston |