
|
|||||
|
 | |
| |
| |
| |
| |
| |
|
Gene: USP3 |
Gene summary for USP3 |
| Gene information | Species | Human | Gene symbol | USP3 | Gene ID | 9960 |
| Gene name | ubiquitin specific peptidase 3 | |
| Gene Alias | SIH003 | |
| Cytomap | 15q22.31 | |
| Gene Type | protein-coding | GO ID | GO:0000122 | UniProtAcc | Q9Y6I4 |
Top |
Malignant transformation analysis |
| Identification of the aberrant gene expression in precancerous and cancerous lesions by comparing the gene expression of stem-like cells in diseased tissues with normal stem cells |
| Entrez ID | Symbol | Replicates | Species | Organ | Tissue | Adj P-value | Log2FC | Malignancy |
| 9960 | USP3 | CCI_2 | Human | Cervix | CC | 1.24e-10 | 1.17e+00 | 0.5249 |
| 9960 | USP3 | CCI_3 | Human | Cervix | CC | 4.49e-03 | 5.46e-01 | 0.516 |
| 9960 | USP3 | HTA11_3410_2000001011 | Human | Colorectum | AD | 1.72e-39 | -8.69e-01 | 0.0155 |
| 9960 | USP3 | HTA11_2487_2000001011 | Human | Colorectum | SER | 5.27e-20 | -7.58e-01 | -0.1808 |
| 9960 | USP3 | HTA11_2951_2000001011 | Human | Colorectum | AD | 3.44e-04 | -8.02e-01 | 0.0216 |
| 9960 | USP3 | HTA11_1938_2000001011 | Human | Colorectum | AD | 4.98e-12 | -6.80e-01 | -0.0811 |
| 9960 | USP3 | HTA11_78_2000001011 | Human | Colorectum | AD | 2.79e-21 | -7.10e-01 | -0.1088 |
| 9960 | USP3 | HTA11_347_2000001011 | Human | Colorectum | AD | 3.81e-09 | -3.98e-01 | -0.1954 |
| 9960 | USP3 | HTA11_2112_2000001011 | Human | Colorectum | SER | 2.54e-06 | -9.38e-01 | -0.2196 |
| 9960 | USP3 | HTA11_3361_2000001011 | Human | Colorectum | AD | 1.80e-14 | -8.15e-01 | -0.1207 |
| 9960 | USP3 | HTA11_83_2000001011 | Human | Colorectum | SER | 1.16e-09 | -7.48e-01 | -0.1526 |
| 9960 | USP3 | HTA11_696_2000001011 | Human | Colorectum | AD | 1.15e-43 | -8.09e-01 | -0.1464 |
| 9960 | USP3 | HTA11_866_2000001011 | Human | Colorectum | AD | 4.05e-34 | -7.74e-01 | -0.1001 |
| 9960 | USP3 | HTA11_1391_2000001011 | Human | Colorectum | AD | 1.51e-07 | -5.14e-01 | -0.059 |
| 9960 | USP3 | HTA11_2992_2000001011 | Human | Colorectum | SER | 5.95e-04 | -7.26e-01 | -0.1706 |
| 9960 | USP3 | HTA11_5212_2000001011 | Human | Colorectum | AD | 2.21e-06 | -8.02e-01 | -0.2061 |
| 9960 | USP3 | HTA11_5216_2000001011 | Human | Colorectum | SER | 5.44e-03 | -5.92e-01 | -0.1462 |
| 9960 | USP3 | HTA11_546_2000001011 | Human | Colorectum | AD | 9.20e-13 | -8.52e-01 | -0.0842 |
| 9960 | USP3 | HTA11_9341_2000001011 | Human | Colorectum | SER | 1.38e-04 | -9.49e-01 | -0.00410000000000005 |
| 9960 | USP3 | HTA11_7862_2000001011 | Human | Colorectum | AD | 3.85e-08 | -8.12e-01 | -0.0179 |
| Page: 1 2 3 4 5 6 7 8 9 10 |
| Tissue | Expression Dynamics | Abbreviation |
| Cervix | 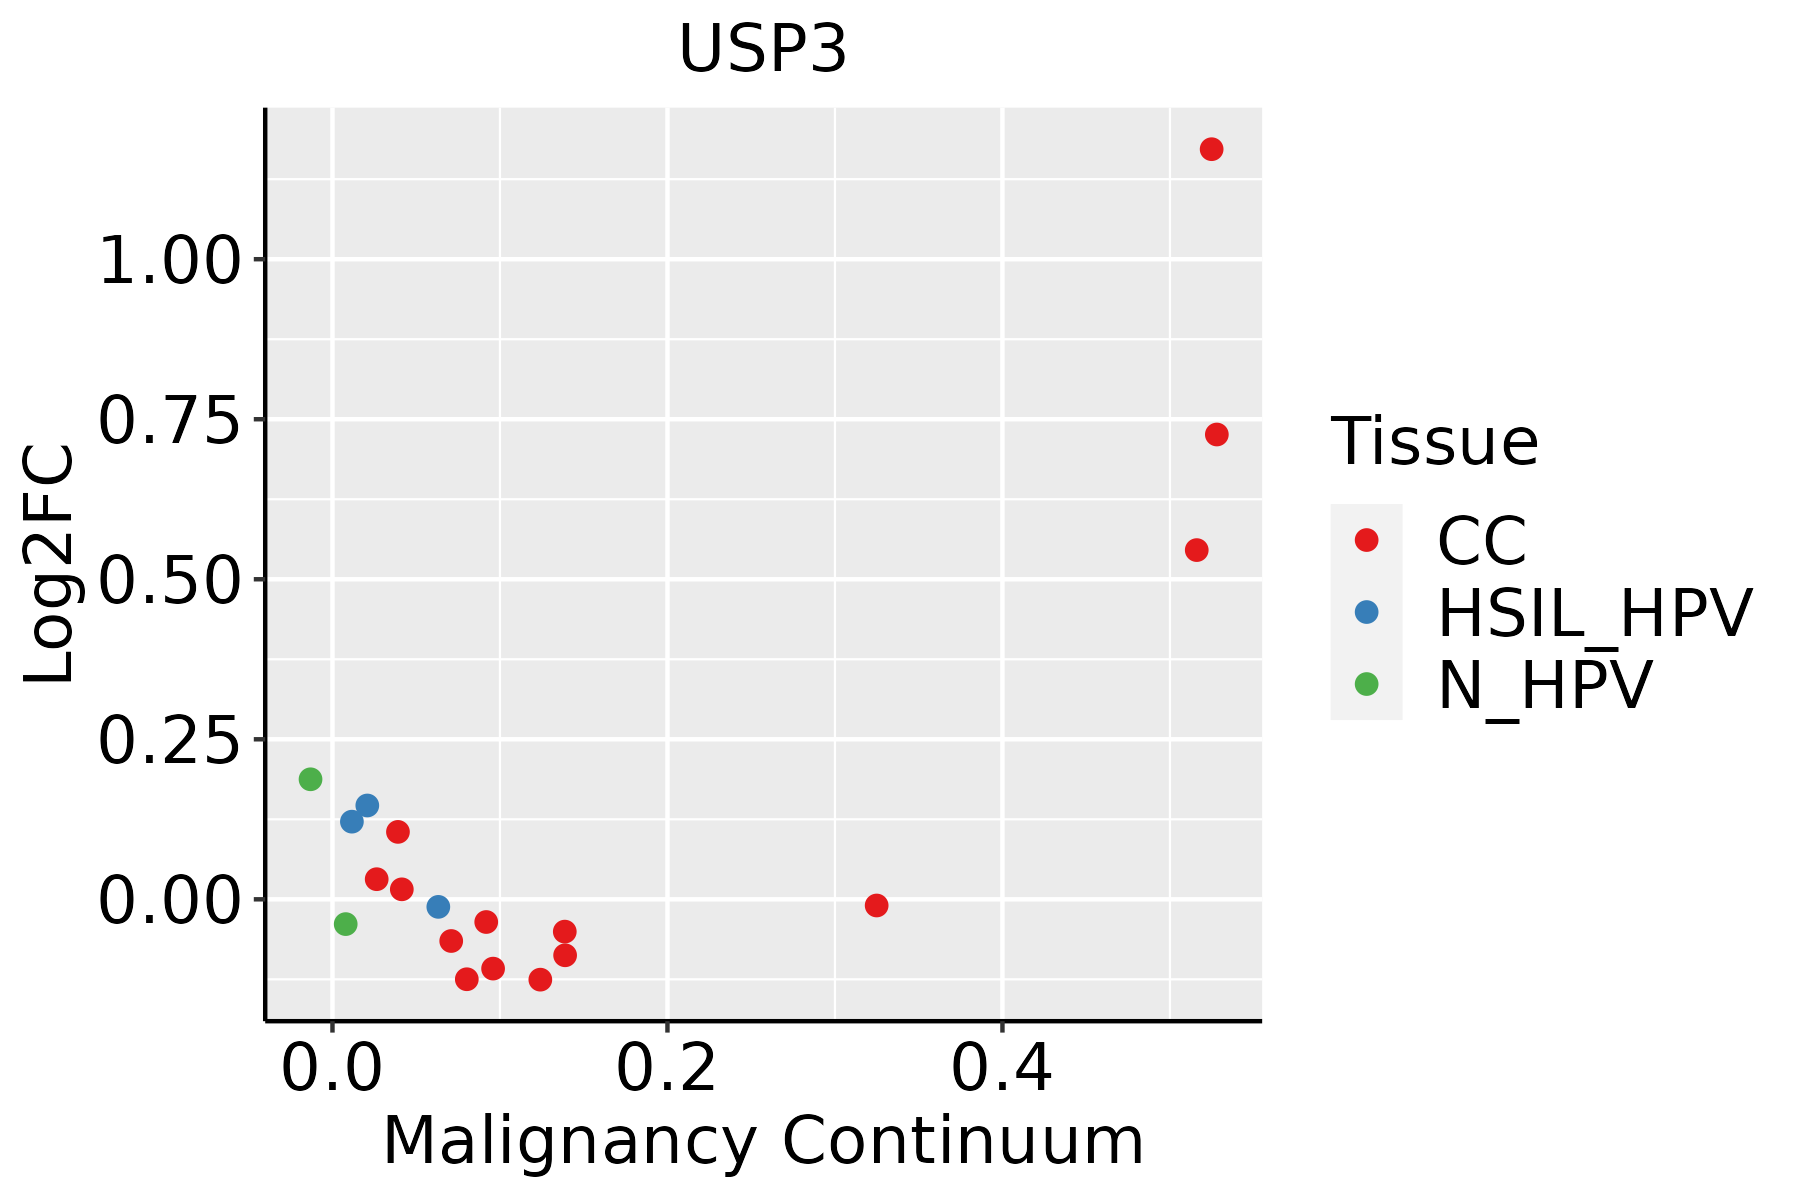 | CC: Cervix cancer |
| HSIL_HPV: HPV-infected high-grade squamous intraepithelial lesions | ||
| N_HPV: HPV-infected normal cervix | ||
| Colorectum (GSE201348) | 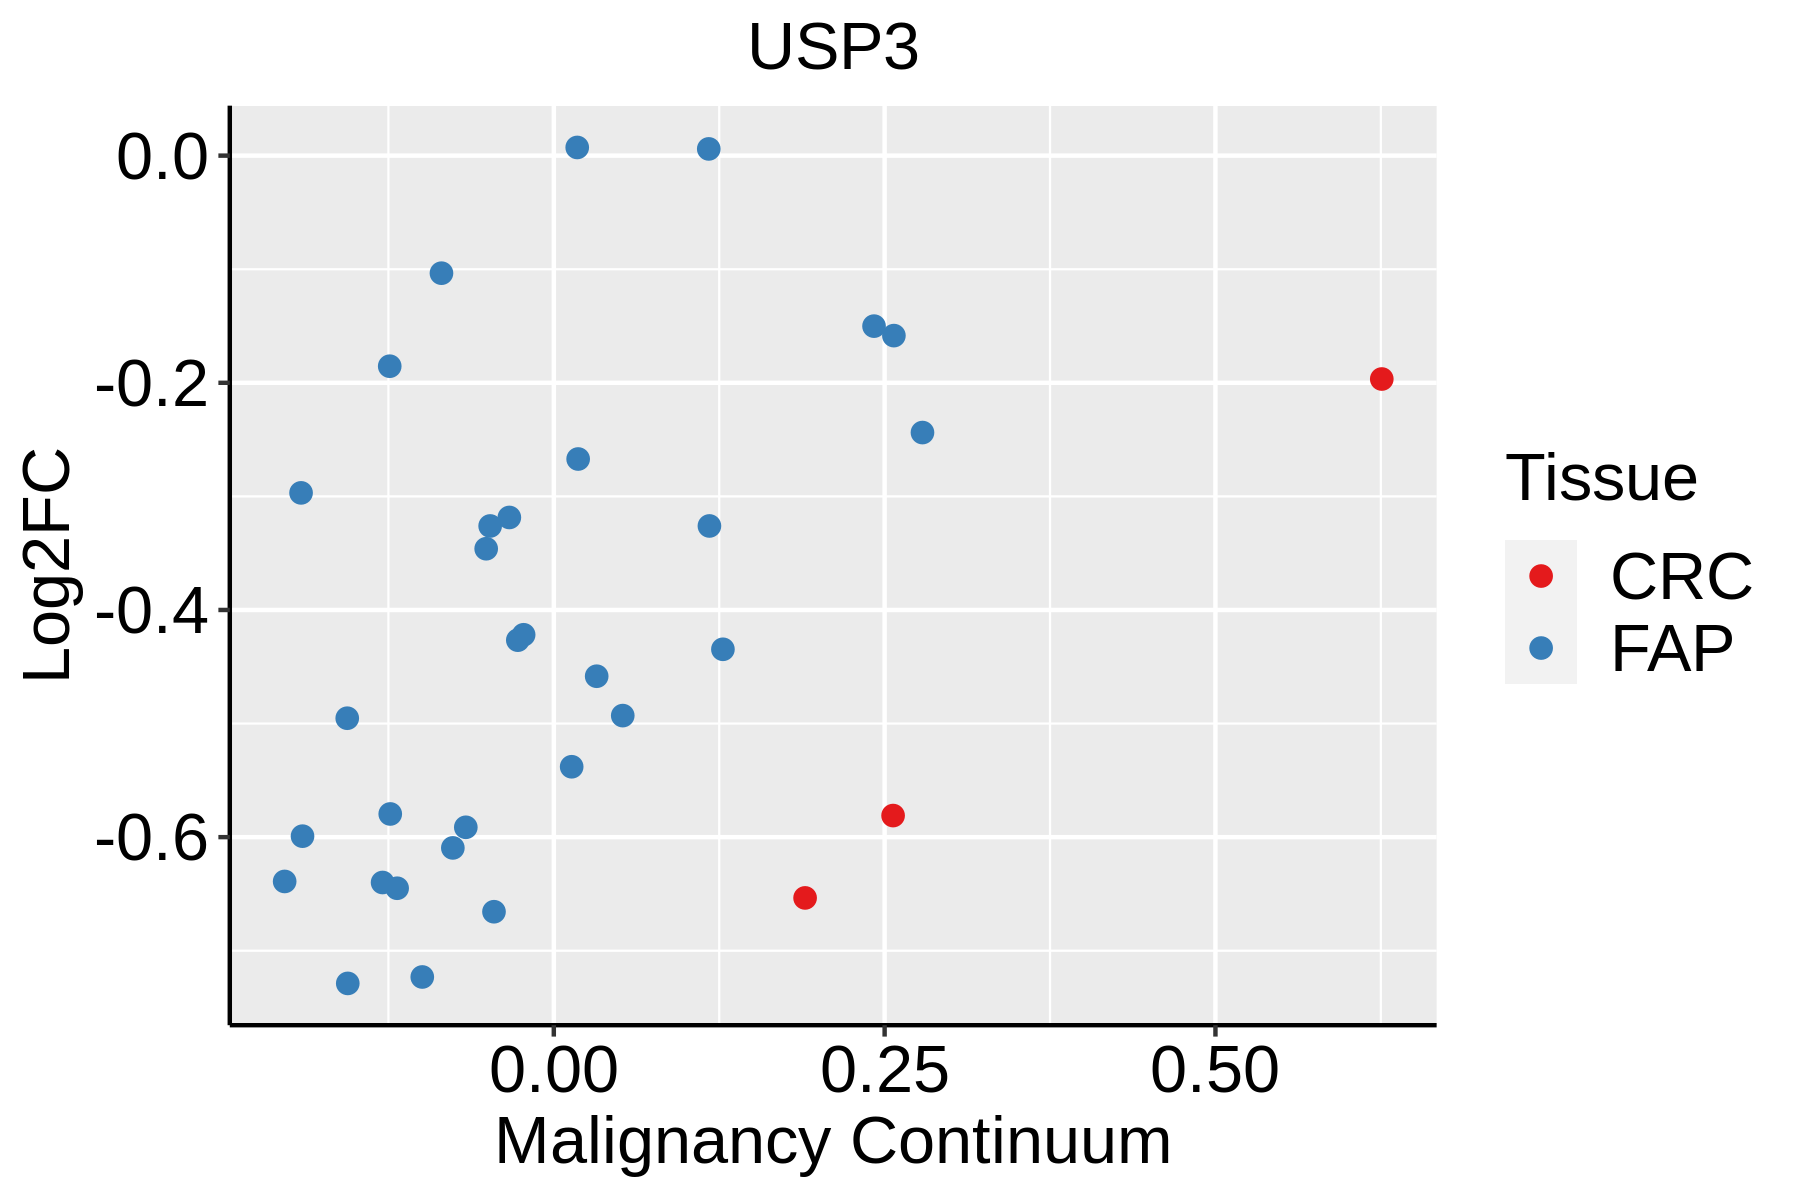 | FAP: Familial adenomatous polyposis |
| CRC: Colorectal cancer | ||
| Colorectum (HTA11) | 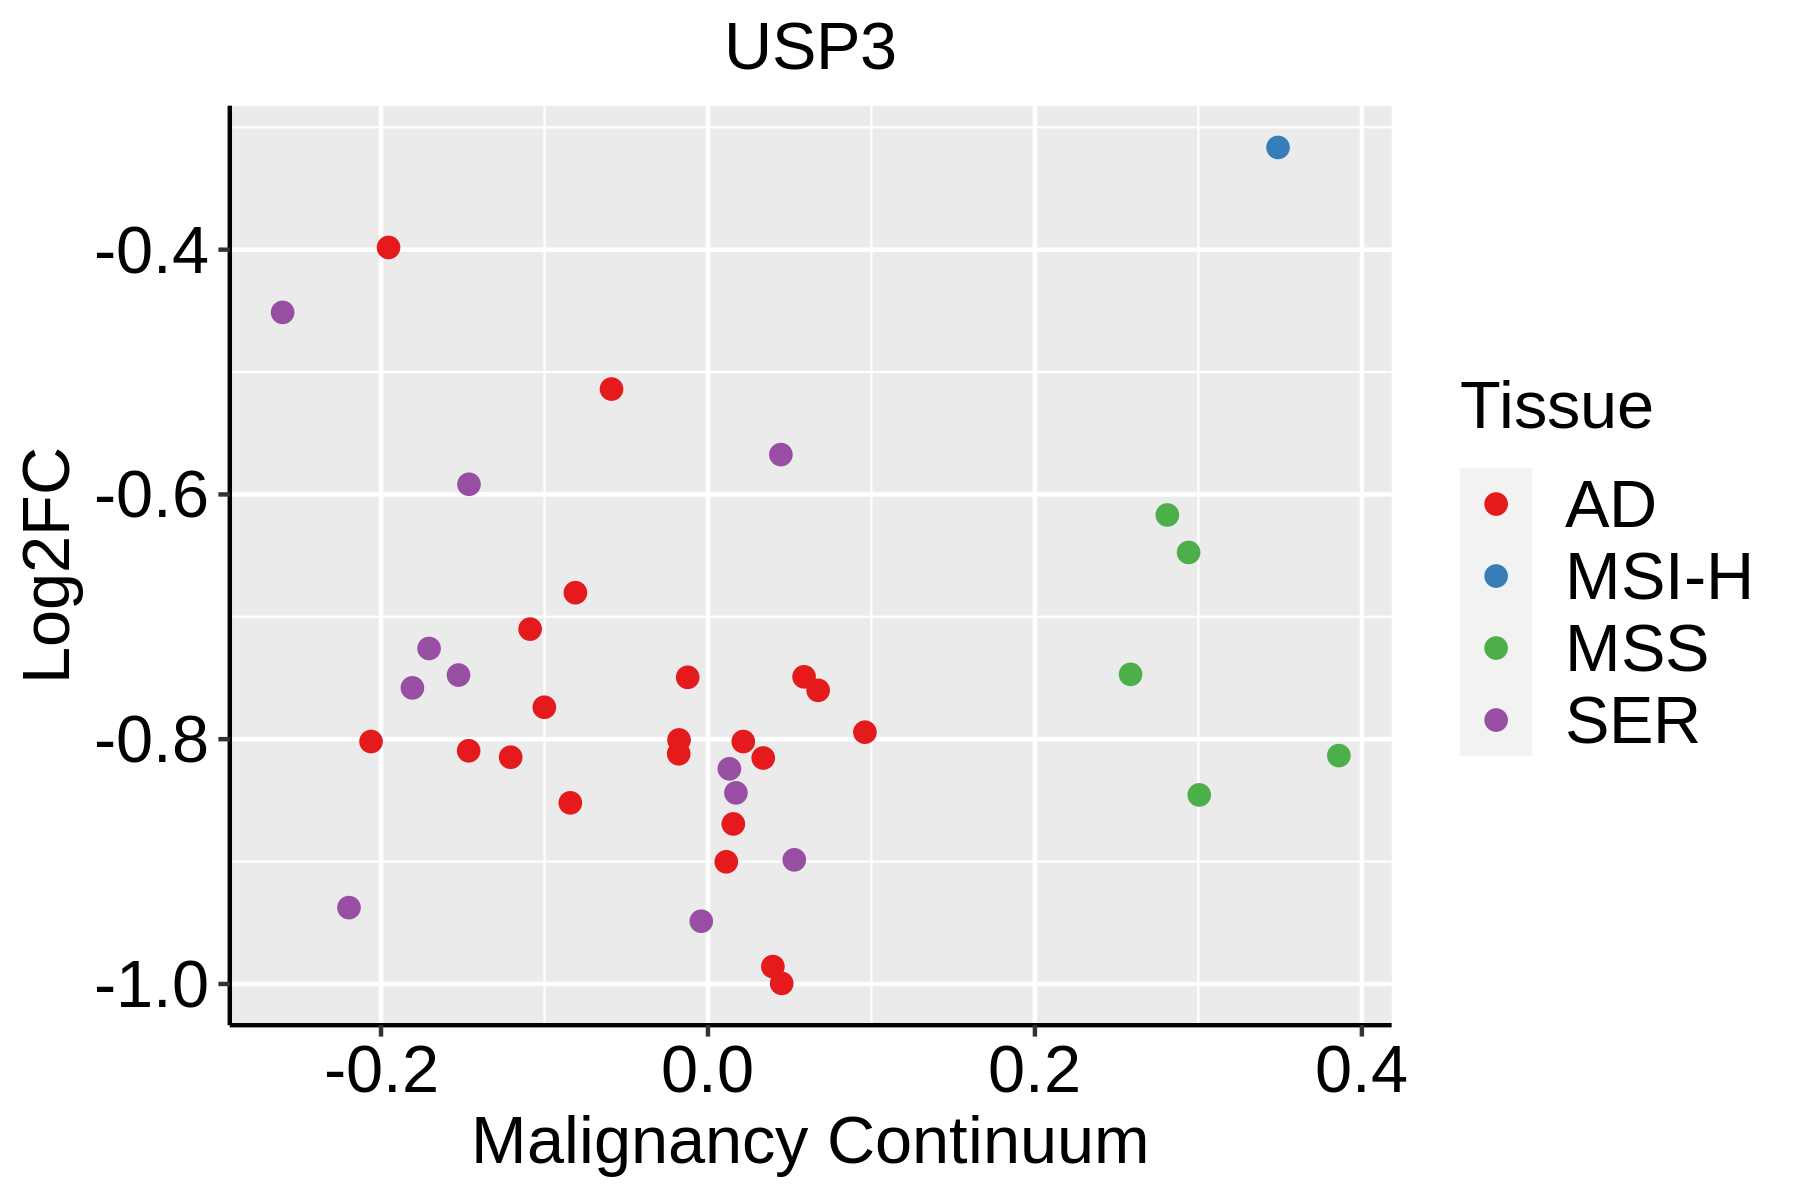 | AD: Adenomas |
| SER: Sessile serrated lesions | ||
| MSI-H: Microsatellite-high colorectal cancer | ||
| MSS: Microsatellite stable colorectal cancer | ||
| Esophagus | 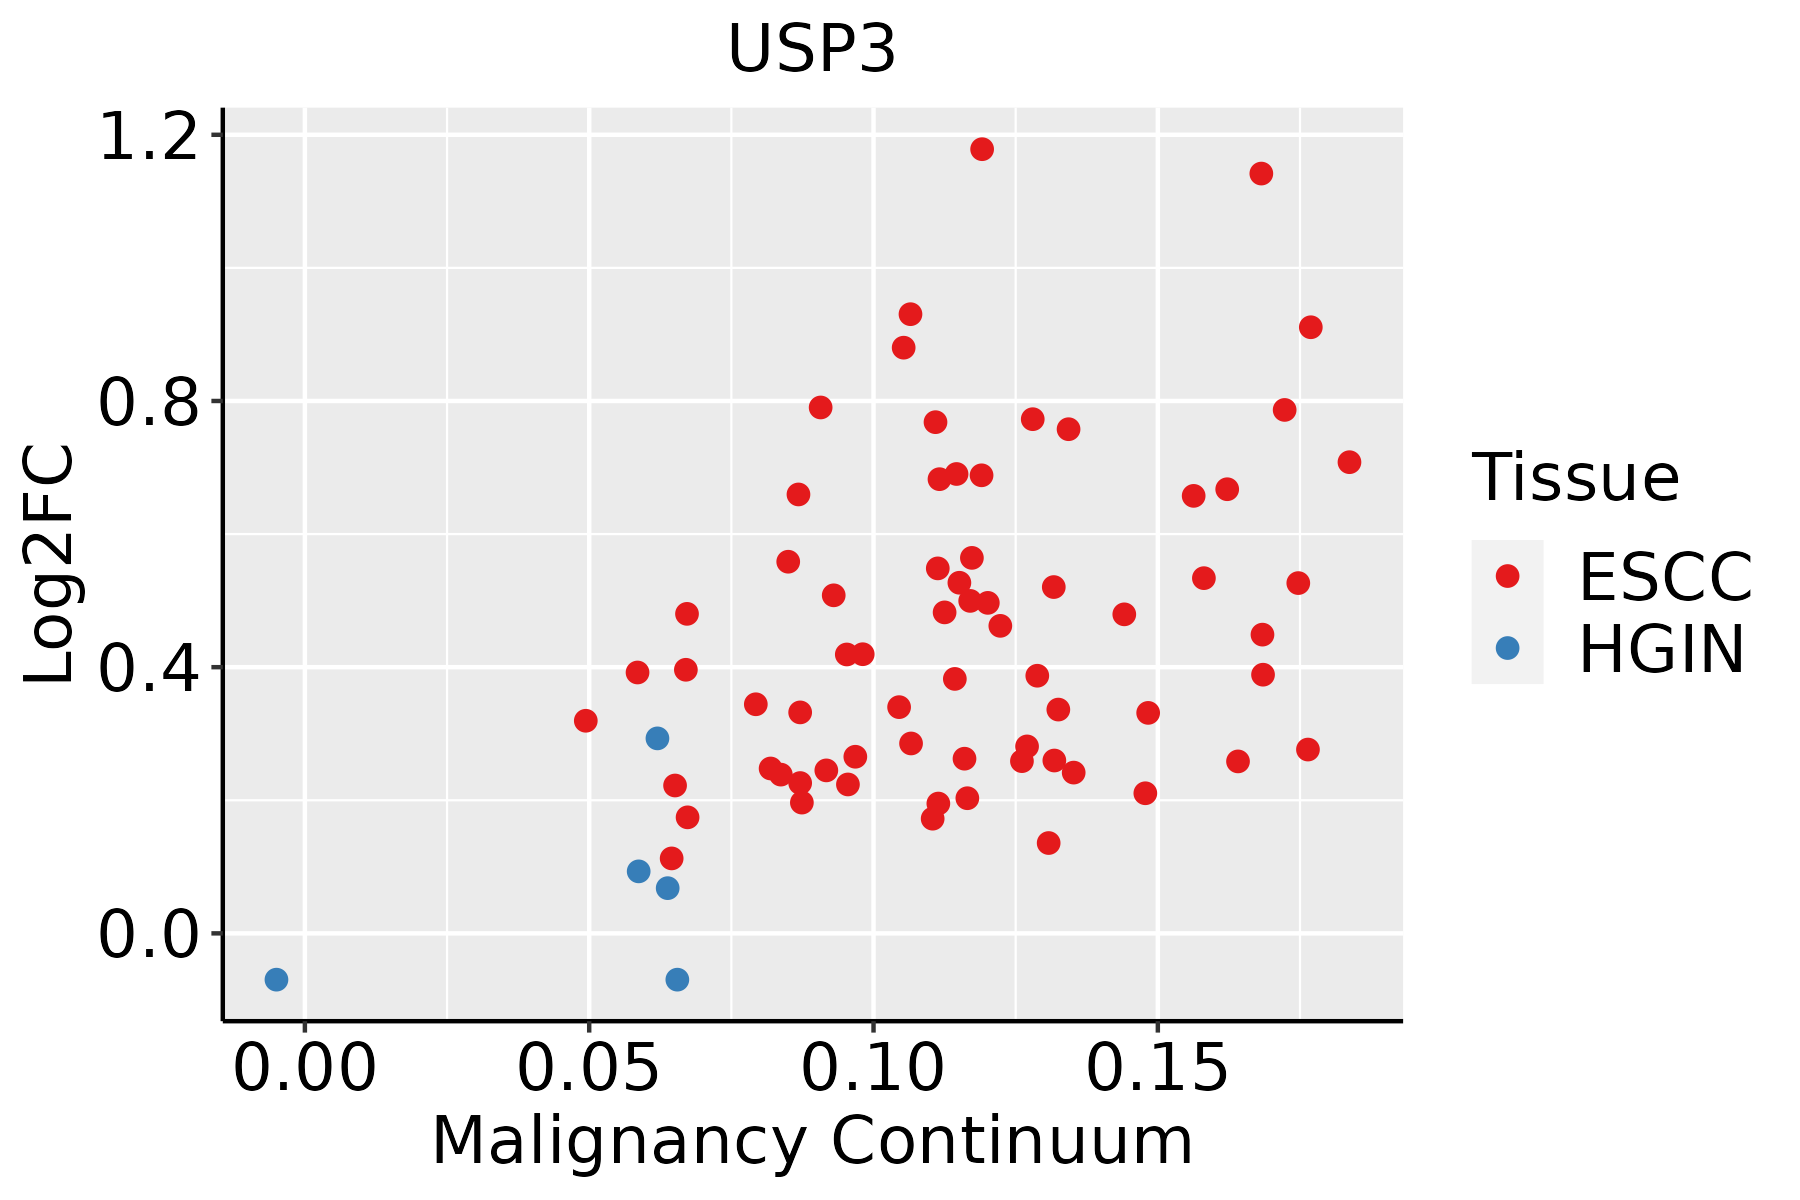 | ESCC: Esophageal squamous cell carcinoma |
| HGIN: High-grade intraepithelial neoplasias | ||
| LGIN: Low-grade intraepithelial neoplasias | ||
| Liver | 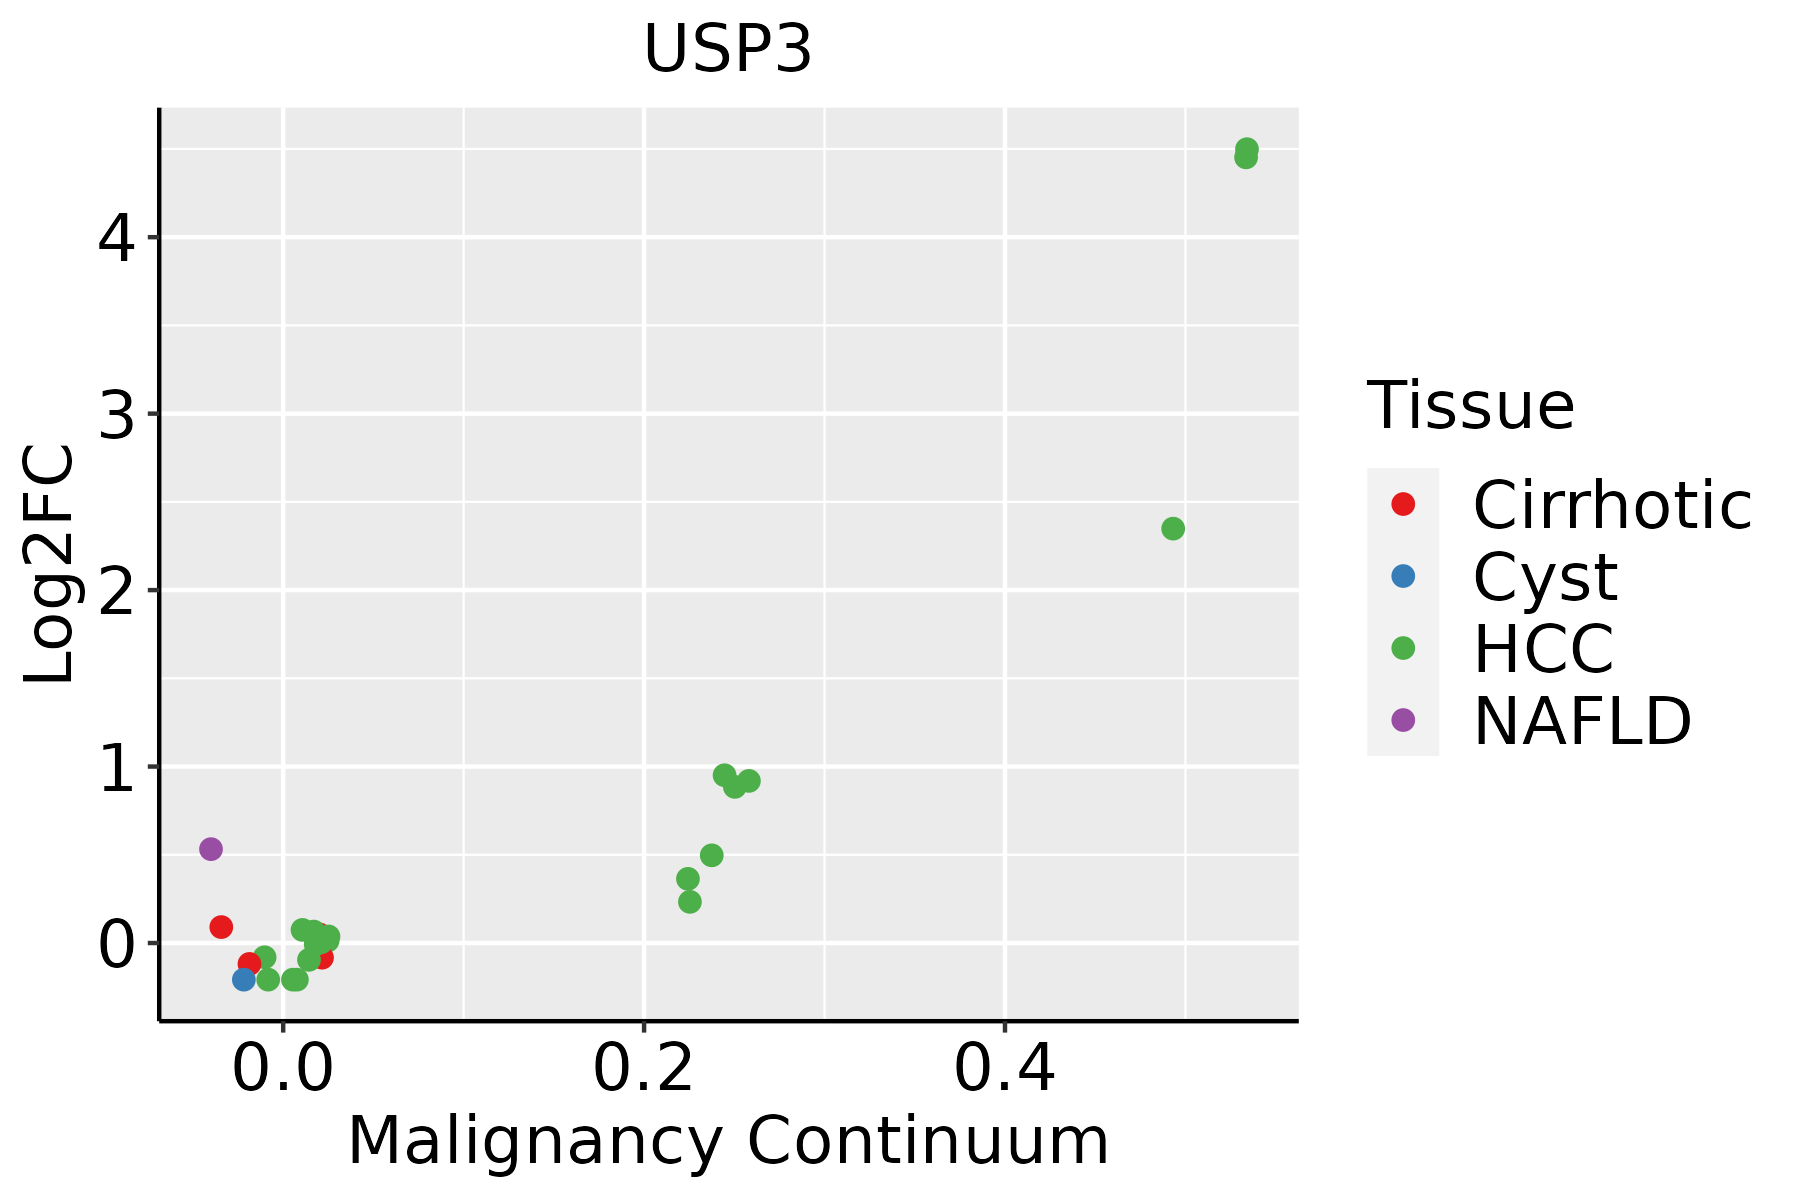 | HCC: Hepatocellular carcinoma |
| NAFLD: Non-alcoholic fatty liver disease | ||
| Lung |  | AAH: Atypical adenomatous hyperplasia |
| AIS: Adenocarcinoma in situ | ||
| IAC: Invasive lung adenocarcinoma | ||
| MIA: Minimally invasive adenocarcinoma | ||
| Oral Cavity |  | EOLP: Erosive Oral lichen planus |
| LP: leukoplakia | ||
| NEOLP: Non-erosive oral lichen planus | ||
| OSCC: Oral squamous cell carcinoma | ||
| Prostate |  | BPH: Benign Prostatic Hyperplasia |
| Thyroid | 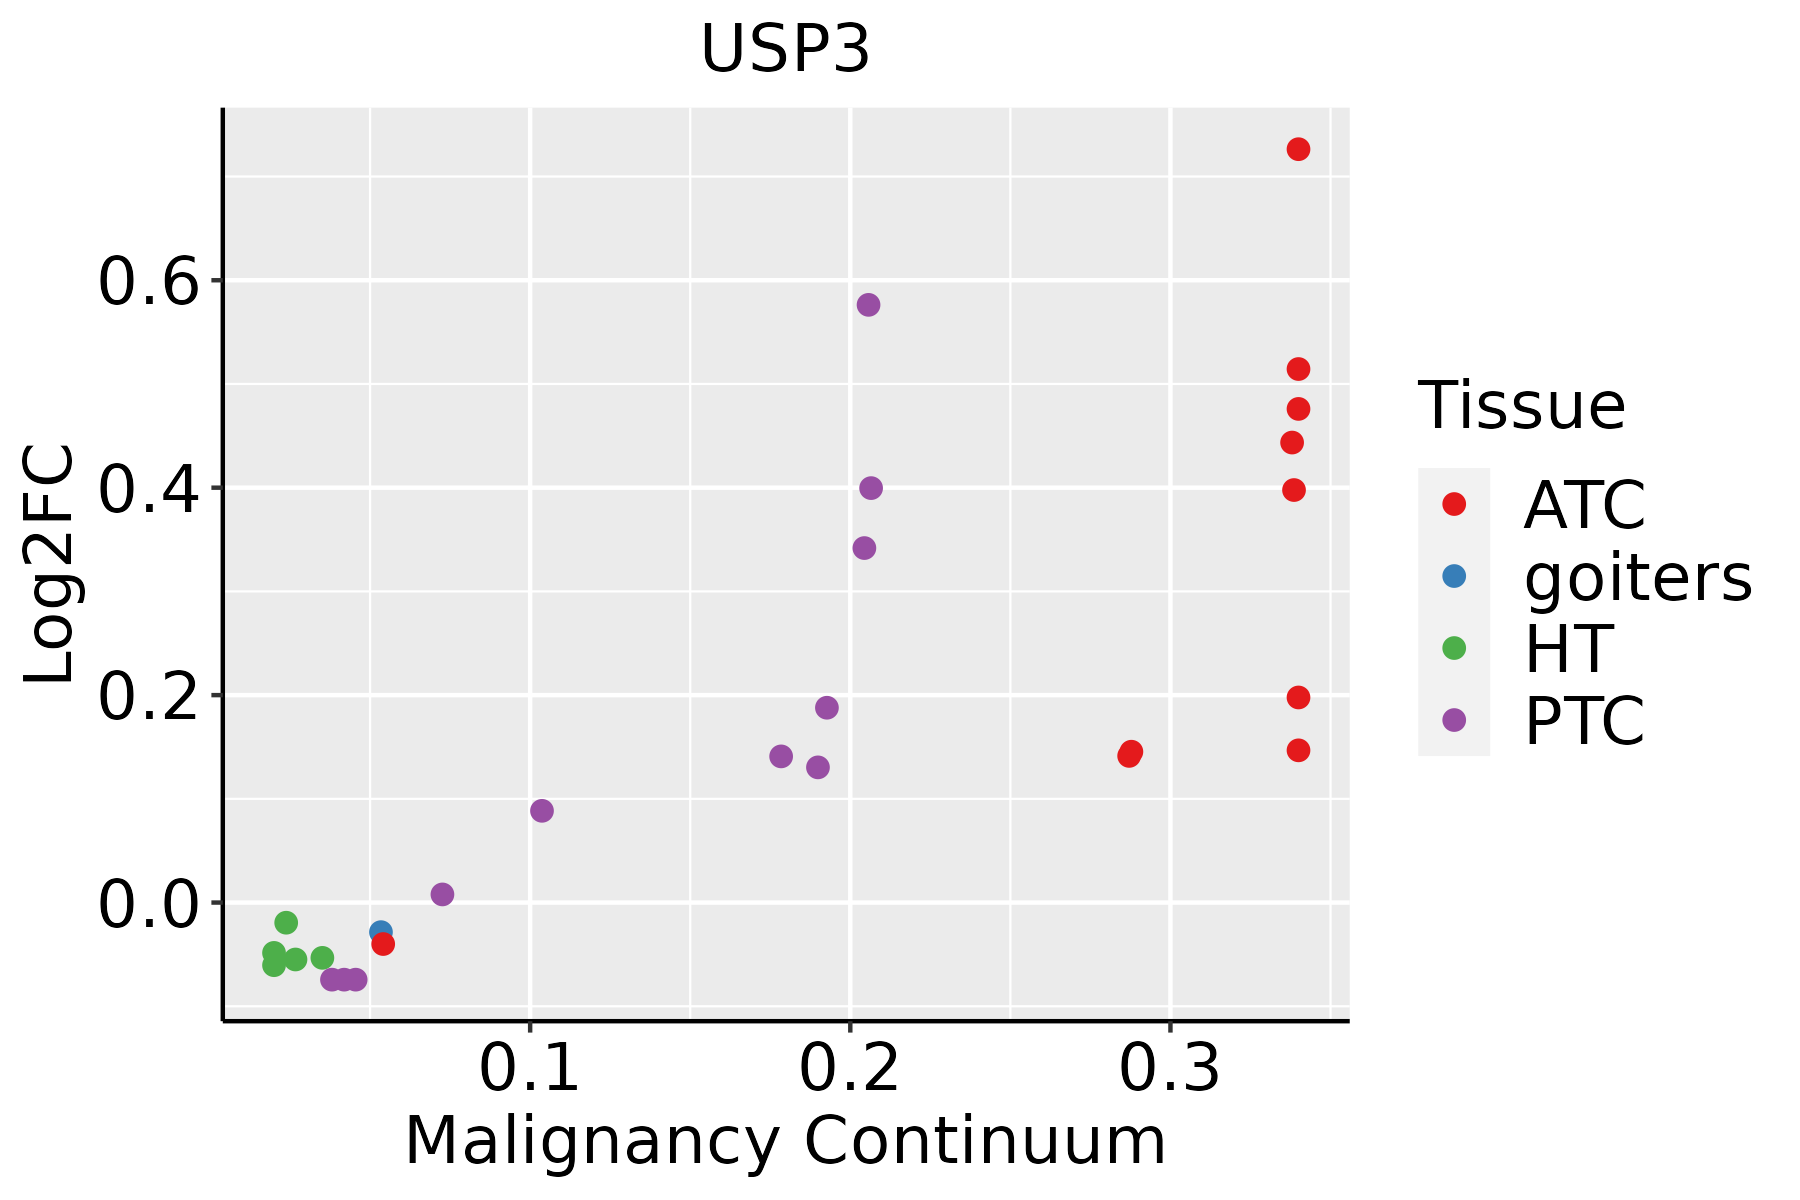 | ATC: Anaplastic thyroid cancer |
| HT: Hashimoto's thyroiditis | ||
| PTC: Papillary thyroid cancer |
| ∗log2FC in expression of this searched gene in stem-like cells from each diseased tissue sample relative to stem-like cells in normal samples in each tissue plotted against the malignancy continuum. Samples are colored based on if they are from different disease stage. |
Top |
Malignant transformation related pathway analysis |
| Find out the enriched GO biological processes and KEGG pathways involved in transition from healthy to precancer to cancer |
| Tissue | Disease Stage | Enriched GO biological Processes |
| Colorectum | AD |  |
| Colorectum | SER |  |
| Colorectum | MSS |  |
| Colorectum | MSI-H |  |
| Colorectum | FAP |  |
| ∗Top 15 enriched GO BP terms are showed in the bar plot of each disease state in each tissue. Each row represents a significant GO biological process which is colored according to the -log10(p.adjust). |
| Page: 1 2 3 4 5 6 7 8 9 |
| GO ID | Tissue | Disease Stage | Description | Gene Ratio | Bg Ratio | pvalue | p.adjust | Count |
| GO:007149610 | Cervix | CC | cellular response to external stimulus | 78/2311 | 320/18723 | 1.82e-09 | 1.98e-07 | 78 |
| GO:00160557 | Cervix | CC | Wnt signaling pathway | 98/2311 | 444/18723 | 4.82e-09 | 4.65e-07 | 98 |
| GO:01987387 | Cervix | CC | cell-cell signaling by wnt | 98/2311 | 446/18723 | 6.16e-09 | 5.58e-07 | 98 |
| GO:00301117 | Cervix | CC | regulation of Wnt signaling pathway | 76/2311 | 328/18723 | 3.05e-08 | 2.08e-06 | 76 |
| GO:005109810 | Cervix | CC | regulation of binding | 80/2311 | 363/18723 | 1.32e-07 | 6.42e-06 | 80 |
| GO:00447725 | Cervix | CC | mitotic cell cycle phase transition | 89/2311 | 424/18723 | 2.70e-07 | 1.12e-05 | 89 |
| GO:00316689 | Cervix | CC | cellular response to extracellular stimulus | 59/2311 | 246/18723 | 3.03e-07 | 1.24e-05 | 59 |
| GO:00608287 | Cervix | CC | regulation of canonical Wnt signaling pathway | 58/2311 | 253/18723 | 1.83e-06 | 5.89e-05 | 58 |
| GO:00600707 | Cervix | CC | canonical Wnt signaling pathway | 66/2311 | 303/18723 | 2.47e-06 | 7.35e-05 | 66 |
| GO:003166710 | Cervix | CC | response to nutrient levels | 92/2311 | 474/18723 | 5.80e-06 | 1.42e-04 | 92 |
| GO:00092678 | Cervix | CC | cellular response to starvation | 39/2311 | 156/18723 | 1.04e-05 | 2.32e-04 | 39 |
| GO:005109910 | Cervix | CC | positive regulation of binding | 42/2311 | 173/18723 | 1.07e-05 | 2.33e-04 | 42 |
| GO:003164710 | Cervix | CC | regulation of protein stability | 63/2311 | 298/18723 | 1.14e-05 | 2.45e-04 | 63 |
| GO:00000824 | Cervix | CC | G1/S transition of mitotic cell cycle | 49/2311 | 214/18723 | 1.16e-05 | 2.48e-04 | 49 |
| GO:00425948 | Cervix | CC | response to starvation | 46/2311 | 197/18723 | 1.24e-05 | 2.59e-04 | 46 |
| GO:00316698 | Cervix | CC | cellular response to nutrient levels | 49/2311 | 215/18723 | 1.32e-05 | 2.68e-04 | 49 |
| GO:00615647 | Cervix | CC | axon development | 89/2311 | 467/18723 | 1.71e-05 | 3.27e-04 | 89 |
| GO:00448434 | Cervix | CC | cell cycle G1/S phase transition | 53/2311 | 241/18723 | 1.76e-05 | 3.32e-04 | 53 |
| GO:005082110 | Cervix | CC | protein stabilization | 43/2311 | 191/18723 | 5.90e-05 | 8.54e-04 | 43 |
| GO:00074097 | Cervix | CC | axonogenesis | 78/2311 | 418/18723 | 1.14e-04 | 1.43e-03 | 78 |
| Page: 1 2 3 4 5 6 7 8 9 10 11 12 13 14 15 16 17 18 19 20 21 22 23 24 25 26 27 28 29 30 31 32 33 34 35 36 37 38 39 40 41 42 43 44 45 46 47 48 49 50 51 52 53 |
| Pathway ID | Tissue | Disease Stage | Description | Gene Ratio | Bg Ratio | pvalue | p.adjust | qvalue | Count |
| Page: 1 |
Top |
Cell-cell communication analysis |
| Identification of potential cell-cell interactions between two cell types and their ligand-receptor pairs for different disease states |
| Ligand | Receptor | LRpair | Pathway | Tissue | Disease Stage |
| Page: 1 |
Top |
Single-cell gene regulatory network inference analysis |
| Find out the significant the regulons (TFs) and the target genes of each regulon across cell types for different disease states |
| TF | Cell Type | Tissue | Disease Stage | Target Gene | RSS | Regulon Activity |
| ∗The dot plots of a searched regulon are shown for all cell subpopulations in each disease state of each tissue based on the regulon specific score inferred using pySCENIC and by calculating the average expression. |
| Page: 1 |
Top |
Somatic mutation of malignant transformation related genes |
| Annotation of somatic variants for genes involved in malignant transformation |
| Hugo Symbol | Variant Class | Variant Classification | dbSNP RS | HGVSc | HGVSp | HGVSp Short | SWISSPROT | BIOTYPE | SIFT | PolyPhen | Tumor Sample Barcode | Tissue | Histology | Sex | Age | Stage | Therapy Types | Drugs | Outcome |
| USP3 | insertion | In_Frame_Ins | novel | c.1363_1364insGCTTGACTGCTAAGACCATGTCTATAACTTTAC | p.Asp455delinsGlyLeuThrAlaLysThrMetSerIleThrLeuHis | p.D455delinsGLTAKTMSITLH | Q9Y6I4 | protein_coding | TCGA-A2-A0CP-01 | Breast | breast invasive carcinoma | Female | <65 | I/II | Chemotherapy | cytoxan | SD | ||
| USP3 | SNV | Missense_Mutation | rs771942475 | c.1426N>A | p.Ala476Thr | p.A476T | Q9Y6I4 | protein_coding | deleterious(0) | probably_damaging(0.956) | TCGA-2W-A8YY-01 | Cervix | cervical & endocervical cancer | Female | <65 | I/II | Chemotherapy | cisplatin | CR |
| USP3 | SNV | Missense_Mutation | novel | c.944N>C | p.Gly315Ala | p.G315A | Q9Y6I4 | protein_coding | deleterious(0.02) | probably_damaging(0.984) | TCGA-DS-A1OB-01 | Cervix | cervical & endocervical cancer | Female | <65 | I/II | Chemotherapy | carboplatin | PD |
| USP3 | SNV | Missense_Mutation | novel | c.814N>A | p.Leu272Ile | p.L272I | Q9Y6I4 | protein_coding | deleterious(0.01) | benign(0.442) | TCGA-A6-2672-01 | Colorectum | colon adenocarcinoma | Female | >=65 | III/IV | Unknown | Unknown | SD |
| USP3 | SNV | Missense_Mutation | novel | c.893N>A | p.Ser298Asn | p.S298N | Q9Y6I4 | protein_coding | tolerated(0.48) | benign(0.079) | TCGA-A6-5661-01 | Colorectum | colon adenocarcinoma | Female | >=65 | I/II | Unknown | Unknown | SD |
| USP3 | SNV | Missense_Mutation | c.1146N>C | p.Leu382Phe | p.L382F | Q9Y6I4 | protein_coding | deleterious(0.03) | possibly_damaging(0.723) | TCGA-AA-3681-01 | Colorectum | colon adenocarcinoma | Female | >=65 | III/IV | Unknown | Unknown | SD | |
| USP3 | SNV | Missense_Mutation | c.1148N>T | p.Tyr383Phe | p.Y383F | Q9Y6I4 | protein_coding | deleterious(0) | probably_damaging(0.998) | TCGA-AA-3681-01 | Colorectum | colon adenocarcinoma | Female | >=65 | III/IV | Unknown | Unknown | SD | |
| USP3 | SNV | Missense_Mutation | c.781N>A | p.Ala261Thr | p.A261T | Q9Y6I4 | protein_coding | deleterious(0) | probably_damaging(0.922) | TCGA-AA-3811-01 | Colorectum | colon adenocarcinoma | Female | >=65 | III/IV | Unknown | Unknown | PD | |
| USP3 | SNV | Missense_Mutation | c.931A>G | p.Thr311Ala | p.T311A | Q9Y6I4 | protein_coding | deleterious(0.05) | probably_damaging(0.914) | TCGA-AA-3815-01 | Colorectum | colon adenocarcinoma | Female | >=65 | I/II | Unknown | Unknown | SD | |
| USP3 | SNV | Missense_Mutation | c.781N>A | p.Ala261Thr | p.A261T | Q9Y6I4 | protein_coding | deleterious(0) | probably_damaging(0.922) | TCGA-AA-3949-01 | Colorectum | colon adenocarcinoma | Female | >=65 | III/IV | Unknown | Unknown | SD |
| Page: 1 2 3 4 5 6 7 |
Top |
Related drugs of malignant transformation related genes |
| Identification of chemicals and drugs interact with genes involved in malignant transfromation |
| (DGIdb 4.0) |
| Entrez ID | Symbol | Category | Interaction Types | Drug Claim Name | Drug Name | PMIDs |
| Page: 1 |

Copyright 2023-Present -The University of Texas Health Science Center at Houston |