
|
|||||
|
 | |
| |
| |
| |
| |
| |
|
Gene: USP28 |
Gene summary for USP28 |
| Gene information | Species | Human | Gene symbol | USP28 | Gene ID | 57646 |
| Gene name | ubiquitin specific peptidase 28 | |
| Gene Alias | USP28 | |
| Cytomap | 11q23.2 | |
| Gene Type | protein-coding | GO ID | GO:0000075 | UniProtAcc | B4E3L3 |
Top |
Malignant transformation analysis |
| Identification of the aberrant gene expression in precancerous and cancerous lesions by comparing the gene expression of stem-like cells in diseased tissues with normal stem cells |
| Entrez ID | Symbol | Replicates | Species | Organ | Tissue | Adj P-value | Log2FC | Malignancy |
| 57646 | USP28 | LZE4T | Human | Esophagus | ESCC | 1.30e-07 | 1.62e-01 | 0.0811 |
| 57646 | USP28 | LZE24T | Human | Esophagus | ESCC | 1.08e-08 | 2.92e-01 | 0.0596 |
| 57646 | USP28 | LZE21T | Human | Esophagus | ESCC | 1.27e-02 | 2.71e-01 | 0.0655 |
| 57646 | USP28 | P1T-E | Human | Esophagus | ESCC | 3.86e-02 | 2.27e-01 | 0.0875 |
| 57646 | USP28 | P2T-E | Human | Esophagus | ESCC | 1.99e-11 | 1.71e-01 | 0.1177 |
| 57646 | USP28 | P4T-E | Human | Esophagus | ESCC | 3.66e-21 | 4.25e-01 | 0.1323 |
| 57646 | USP28 | P5T-E | Human | Esophagus | ESCC | 2.85e-07 | 9.56e-02 | 0.1327 |
| 57646 | USP28 | P8T-E | Human | Esophagus | ESCC | 7.60e-06 | 1.24e-01 | 0.0889 |
| 57646 | USP28 | P9T-E | Human | Esophagus | ESCC | 1.37e-10 | 2.09e-01 | 0.1131 |
| 57646 | USP28 | P10T-E | Human | Esophagus | ESCC | 4.57e-12 | 2.16e-01 | 0.116 |
| 57646 | USP28 | P11T-E | Human | Esophagus | ESCC | 2.74e-03 | 3.51e-01 | 0.1426 |
| 57646 | USP28 | P12T-E | Human | Esophagus | ESCC | 2.21e-21 | 4.82e-01 | 0.1122 |
| 57646 | USP28 | P15T-E | Human | Esophagus | ESCC | 7.39e-15 | 2.12e-01 | 0.1149 |
| 57646 | USP28 | P16T-E | Human | Esophagus | ESCC | 2.71e-20 | 3.47e-01 | 0.1153 |
| 57646 | USP28 | P20T-E | Human | Esophagus | ESCC | 5.42e-10 | 1.21e-01 | 0.1124 |
| 57646 | USP28 | P21T-E | Human | Esophagus | ESCC | 2.63e-20 | 4.09e-01 | 0.1617 |
| 57646 | USP28 | P22T-E | Human | Esophagus | ESCC | 2.59e-11 | 1.23e-01 | 0.1236 |
| 57646 | USP28 | P23T-E | Human | Esophagus | ESCC | 2.16e-13 | 2.93e-01 | 0.108 |
| 57646 | USP28 | P24T-E | Human | Esophagus | ESCC | 3.48e-06 | 1.22e-01 | 0.1287 |
| 57646 | USP28 | P26T-E | Human | Esophagus | ESCC | 1.35e-17 | 3.30e-01 | 0.1276 |
| Page: 1 2 3 |
| Tissue | Expression Dynamics | Abbreviation |
| Esophagus | 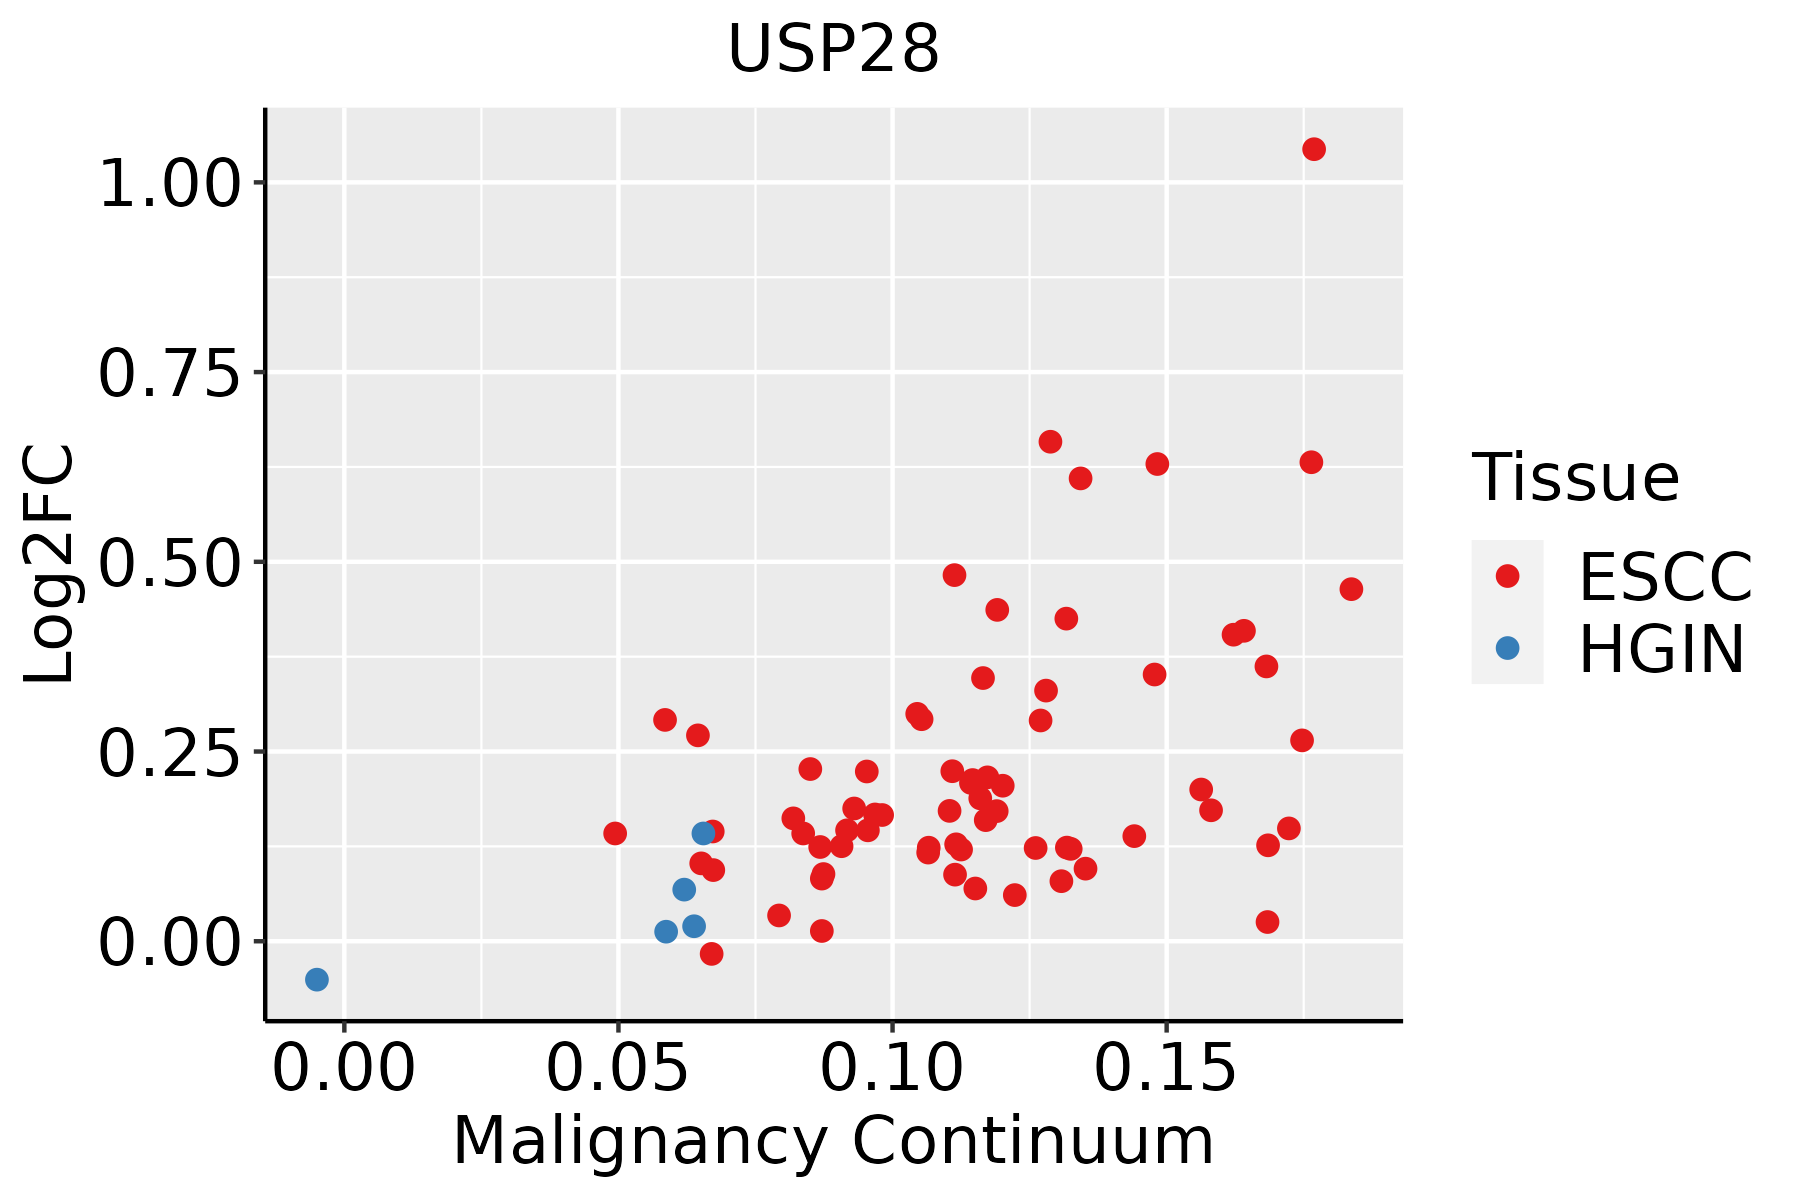 | ESCC: Esophageal squamous cell carcinoma |
| HGIN: High-grade intraepithelial neoplasias | ||
| LGIN: Low-grade intraepithelial neoplasias |
| ∗log2FC in expression of this searched gene in stem-like cells from each diseased tissue sample relative to stem-like cells in normal samples in each tissue plotted against the malignancy continuum. Samples are colored based on if they are from different disease stage. |
Top |
Malignant transformation related pathway analysis |
| Find out the enriched GO biological processes and KEGG pathways involved in transition from healthy to precancer to cancer |
| Tissue | Disease Stage | Enriched GO biological Processes |
| Colorectum | AD |  |
| Colorectum | SER |  |
| Colorectum | MSS |  |
| Colorectum | MSI-H |  |
| Colorectum | FAP |  |
| ∗Top 15 enriched GO BP terms are showed in the bar plot of each disease state in each tissue. Each row represents a significant GO biological process which is colored according to the -log10(p.adjust). |
| Page: 1 2 3 4 5 6 7 8 9 |
| GO ID | Tissue | Disease Stage | Description | Gene Ratio | Bg Ratio | pvalue | p.adjust | Count |
| GO:0097193111 | Esophagus | ESCC | intrinsic apoptotic signaling pathway | 222/8552 | 288/18723 | 5.87e-28 | 2.02e-25 | 222 |
| GO:0031647111 | Esophagus | ESCC | regulation of protein stability | 223/8552 | 298/18723 | 5.76e-25 | 1.52e-22 | 223 |
| GO:000941113 | Esophagus | ESCC | response to UV | 115/8552 | 149/18723 | 3.29e-15 | 1.93e-13 | 115 |
| GO:0072331111 | Esophagus | ESCC | signal transduction by p53 class mediator | 121/8552 | 163/18723 | 9.61e-14 | 4.69e-12 | 121 |
| GO:001021217 | Esophagus | ESCC | response to ionizing radiation | 110/8552 | 148/18723 | 1.11e-12 | 4.78e-11 | 110 |
| GO:0008630110 | Esophagus | ESCC | intrinsic apoptotic signaling pathway in response to DNA damage | 78/8552 | 99/18723 | 1.43e-11 | 5.08e-10 | 78 |
| GO:190198713 | Esophagus | ESCC | regulation of cell cycle phase transition | 242/8552 | 390/18723 | 3.86e-11 | 1.26e-09 | 242 |
| GO:000931419 | Esophagus | ESCC | response to radiation | 277/8552 | 456/18723 | 4.42e-11 | 1.43e-09 | 277 |
| GO:00457865 | Esophagus | ESCC | negative regulation of cell cycle | 236/8552 | 385/18723 | 3.62e-10 | 9.93e-09 | 236 |
| GO:00000754 | Esophagus | ESCC | cell cycle checkpoint | 117/8552 | 169/18723 | 4.47e-10 | 1.17e-08 | 117 |
| GO:003464413 | Esophagus | ESCC | cellular response to UV | 70/8552 | 90/18723 | 4.59e-10 | 1.20e-08 | 70 |
| GO:007121419 | Esophagus | ESCC | cellular response to abiotic stimulus | 206/8552 | 331/18723 | 7.52e-10 | 1.88e-08 | 206 |
| GO:010400419 | Esophagus | ESCC | cellular response to environmental stimulus | 206/8552 | 331/18723 | 7.52e-10 | 1.88e-08 | 206 |
| GO:004277014 | Esophagus | ESCC | signal transduction in response to DNA damage | 117/8552 | 172/18723 | 2.38e-09 | 5.32e-08 | 117 |
| GO:0042771110 | Esophagus | ESCC | intrinsic apoptotic signaling pathway in response to DNA damage by p53 class mediator | 38/8552 | 43/18723 | 5.75e-09 | 1.18e-07 | 38 |
| GO:0072332111 | Esophagus | ESCC | intrinsic apoptotic signaling pathway by p53 class mediator | 59/8552 | 76/18723 | 1.22e-08 | 2.42e-07 | 59 |
| GO:007147816 | Esophagus | ESCC | cellular response to radiation | 122/8552 | 186/18723 | 3.07e-08 | 5.73e-07 | 122 |
| GO:000726510 | Esophagus | ESCC | Ras protein signal transduction | 201/8552 | 337/18723 | 1.44e-07 | 2.30e-06 | 201 |
| GO:00109484 | Esophagus | ESCC | negative regulation of cell cycle process | 177/8552 | 294/18723 | 3.26e-07 | 4.59e-06 | 177 |
| GO:00315705 | Esophagus | ESCC | DNA integrity checkpoint | 83/8552 | 123/18723 | 8.17e-07 | 1.06e-05 | 83 |
| Page: 1 2 |
| Pathway ID | Tissue | Disease Stage | Description | Gene Ratio | Bg Ratio | pvalue | p.adjust | qvalue | Count |
| Page: 1 |
Top |
Cell-cell communication analysis |
| Identification of potential cell-cell interactions between two cell types and their ligand-receptor pairs for different disease states |
| Ligand | Receptor | LRpair | Pathway | Tissue | Disease Stage |
| Page: 1 |
Top |
Single-cell gene regulatory network inference analysis |
| Find out the significant the regulons (TFs) and the target genes of each regulon across cell types for different disease states |
| TF | Cell Type | Tissue | Disease Stage | Target Gene | RSS | Regulon Activity |
| ∗The dot plots of a searched regulon are shown for all cell subpopulations in each disease state of each tissue based on the regulon specific score inferred using pySCENIC and by calculating the average expression. |
| Page: 1 |
Top |
Somatic mutation of malignant transformation related genes |
| Annotation of somatic variants for genes involved in malignant transformation |
| Hugo Symbol | Variant Class | Variant Classification | dbSNP RS | HGVSc | HGVSp | HGVSp Short | SWISSPROT | BIOTYPE | SIFT | PolyPhen | Tumor Sample Barcode | Tissue | Histology | Sex | Age | Stage | Therapy Types | Drugs | Outcome |
| USP28 | SNV | Missense_Mutation | c.2953N>G | p.Pro985Ala | p.P985A | Q96RU2 | protein_coding | deleterious(0) | probably_damaging(0.983) | TCGA-5L-AAT1-01 | Breast | breast invasive carcinoma | Female | <65 | III/IV | Hormone Therapy | letrozol | SD | |
| USP28 | SNV | Missense_Mutation | c.763G>C | p.Asp255His | p.D255H | Q96RU2 | protein_coding | deleterious(0) | probably_damaging(0.987) | TCGA-AC-A23H-01 | Breast | breast invasive carcinoma | Female | >=65 | I/II | Unknown | Unknown | PD | |
| USP28 | SNV | Missense_Mutation | novel | c.2304N>T | p.Glu768Asp | p.E768D | Q96RU2 | protein_coding | deleterious(0.02) | benign(0.034) | TCGA-AN-A0AK-01 | Breast | breast invasive carcinoma | Female | >=65 | I/II | Unknown | Unknown | SD |
| USP28 | SNV | Missense_Mutation | novel | c.743N>T | p.Ser248Leu | p.S248L | Q96RU2 | protein_coding | deleterious(0) | possibly_damaging(0.879) | TCGA-AR-A2LE-01 | Breast | breast invasive carcinoma | Female | >=65 | I/II | Hormone Therapy | tamoxiphen | PD |
| USP28 | SNV | Missense_Mutation | rs757612167 | c.2533N>G | p.Thr845Ala | p.T845A | Q96RU2 | protein_coding | deleterious(0.05) | possibly_damaging(0.816) | TCGA-BH-A18G-01 | Breast | breast invasive carcinoma | Female | >=65 | I/II | Unknown | Unknown | SD |
| USP28 | SNV | Missense_Mutation | c.1743G>T | p.Gln581His | p.Q581H | Q96RU2 | protein_coding | deleterious(0) | probably_damaging(0.989) | TCGA-C8-A8HQ-01 | Breast | breast invasive carcinoma | Female | <65 | I/II | Unknown | Unknown | SD | |
| USP28 | SNV | Missense_Mutation | rs749927512 | c.704N>T | p.Pro235Leu | p.P235L | Q96RU2 | protein_coding | deleterious(0) | probably_damaging(0.999) | TCGA-E9-A244-01 | Breast | breast invasive carcinoma | Female | <65 | I/II | Chemotherapy | cyclophosphamide | SD |
| USP28 | SNV | Missense_Mutation | novel | c.3008T>C | p.Ile1003Thr | p.I1003T | Q96RU2 | protein_coding | deleterious(0.01) | possibly_damaging(0.468) | TCGA-EW-A6SB-01 | Breast | breast invasive carcinoma | Female | <65 | I/II | Unknown | Unknown | SD |
| USP28 | insertion | Frame_Shift_Ins | novel | c.2310_2311insAGACCCTGTCTCCAAAAAATAAAAAAAAAGT | p.Leu771ArgfsTer24 | p.L771Rfs*24 | Q96RU2 | protein_coding | TCGA-A2-A0D1-01 | Breast | breast invasive carcinoma | Female | >=65 | I/II | Chemotherapy | taxotere | SD | ||
| USP28 | SNV | Missense_Mutation | rs768157200 | c.940N>A | p.Gly314Ser | p.G314S | Q96RU2 | protein_coding | deleterious(0.02) | probably_damaging(0.98) | TCGA-2W-A8YY-01 | Cervix | cervical & endocervical cancer | Female | <65 | I/II | Chemotherapy | cisplatin | CR |
| Page: 1 2 3 4 5 6 7 8 9 10 11 12 13 14 |
Top |
Related drugs of malignant transformation related genes |
| Identification of chemicals and drugs interact with genes involved in malignant transfromation |
| (DGIdb 4.0) |
| Entrez ID | Symbol | Category | Interaction Types | Drug Claim Name | Drug Name | PMIDs |
| Page: 1 |

Copyright 2023-Present -The University of Texas Health Science Center at Houston |