
|
|||||
|
 | |
| |
| |
| |
| |
| |
|
Gene: USP25 |
Gene summary for USP25 |
| Gene information | Species | Human | Gene symbol | USP25 | Gene ID | 29761 |
| Gene name | ubiquitin specific peptidase 25 | |
| Gene Alias | USP21 | |
| Cytomap | 21q21.1 | |
| Gene Type | protein-coding | GO ID | GO:0006464 | UniProtAcc | Q9UHP3 |
Top |
Malignant transformation analysis |
| Identification of the aberrant gene expression in precancerous and cancerous lesions by comparing the gene expression of stem-like cells in diseased tissues with normal stem cells |
| Entrez ID | Symbol | Replicates | Species | Organ | Tissue | Adj P-value | Log2FC | Malignancy |
| 29761 | USP25 | CCI_1 | Human | Cervix | CC | 3.76e-04 | 6.88e-01 | 0.528 |
| 29761 | USP25 | CCI_2 | Human | Cervix | CC | 3.11e-09 | 1.25e+00 | 0.5249 |
| 29761 | USP25 | CCI_3 | Human | Cervix | CC | 2.61e-11 | 9.84e-01 | 0.516 |
| 29761 | USP25 | HTA11_3410_2000001011 | Human | Colorectum | AD | 8.98e-27 | -7.80e-01 | 0.0155 |
| 29761 | USP25 | HTA11_2487_2000001011 | Human | Colorectum | SER | 5.94e-11 | -6.48e-01 | -0.1808 |
| 29761 | USP25 | HTA11_2951_2000001011 | Human | Colorectum | AD | 6.36e-05 | -8.56e-01 | 0.0216 |
| 29761 | USP25 | HTA11_1938_2000001011 | Human | Colorectum | AD | 4.47e-02 | -4.72e-01 | -0.0811 |
| 29761 | USP25 | HTA11_3361_2000001011 | Human | Colorectum | AD | 2.00e-11 | -7.55e-01 | -0.1207 |
| 29761 | USP25 | HTA11_83_2000001011 | Human | Colorectum | SER | 3.99e-06 | -5.76e-01 | -0.1526 |
| 29761 | USP25 | HTA11_696_2000001011 | Human | Colorectum | AD | 1.33e-20 | -5.72e-01 | -0.1464 |
| 29761 | USP25 | HTA11_866_2000001011 | Human | Colorectum | AD | 4.18e-15 | -4.91e-01 | -0.1001 |
| 29761 | USP25 | HTA11_1391_2000001011 | Human | Colorectum | AD | 1.18e-13 | -6.03e-01 | -0.059 |
| 29761 | USP25 | HTA11_5212_2000001011 | Human | Colorectum | AD | 6.70e-04 | -7.08e-01 | -0.2061 |
| 29761 | USP25 | HTA11_546_2000001011 | Human | Colorectum | AD | 2.22e-04 | -6.05e-01 | -0.0842 |
| 29761 | USP25 | HTA11_7862_2000001011 | Human | Colorectum | AD | 6.37e-04 | -6.71e-01 | -0.0179 |
| 29761 | USP25 | HTA11_866_3004761011 | Human | Colorectum | AD | 8.09e-12 | -5.83e-01 | 0.096 |
| 29761 | USP25 | HTA11_9408_2000001011 | Human | Colorectum | AD | 4.81e-03 | -8.41e-01 | 0.0451 |
| 29761 | USP25 | HTA11_8622_2000001021 | Human | Colorectum | SER | 1.96e-02 | -6.36e-01 | 0.0528 |
| 29761 | USP25 | HTA11_10623_2000001011 | Human | Colorectum | AD | 3.50e-02 | -5.19e-01 | -0.0177 |
| 29761 | USP25 | HTA11_10711_2000001011 | Human | Colorectum | AD | 3.07e-05 | -5.36e-01 | 0.0338 |
| Page: 1 2 3 4 5 |
| Tissue | Expression Dynamics | Abbreviation |
| Cervix |  | CC: Cervix cancer |
| HSIL_HPV: HPV-infected high-grade squamous intraepithelial lesions | ||
| N_HPV: HPV-infected normal cervix | ||
| Colorectum (GSE201348) |  | FAP: Familial adenomatous polyposis |
| CRC: Colorectal cancer | ||
| Colorectum (HTA11) |  | AD: Adenomas |
| SER: Sessile serrated lesions | ||
| MSI-H: Microsatellite-high colorectal cancer | ||
| MSS: Microsatellite stable colorectal cancer | ||
| Endometrium | 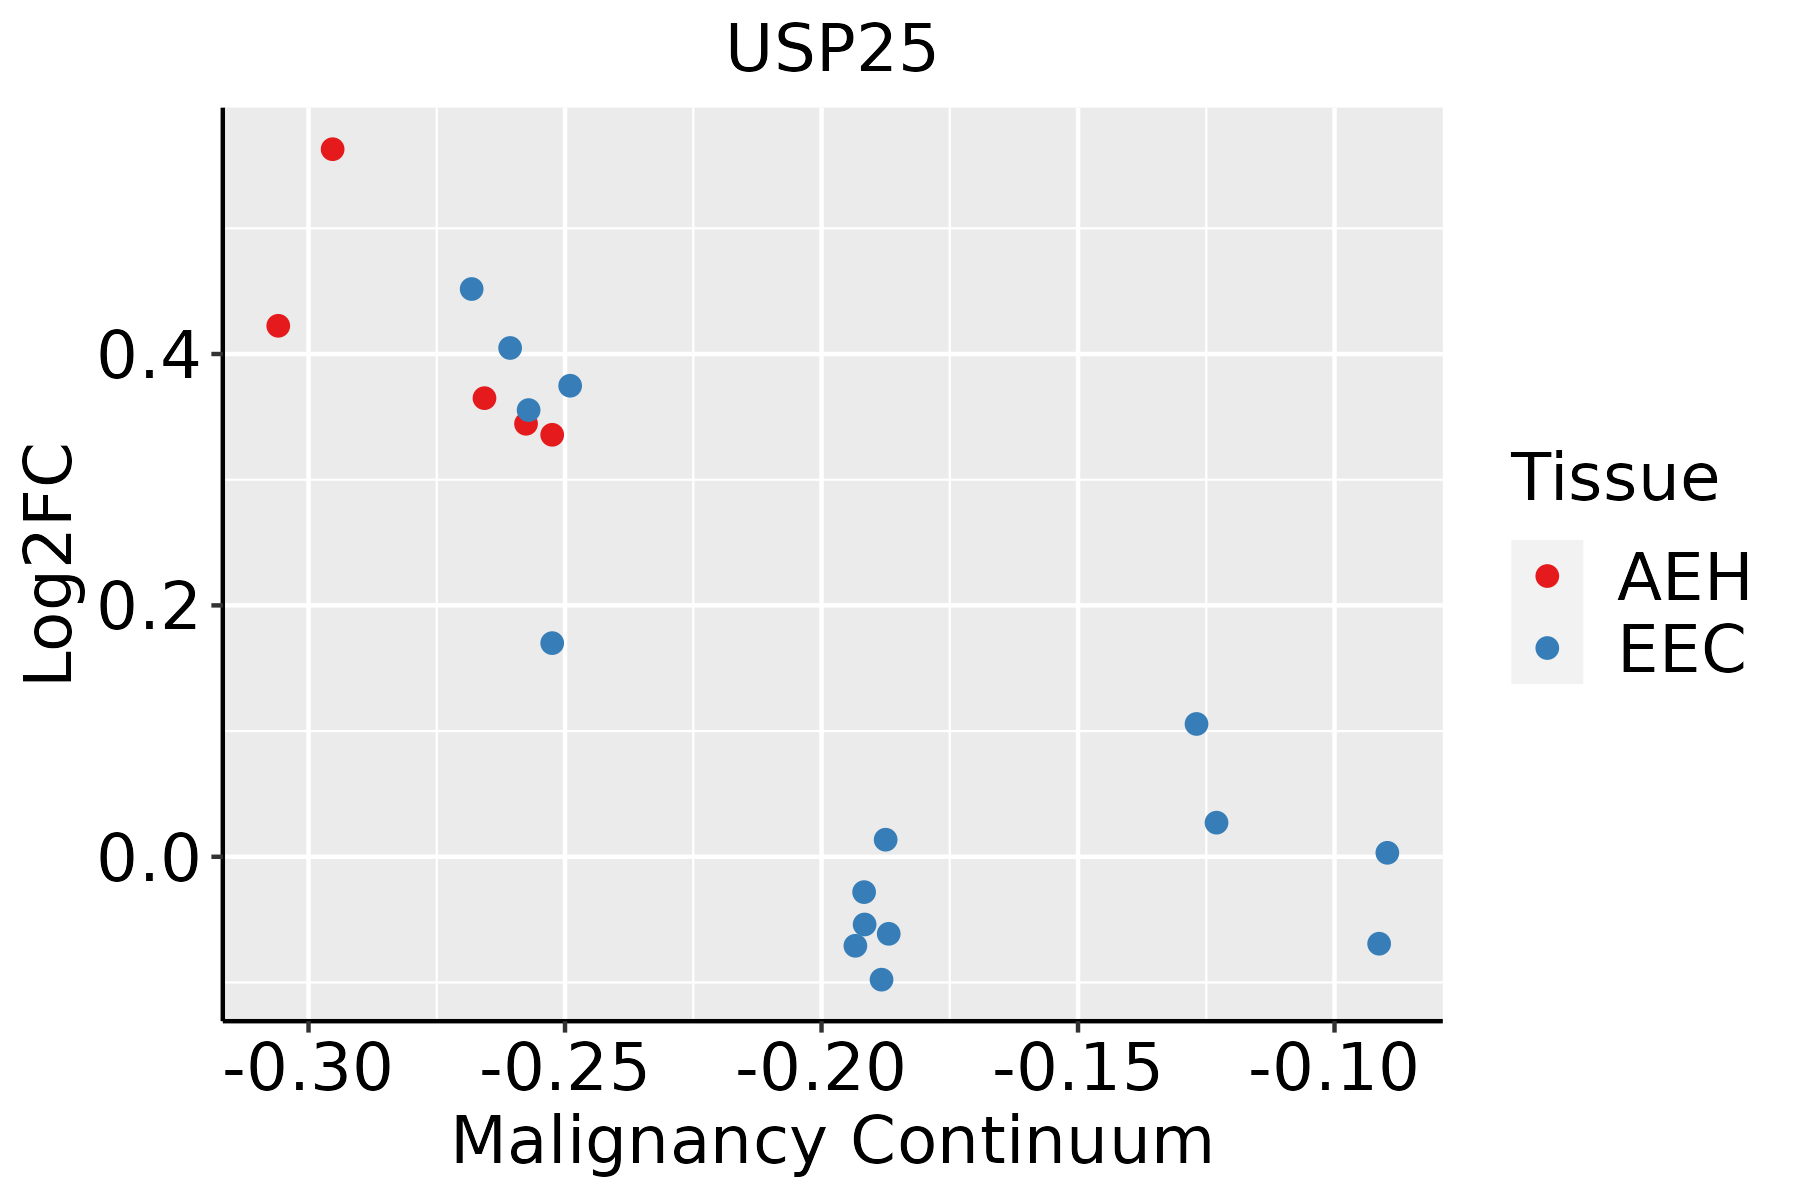 | AEH: Atypical endometrial hyperplasia |
| EEC: Endometrioid Cancer | ||
| Liver | 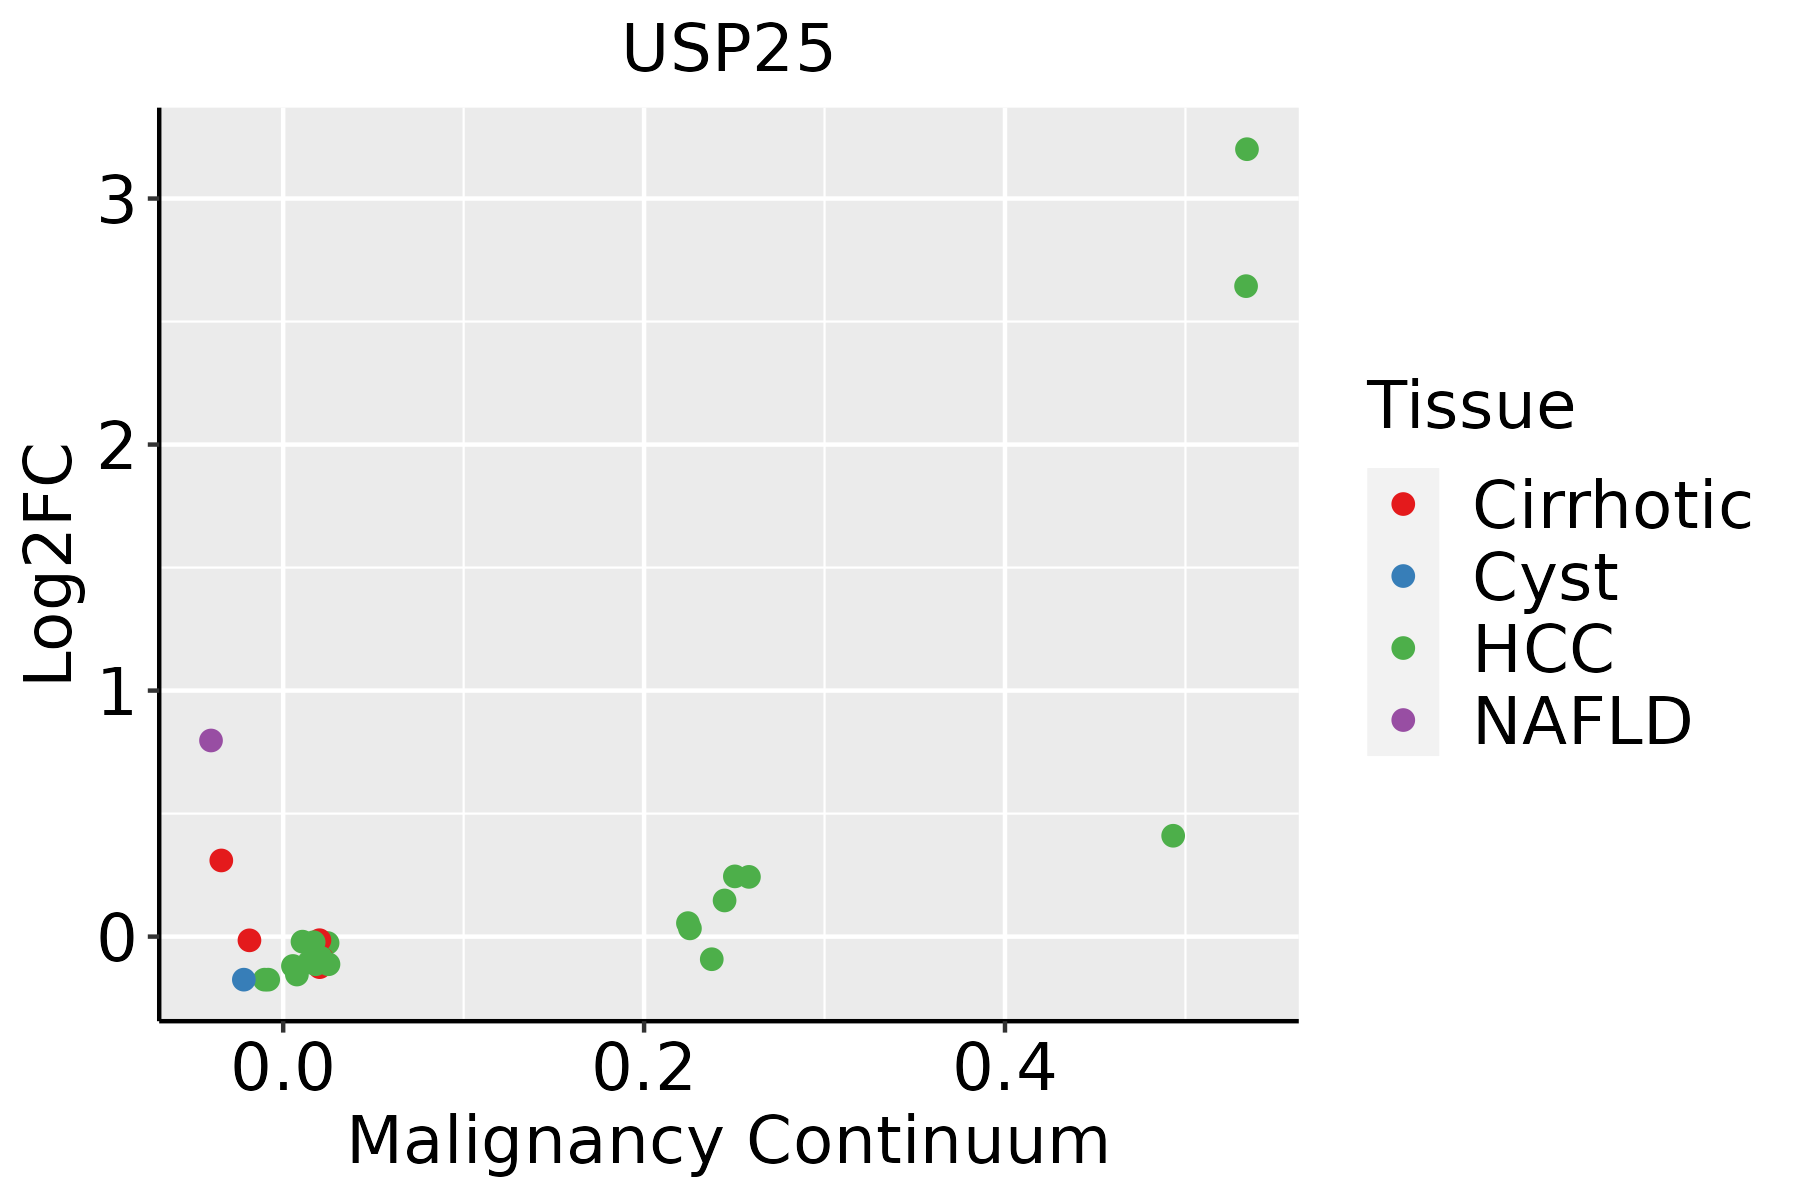 | HCC: Hepatocellular carcinoma |
| NAFLD: Non-alcoholic fatty liver disease | ||
| Lung | 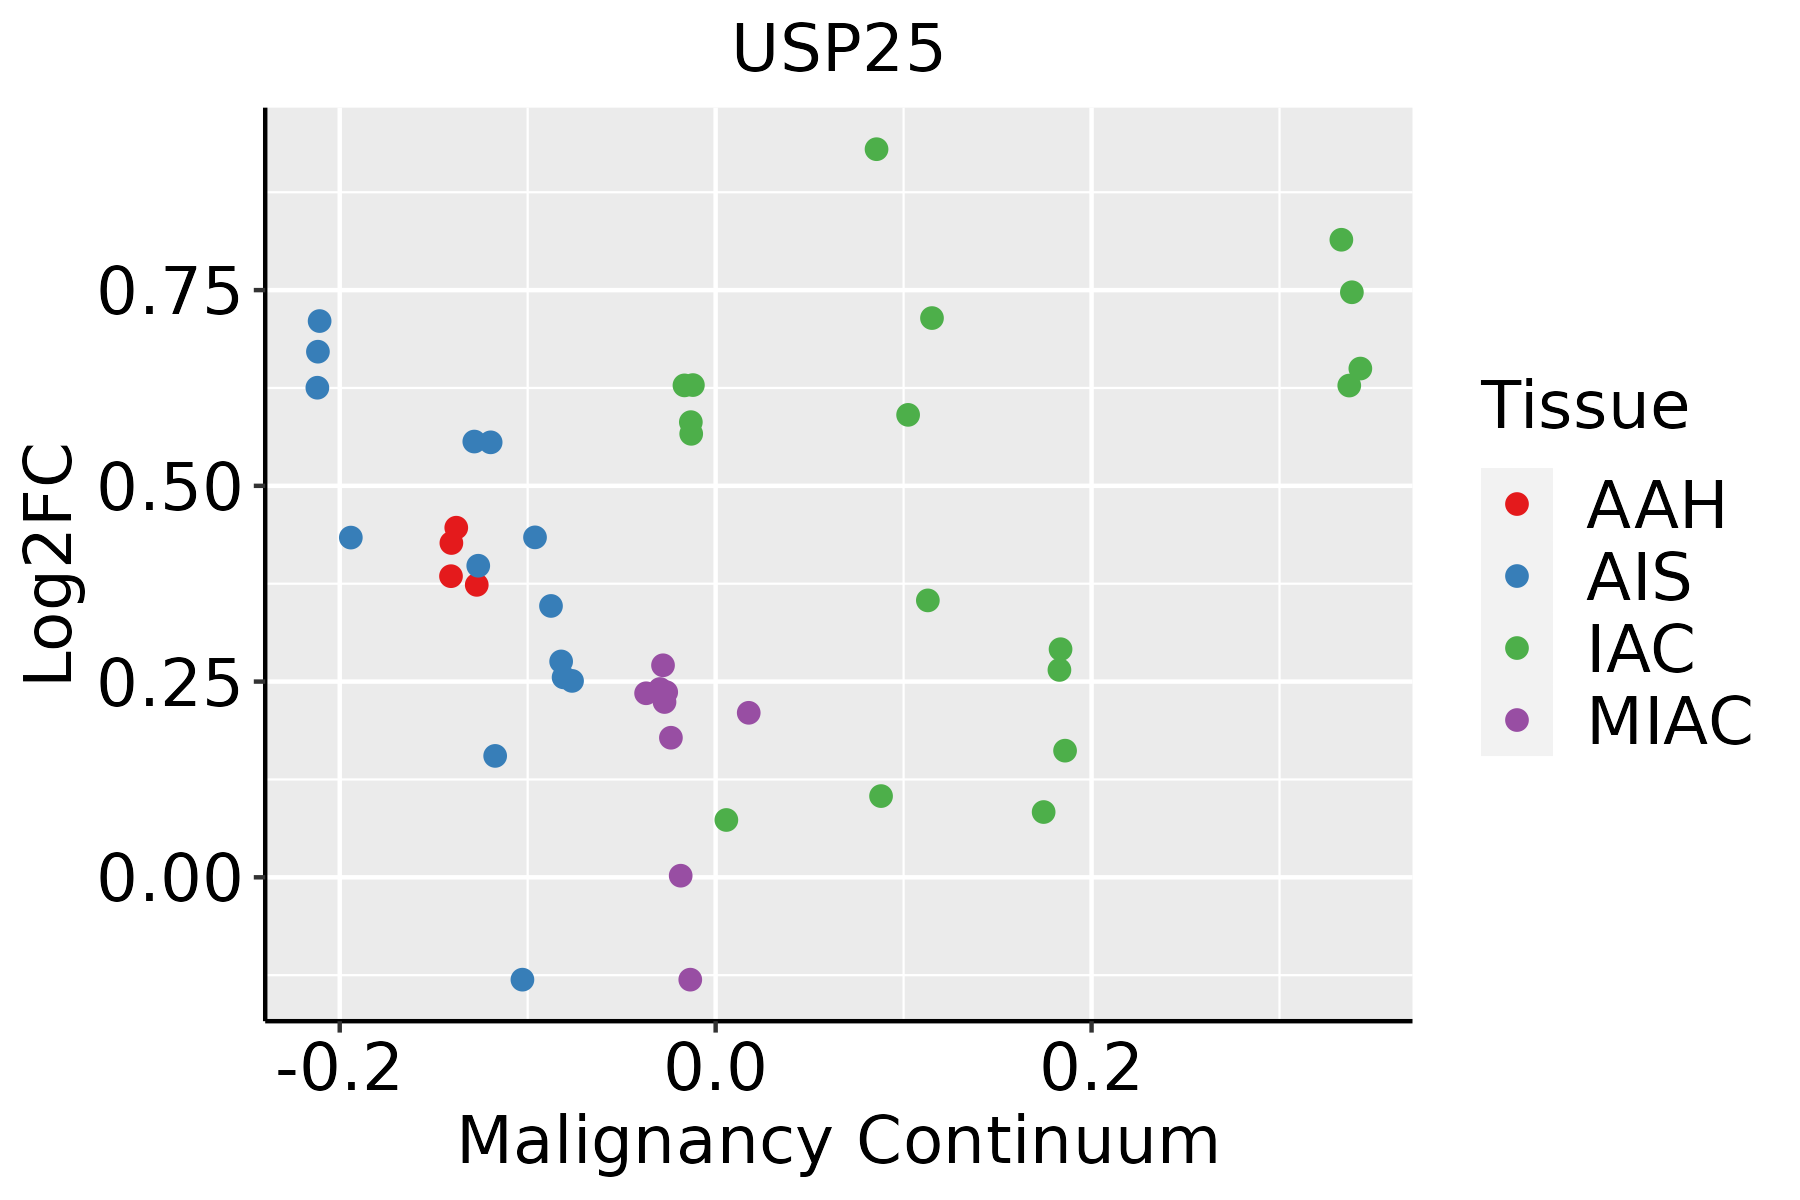 | AAH: Atypical adenomatous hyperplasia |
| AIS: Adenocarcinoma in situ | ||
| IAC: Invasive lung adenocarcinoma | ||
| MIA: Minimally invasive adenocarcinoma | ||
| Prostate | 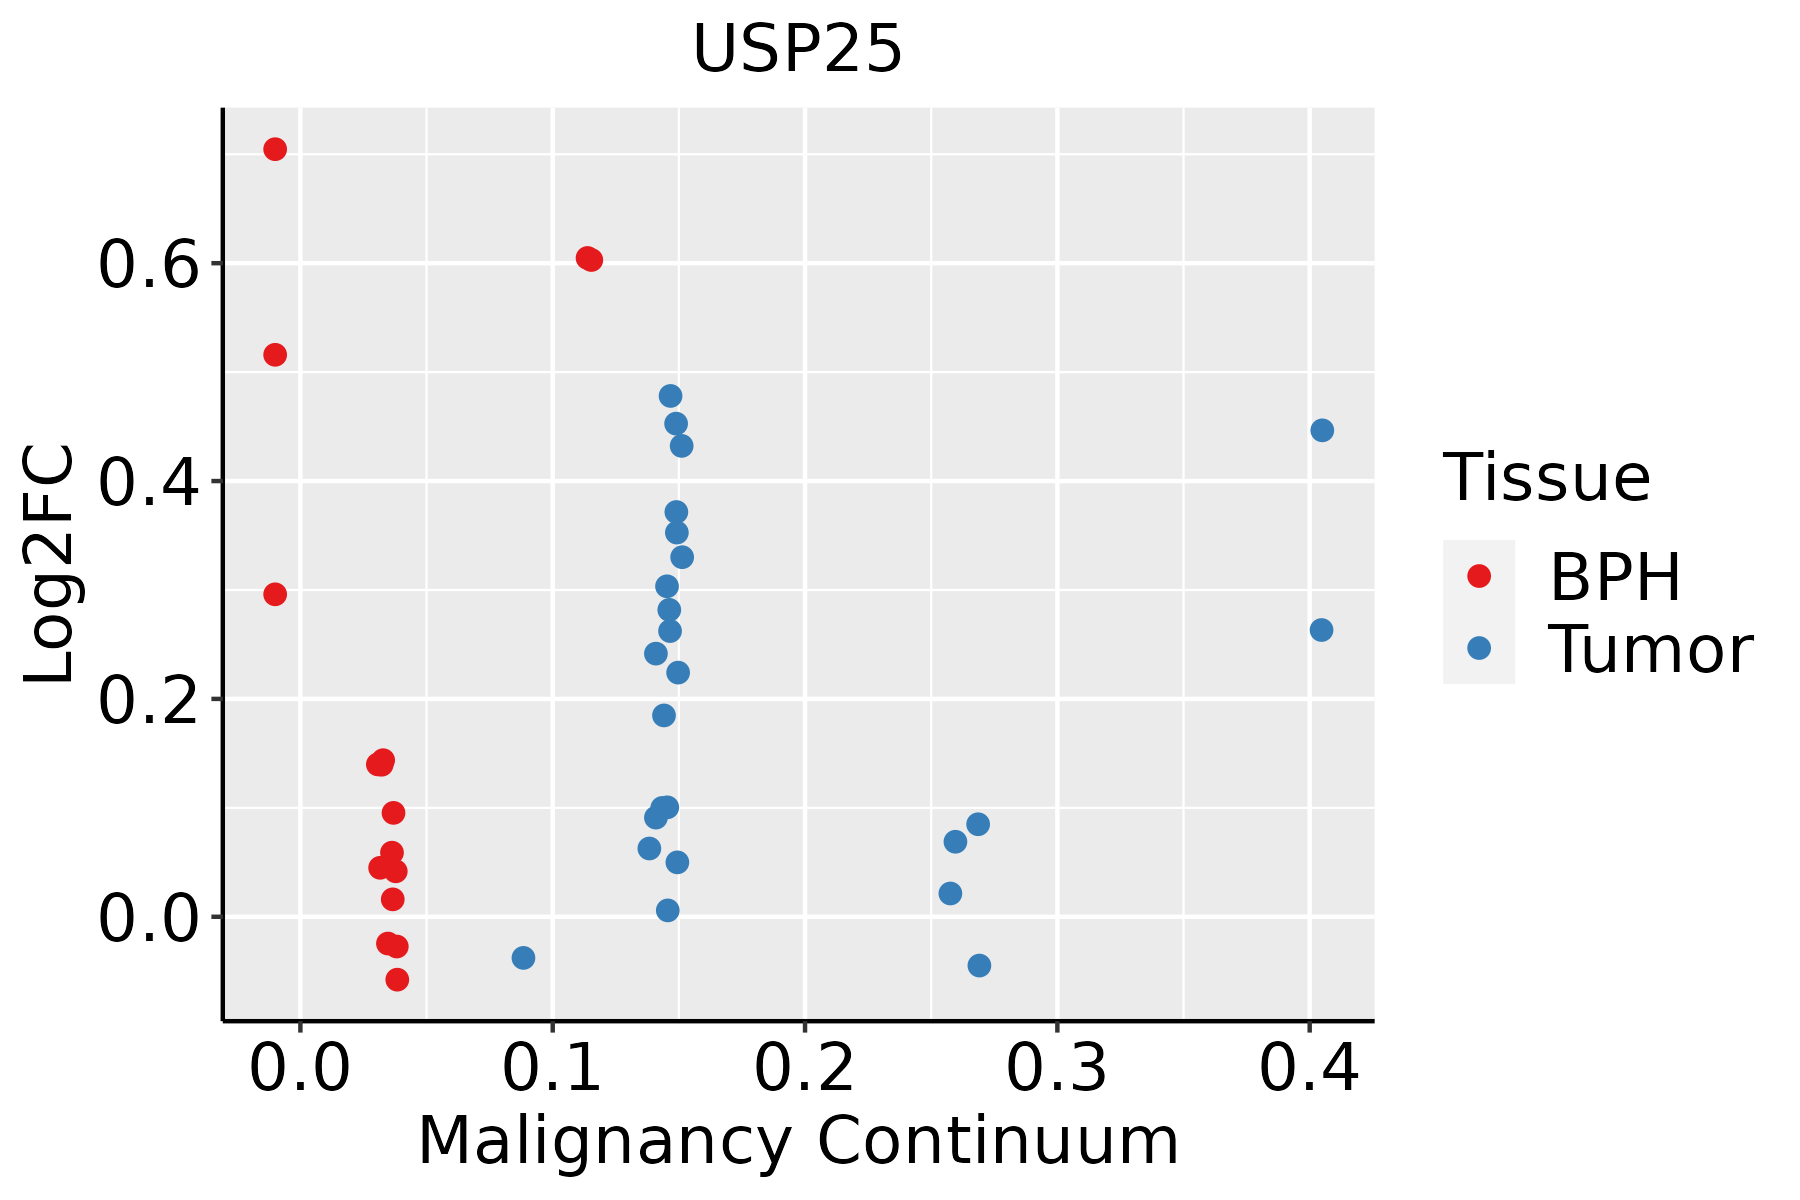 | BPH: Benign Prostatic Hyperplasia |
| ∗log2FC in expression of this searched gene in stem-like cells from each diseased tissue sample relative to stem-like cells in normal samples in each tissue plotted against the malignancy continuum. Samples are colored based on if they are from different disease stage. |
Top |
Malignant transformation related pathway analysis |
| Find out the enriched GO biological processes and KEGG pathways involved in transition from healthy to precancer to cancer |
| Tissue | Disease Stage | Enriched GO biological Processes |
| Colorectum | AD |  |
| Colorectum | SER |  |
| Colorectum | MSS |  |
| Colorectum | MSI-H |  |
| Colorectum | FAP |  |
| ∗Top 15 enriched GO BP terms are showed in the bar plot of each disease state in each tissue. Each row represents a significant GO biological process which is colored according to the -log10(p.adjust). |
| Page: 1 2 3 4 5 6 7 8 9 |
| GO ID | Tissue | Disease Stage | Description | Gene Ratio | Bg Ratio | pvalue | p.adjust | Count |
| GO:004217610 | Cervix | CC | regulation of protein catabolic process | 104/2311 | 391/18723 | 9.39e-15 | 9.36e-12 | 104 |
| GO:190336210 | Cervix | CC | regulation of cellular protein catabolic process | 72/2311 | 255/18723 | 5.98e-12 | 2.10e-09 | 72 |
| GO:001049810 | Cervix | CC | proteasomal protein catabolic process | 111/2311 | 490/18723 | 8.98e-11 | 1.58e-08 | 111 |
| GO:190305010 | Cervix | CC | regulation of proteolysis involved in cellular protein catabolic process | 60/2311 | 221/18723 | 1.82e-09 | 1.98e-07 | 60 |
| GO:004586110 | Cervix | CC | negative regulation of proteolysis | 80/2311 | 351/18723 | 2.88e-08 | 1.98e-06 | 80 |
| GO:003133010 | Cervix | CC | negative regulation of cellular catabolic process | 63/2311 | 262/18723 | 1.10e-07 | 5.68e-06 | 63 |
| GO:006113610 | Cervix | CC | regulation of proteasomal protein catabolic process | 48/2311 | 187/18723 | 4.63e-07 | 1.77e-05 | 48 |
| GO:190589710 | Cervix | CC | regulation of response to endoplasmic reticulum stress | 27/2311 | 82/18723 | 9.24e-07 | 3.25e-05 | 27 |
| GO:000989510 | Cervix | CC | negative regulation of catabolic process | 69/2311 | 320/18723 | 2.15e-06 | 6.55e-05 | 69 |
| GO:003497610 | Cervix | CC | response to endoplasmic reticulum stress | 57/2311 | 256/18723 | 5.81e-06 | 1.42e-04 | 57 |
| GO:19033639 | Cervix | CC | negative regulation of cellular protein catabolic process | 24/2311 | 75/18723 | 6.43e-06 | 1.55e-04 | 24 |
| GO:190357310 | Cervix | CC | negative regulation of response to endoplasmic reticulum stress | 17/2311 | 44/18723 | 8.57e-06 | 1.97e-04 | 17 |
| GO:19030519 | Cervix | CC | negative regulation of proteolysis involved in cellular protein catabolic process | 20/2311 | 64/18723 | 5.44e-05 | 8.04e-04 | 20 |
| GO:004217710 | Cervix | CC | negative regulation of protein catabolic process | 30/2311 | 121/18723 | 1.23e-04 | 1.53e-03 | 30 |
| GO:19017995 | Cervix | CC | negative regulation of proteasomal protein catabolic process | 13/2311 | 49/18723 | 5.34e-03 | 3.10e-02 | 13 |
| GO:00711083 | Cervix | CC | protein K48-linked deubiquitination | 10/2311 | 35/18723 | 7.99e-03 | 4.18e-02 | 10 |
| GO:0042176 | Colorectum | AD | regulation of protein catabolic process | 160/3918 | 391/18723 | 1.06e-19 | 7.34e-17 | 160 |
| GO:1903362 | Colorectum | AD | regulation of cellular protein catabolic process | 109/3918 | 255/18723 | 2.14e-15 | 6.08e-13 | 109 |
| GO:0010498 | Colorectum | AD | proteasomal protein catabolic process | 174/3918 | 490/18723 | 3.18e-14 | 7.66e-12 | 174 |
| GO:0009895 | Colorectum | AD | negative regulation of catabolic process | 124/3918 | 320/18723 | 1.66e-13 | 3.35e-11 | 124 |
| Page: 1 2 3 4 5 6 7 8 9 10 11 |
| Pathway ID | Tissue | Disease Stage | Description | Gene Ratio | Bg Ratio | pvalue | p.adjust | qvalue | Count |
| hsa0465718 | Cervix | CC | IL-17 signaling pathway | 31/1267 | 94/8465 | 8.71e-06 | 7.43e-05 | 4.39e-05 | 31 |
| hsa0465719 | Cervix | CC | IL-17 signaling pathway | 31/1267 | 94/8465 | 8.71e-06 | 7.43e-05 | 4.39e-05 | 31 |
| hsa0465720 | Endometrium | EEC | IL-17 signaling pathway | 23/1237 | 94/8465 | 7.61e-03 | 3.63e-02 | 2.71e-02 | 23 |
| hsa04657110 | Endometrium | EEC | IL-17 signaling pathway | 23/1237 | 94/8465 | 7.61e-03 | 3.63e-02 | 2.71e-02 | 23 |
| hsa0465714 | Lung | IAC | IL-17 signaling pathway | 20/1053 | 94/8465 | 1.05e-02 | 3.90e-02 | 2.59e-02 | 20 |
| hsa0465715 | Lung | IAC | IL-17 signaling pathway | 20/1053 | 94/8465 | 1.05e-02 | 3.90e-02 | 2.59e-02 | 20 |
| hsa0465723 | Prostate | BPH | IL-17 signaling pathway | 30/1718 | 94/8465 | 5.14e-03 | 1.73e-02 | 1.07e-02 | 30 |
| hsa04657111 | Prostate | BPH | IL-17 signaling pathway | 30/1718 | 94/8465 | 5.14e-03 | 1.73e-02 | 1.07e-02 | 30 |
| Page: 1 |
Top |
Cell-cell communication analysis |
| Identification of potential cell-cell interactions between two cell types and their ligand-receptor pairs for different disease states |
| Ligand | Receptor | LRpair | Pathway | Tissue | Disease Stage |
| Page: 1 |
Top |
Single-cell gene regulatory network inference analysis |
| Find out the significant the regulons (TFs) and the target genes of each regulon across cell types for different disease states |
| TF | Cell Type | Tissue | Disease Stage | Target Gene | RSS | Regulon Activity |
| ∗The dot plots of a searched regulon are shown for all cell subpopulations in each disease state of each tissue based on the regulon specific score inferred using pySCENIC and by calculating the average expression. |
| Page: 1 |
Top |
Somatic mutation of malignant transformation related genes |
| Annotation of somatic variants for genes involved in malignant transformation |
| Hugo Symbol | Variant Class | Variant Classification | dbSNP RS | HGVSc | HGVSp | HGVSp Short | SWISSPROT | BIOTYPE | SIFT | PolyPhen | Tumor Sample Barcode | Tissue | Histology | Sex | Age | Stage | Therapy Types | Drugs | Outcome |
| USP25 | SNV | Missense_Mutation | c.2039N>A | p.Thr680Lys | p.T680K | Q9UHP3 | protein_coding | tolerated(0.39) | benign(0.02) | TCGA-A2-A0T0-01 | Breast | breast invasive carcinoma | Female | <65 | I/II | Chemotherapy | taxotere | SD | |
| USP25 | SNV | Missense_Mutation | c.682N>G | p.Leu228Val | p.L228V | Q9UHP3 | protein_coding | deleterious(0) | probably_damaging(0.966) | TCGA-A2-A0YH-01 | Breast | breast invasive carcinoma | Female | <65 | III/IV | Chemotherapy | adriamycin | SD | |
| USP25 | SNV | Missense_Mutation | novel | c.104T>C | p.Ile35Thr | p.I35T | Q9UHP3 | protein_coding | tolerated(0.08) | benign(0.149) | TCGA-A8-A09Z-01 | Breast | breast invasive carcinoma | Female | >=65 | I/II | Unknown | Unknown | SD |
| USP25 | SNV | Missense_Mutation | c.381A>T | p.Gln127His | p.Q127H | Q9UHP3 | protein_coding | deleterious(0.02) | probably_damaging(0.93) | TCGA-A8-A09Z-01 | Breast | breast invasive carcinoma | Female | >=65 | I/II | Unknown | Unknown | SD | |
| USP25 | SNV | Missense_Mutation | rs758225327 | c.3040N>A | p.Glu1014Lys | p.E1014K | Q9UHP3 | protein_coding | tolerated(0.22) | benign(0.441) | TCGA-AN-A046-01 | Breast | breast invasive carcinoma | Female | >=65 | I/II | Unknown | Unknown | SD |
| USP25 | SNV | Missense_Mutation | c.1828N>A | p.Ala610Thr | p.A610T | Q9UHP3 | protein_coding | deleterious(0) | probably_damaging(0.999) | TCGA-AN-A0AK-01 | Breast | breast invasive carcinoma | Female | >=65 | I/II | Unknown | Unknown | SD | |
| USP25 | SNV | Missense_Mutation | novel | c.1520N>T | p.Ser507Leu | p.S507L | Q9UHP3 | protein_coding | tolerated(0.26) | benign(0) | TCGA-BH-A2L8-01 | Breast | breast invasive carcinoma | Female | <65 | I/II | Chemotherapy | cytoxan | CR |
| USP25 | SNV | Missense_Mutation | novel | c.1119N>T | p.Glu373Asp | p.E373D | Q9UHP3 | protein_coding | deleterious(0) | probably_damaging(0.986) | TCGA-VS-A959-01 | Cervix | cervical & endocervical cancer | Female | >=65 | I/II | Unknown | Unknown | SD |
| USP25 | SNV | Missense_Mutation | c.1164A>C | p.Lys388Asn | p.K388N | Q9UHP3 | protein_coding | deleterious(0) | probably_damaging(1) | TCGA-AA-3977-01 | Colorectum | colon adenocarcinoma | Male | >=65 | I/II | Unknown | Unknown | SD | |
| USP25 | SNV | Missense_Mutation | novel | c.2705N>A | p.Arg902Lys | p.R902K | Q9UHP3 | protein_coding | tolerated(0.75) | benign(0.025) | TCGA-AA-A00N-01 | Colorectum | colon adenocarcinoma | Male | >=65 | I/II | Unknown | Unknown | PD |
| Page: 1 2 3 4 5 6 7 8 9 10 11 12 13 |
Top |
Related drugs of malignant transformation related genes |
| Identification of chemicals and drugs interact with genes involved in malignant transfromation |
| (DGIdb 4.0) |
| Entrez ID | Symbol | Category | Interaction Types | Drug Claim Name | Drug Name | PMIDs |
| Page: 1 |

Copyright 2023-Present -The University of Texas Health Science Center at Houston |