
|
|||||
|
 | |
| |
| |
| |
| |
| |
|
Gene: USP24 |
Gene summary for USP24 |
| Gene information | Species | Human | Gene symbol | USP24 | Gene ID | 23358 |
| Gene name | ubiquitin specific peptidase 24 | |
| Gene Alias | USP24 | |
| Cytomap | 1p32.3 | |
| Gene Type | protein-coding | GO ID | GO:0006464 | UniProtAcc | Q9UPU5 |
Top |
Malignant transformation analysis |
| Identification of the aberrant gene expression in precancerous and cancerous lesions by comparing the gene expression of stem-like cells in diseased tissues with normal stem cells |
| Entrez ID | Symbol | Replicates | Species | Organ | Tissue | Adj P-value | Log2FC | Malignancy |
| 23358 | USP24 | CCI_2 | Human | Cervix | CC | 1.50e-05 | 6.42e-01 | 0.5249 |
| 23358 | USP24 | CCI_3 | Human | Cervix | CC | 1.76e-07 | 5.75e-01 | 0.516 |
| 23358 | USP24 | HTA11_3410_2000001011 | Human | Colorectum | AD | 2.69e-17 | -6.28e-01 | 0.0155 |
| 23358 | USP24 | HTA11_2487_2000001011 | Human | Colorectum | SER | 1.03e-08 | -5.95e-01 | -0.1808 |
| 23358 | USP24 | HTA11_3361_2000001011 | Human | Colorectum | AD | 6.80e-07 | -6.01e-01 | -0.1207 |
| 23358 | USP24 | HTA11_696_2000001011 | Human | Colorectum | AD | 1.64e-18 | -4.82e-01 | -0.1464 |
| 23358 | USP24 | HTA11_866_2000001011 | Human | Colorectum | AD | 5.95e-08 | -4.28e-01 | -0.1001 |
| 23358 | USP24 | HTA11_5212_2000001011 | Human | Colorectum | AD | 4.77e-03 | -5.99e-01 | -0.2061 |
| 23358 | USP24 | HTA11_546_2000001011 | Human | Colorectum | AD | 6.93e-03 | -4.75e-01 | -0.0842 |
| 23358 | USP24 | HTA11_9341_2000001011 | Human | Colorectum | SER | 4.77e-02 | -7.90e-01 | -0.00410000000000005 |
| 23358 | USP24 | HTA11_866_3004761011 | Human | Colorectum | AD | 1.24e-09 | -5.59e-01 | 0.096 |
| 23358 | USP24 | HTA11_8622_2000001021 | Human | Colorectum | SER | 4.32e-03 | -5.29e-01 | 0.0528 |
| 23358 | USP24 | HTA11_10711_2000001011 | Human | Colorectum | AD | 2.91e-07 | -5.42e-01 | 0.0338 |
| 23358 | USP24 | HTA11_7696_3000711011 | Human | Colorectum | AD | 5.09e-17 | -5.54e-01 | 0.0674 |
| 23358 | USP24 | HTA11_99999970781_79442 | Human | Colorectum | MSS | 1.84e-05 | -3.61e-01 | 0.294 |
| 23358 | USP24 | HTA11_99999973899_84307 | Human | Colorectum | MSS | 8.95e-07 | -6.23e-01 | 0.2585 |
| 23358 | USP24 | HTA11_99999974143_84620 | Human | Colorectum | MSS | 1.20e-24 | -6.38e-01 | 0.3005 |
| 23358 | USP24 | F007 | Human | Colorectum | FAP | 2.37e-05 | -4.28e-01 | 0.1176 |
| 23358 | USP24 | A002-C-010 | Human | Colorectum | FAP | 1.66e-04 | -2.89e-01 | 0.242 |
| 23358 | USP24 | A001-C-207 | Human | Colorectum | FAP | 5.12e-08 | -4.15e-01 | 0.1278 |
| Page: 1 2 3 4 5 |
| Tissue | Expression Dynamics | Abbreviation |
| Cervix |  | CC: Cervix cancer |
| HSIL_HPV: HPV-infected high-grade squamous intraepithelial lesions | ||
| N_HPV: HPV-infected normal cervix | ||
| Colorectum (GSE201348) |  | FAP: Familial adenomatous polyposis |
| CRC: Colorectal cancer | ||
| Colorectum (HTA11) |  | AD: Adenomas |
| SER: Sessile serrated lesions | ||
| MSI-H: Microsatellite-high colorectal cancer | ||
| MSS: Microsatellite stable colorectal cancer | ||
| Liver |  | HCC: Hepatocellular carcinoma |
| NAFLD: Non-alcoholic fatty liver disease | ||
| Prostate | 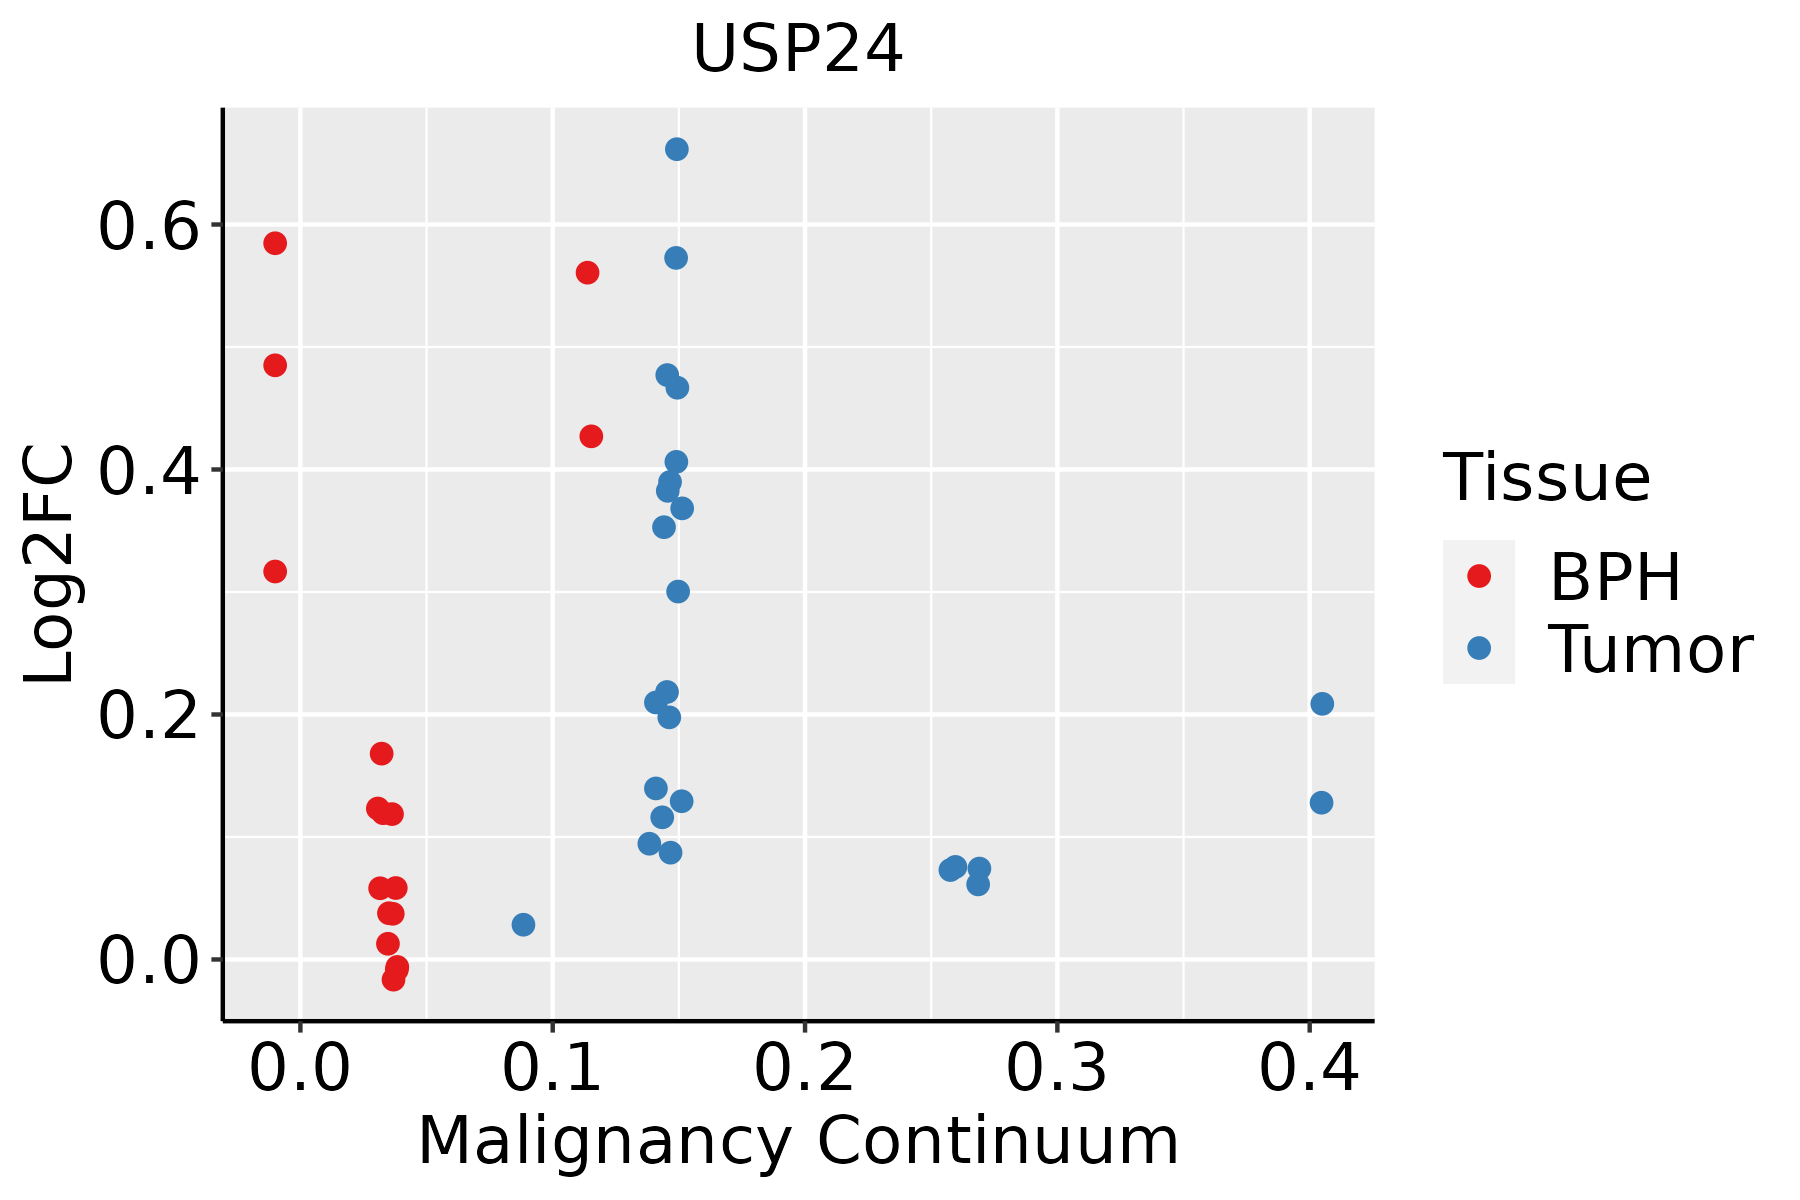 | BPH: Benign Prostatic Hyperplasia |
| Thyroid | 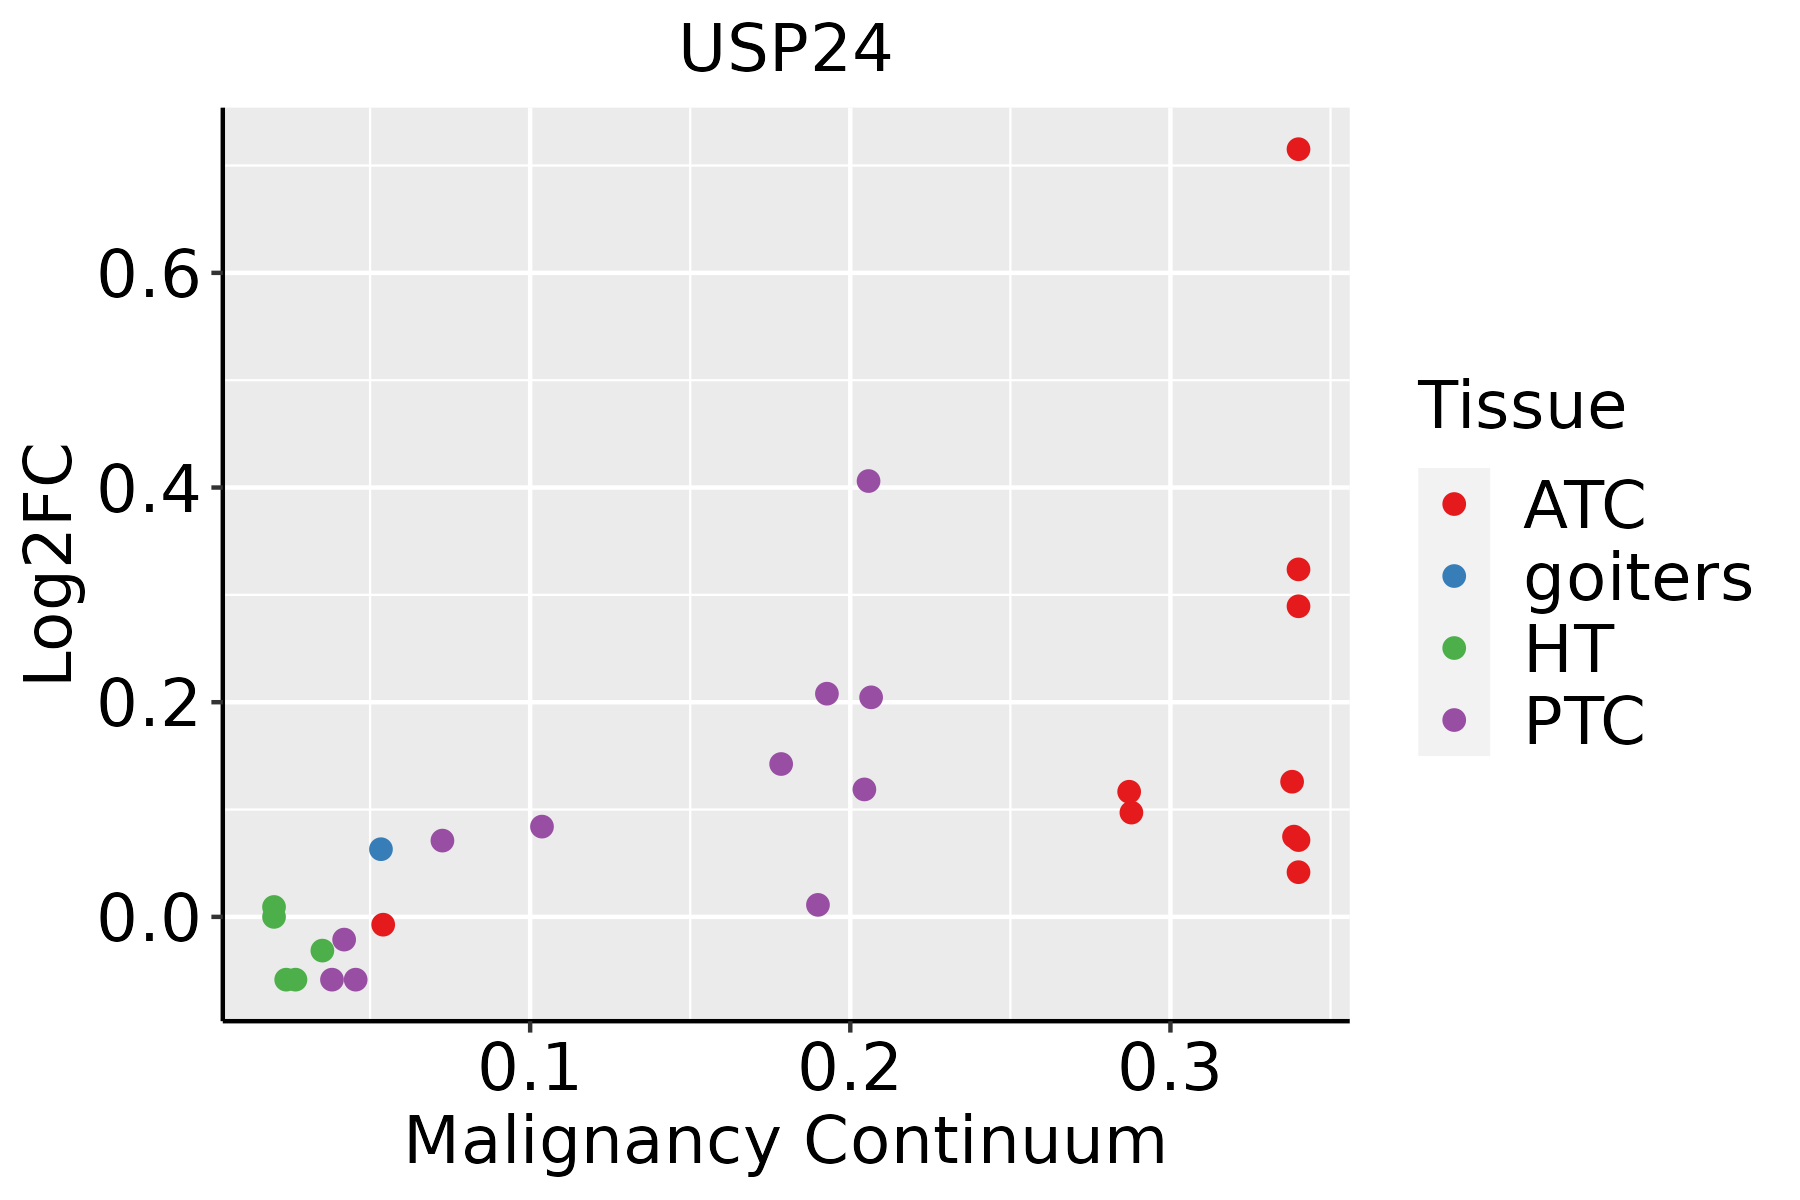 | ATC: Anaplastic thyroid cancer |
| HT: Hashimoto's thyroiditis | ||
| PTC: Papillary thyroid cancer |
| ∗log2FC in expression of this searched gene in stem-like cells from each diseased tissue sample relative to stem-like cells in normal samples in each tissue plotted against the malignancy continuum. Samples are colored based on if they are from different disease stage. |
Top |
Malignant transformation related pathway analysis |
| Find out the enriched GO biological processes and KEGG pathways involved in transition from healthy to precancer to cancer |
| Tissue | Disease Stage | Enriched GO biological Processes |
| Colorectum | AD |  |
| Colorectum | SER |  |
| Colorectum | MSS |  |
| Colorectum | MSI-H |  |
| Colorectum | FAP |  |
| ∗Top 15 enriched GO BP terms are showed in the bar plot of each disease state in each tissue. Each row represents a significant GO biological process which is colored according to the -log10(p.adjust). |
| Page: 1 2 3 4 5 6 7 8 9 |
| GO ID | Tissue | Disease Stage | Description | Gene Ratio | Bg Ratio | pvalue | p.adjust | Count |
| GO:0070646 | Liver | NAFLD | protein modification by small protein removal | 29/1882 | 157/18723 | 9.11e-04 | 1.09e-02 | 29 |
| GO:0016579 | Liver | NAFLD | protein deubiquitination | 26/1882 | 139/18723 | 1.35e-03 | 1.52e-02 | 26 |
| GO:00706461 | Liver | HCC | protein modification by small protein removal | 91/7958 | 157/18723 | 6.50e-05 | 5.92e-04 | 91 |
| GO:00165791 | Liver | HCC | protein deubiquitination | 78/7958 | 139/18723 | 8.13e-04 | 4.87e-03 | 78 |
| GO:00706465 | Thyroid | PTC | protein modification by small protein removal | 71/5968 | 157/18723 | 3.03e-04 | 2.12e-03 | 71 |
| GO:00165794 | Thyroid | PTC | protein deubiquitination | 59/5968 | 139/18723 | 5.50e-03 | 2.50e-02 | 59 |
| GO:007064613 | Thyroid | ATC | protein modification by small protein removal | 71/6293 | 157/18723 | 1.59e-03 | 7.99e-03 | 71 |
| Page: 1 |
| Pathway ID | Tissue | Disease Stage | Description | Gene Ratio | Bg Ratio | pvalue | p.adjust | qvalue | Count |
| Page: 1 |
Top |
Cell-cell communication analysis |
| Identification of potential cell-cell interactions between two cell types and their ligand-receptor pairs for different disease states |
| Ligand | Receptor | LRpair | Pathway | Tissue | Disease Stage |
| Page: 1 |
Top |
Single-cell gene regulatory network inference analysis |
| Find out the significant the regulons (TFs) and the target genes of each regulon across cell types for different disease states |
| TF | Cell Type | Tissue | Disease Stage | Target Gene | RSS | Regulon Activity |
| ∗The dot plots of a searched regulon are shown for all cell subpopulations in each disease state of each tissue based on the regulon specific score inferred using pySCENIC and by calculating the average expression. |
| Page: 1 |
Top |
Somatic mutation of malignant transformation related genes |
| Annotation of somatic variants for genes involved in malignant transformation |
| Hugo Symbol | Variant Class | Variant Classification | dbSNP RS | HGVSc | HGVSp | HGVSp Short | SWISSPROT | BIOTYPE | SIFT | PolyPhen | Tumor Sample Barcode | Tissue | Histology | Sex | Age | Stage | Therapy Types | Drugs | Outcome |
| USP24 | SNV | Missense_Mutation | novel | c.5542N>C | p.Gly1848Arg | p.G1848R | Q9UPU5 | protein_coding | deleterious(0) | probably_damaging(0.99) | TCGA-A8-A07R-01 | Breast | breast invasive carcinoma | Female | >=65 | III/IV | Ancillary | zoledronic | SD |
| USP24 | SNV | Missense_Mutation | rs777733820 | c.3998N>T | p.Cys1333Phe | p.C1333F | Q9UPU5 | protein_coding | deleterious(0) | benign(0.16) | TCGA-A8-A096-01 | Breast | breast invasive carcinoma | Female | >=65 | I/II | Unknown | Unknown | SD |
| USP24 | SNV | Missense_Mutation | novel | c.1672N>A | p.Leu558Met | p.L558M | Q9UPU5 | protein_coding | tolerated(0.09) | probably_damaging(0.979) | TCGA-B6-A0RT-01 | Breast | breast invasive carcinoma | Female | <65 | III/IV | Unknown | Unknown | SD |
| USP24 | SNV | Missense_Mutation | rs764118354 | c.7739N>A | p.Gly2580Glu | p.G2580E | Q9UPU5 | protein_coding | deleterious_low_confidence(0) | probably_damaging(0.994) | TCGA-D8-A1JA-01 | Breast | breast invasive carcinoma | Female | <65 | III/IV | Chemotherapy | adriamycin | PD |
| USP24 | SNV | Missense_Mutation | c.4237N>T | p.Leu1413Phe | p.L1413F | Q9UPU5 | protein_coding | tolerated(0.13) | probably_damaging(0.996) | TCGA-D8-A1X6-01 | Breast | breast invasive carcinoma | Female | >=65 | III/IV | Hormone Therapy | tamoxiphen | SD | |
| USP24 | SNV | Missense_Mutation | c.6628N>A | p.Val2210Ile | p.V2210I | Q9UPU5 | protein_coding | tolerated(0.36) | benign(0.055) | TCGA-E2-A1LH-01 | Breast | breast invasive carcinoma | Female | <65 | I/II | Chemotherapy | adriamycin | SD | |
| USP24 | SNV | Missense_Mutation | novel | c.5161N>A | p.Asp1721Asn | p.D1721N | Q9UPU5 | protein_coding | deleterious(0.01) | benign(0.035) | TCGA-E2-A574-01 | Breast | breast invasive carcinoma | Female | <65 | I/II | Chemotherapy | adriamycin | SD |
| USP24 | SNV | Missense_Mutation | rs748267511 | c.716A>G | p.Asp239Gly | p.D239G | Q9UPU5 | protein_coding | deleterious(0) | probably_damaging(0.971) | TCGA-E9-A1NG-01 | Breast | breast invasive carcinoma | Female | <65 | I/II | Hormone Therapy | letrozole | SD |
| USP24 | SNV | Missense_Mutation | rs867800241 | c.4733C>T | p.Ser1578Leu | p.S1578L | Q9UPU5 | protein_coding | deleterious(0) | benign(0.281) | TCGA-PE-A5DE-01 | Breast | breast invasive carcinoma | Female | <65 | I/II | Chemotherapy | taxotere | CR |
| USP24 | insertion | Frame_Shift_Ins | novel | c.7128_7129insTGTGGACT | p.Pro2377CysfsTer12 | p.P2377Cfs*12 | Q9UPU5 | protein_coding | TCGA-A8-A07O-01 | Breast | breast invasive carcinoma | Female | <65 | I/II | Chemotherapy | CR |
| Page: 1 2 3 4 5 6 7 8 9 10 11 12 13 14 15 16 17 18 19 20 21 |
Top |
Related drugs of malignant transformation related genes |
| Identification of chemicals and drugs interact with genes involved in malignant transfromation |
| (DGIdb 4.0) |
| Entrez ID | Symbol | Category | Interaction Types | Drug Claim Name | Drug Name | PMIDs |
| Page: 1 |

Copyright 2023-Present -The University of Texas Health Science Center at Houston |