Schematic overview of the cellular and molecular mechanisms involved in the cancer progression, including the proposed cellular and molecular mechanisms in cancer cells trajectory. AT1: alveolar type 1 cells; AT2: alveolar type 2 cells; AAH: atypical adenomatous hyperplasia; AIS: adenocarcinoma in situ; MIA: minimally invasive adenocarcinoma; IA: invasive adenocarcinoma; EMT: epithelial-mesenchymal transition

Home

Download

Statistics

Help

Contact

Center for Computational Systems Medicine
leaf

Gene summary

leaf

Malignant transformation analysis

leaf

Malignant transformation related pathway analysis

leaf

Cell-cell communication analysis

leaf

Single-cell gene regulatory network inference analysis

leaf

Somatic mutation of malignant transformation related genes

leaf

Related drugs of malignant transformation related genes

Gene: USP22

Gene summary for USP22

check button Gene summary.

Gene informationSpeciesHuman
Gene symbol

USP22

Gene ID

23326

Gene nameubiquitin specific peptidase 22
Gene AliasUSP3L
Cytomap17p11.2
Gene Typeprotein-coding
GO ID

GO:0000278

UniProtAcc

Q9UPT9


Top

Malignant transformation analysis

check button Identification of the aberrant gene expression in precancerous and cancerous lesions by comparing the gene expression of stem-like cells in diseased tissues with normal stem cells
check button Malignant transformation involving gene list.
Entrez IDSymbolReplicatesSpeciesOrganTissueAdj P-valueLog2FCMalignancy
23326USP22A001-C-207HumanColorectumFAP3.22e-02-1.43e-010.1278
23326USP22A015-C-203HumanColorectumFAP1.78e-18-3.02e-01-0.1294
23326USP22A015-C-204HumanColorectumFAP1.83e-04-1.71e-01-0.0228
23326USP22A014-C-040HumanColorectumFAP1.89e-02-1.47e-01-0.1184
23326USP22A002-C-201HumanColorectumFAP3.28e-08-1.16e-010.0324
23326USP22A001-C-119HumanColorectumFAP4.21e-03-1.91e-01-0.1557
23326USP22A001-C-108HumanColorectumFAP1.79e-09-1.76e-01-0.0272
23326USP22A002-C-205HumanColorectumFAP1.49e-16-2.79e-01-0.1236
23326USP22A015-C-006HumanColorectumFAP4.93e-10-2.85e-01-0.0994
23326USP22A015-C-106HumanColorectumFAP3.22e-05-8.56e-02-0.0511
23326USP22A002-C-114HumanColorectumFAP1.70e-11-1.92e-01-0.1561
23326USP22A015-C-104HumanColorectumFAP2.15e-17-1.56e-01-0.1899
23326USP22A001-C-014HumanColorectumFAP6.59e-08-2.27e-010.0135
23326USP22A002-C-016HumanColorectumFAP3.16e-09-2.16e-010.0521
23326USP22A015-C-002HumanColorectumFAP2.79e-08-2.94e-01-0.0763
23326USP22A001-C-203HumanColorectumFAP1.04e-05-9.68e-02-0.0481
23326USP22A002-C-116HumanColorectumFAP2.37e-19-2.38e-01-0.0452
23326USP22A014-C-008HumanColorectumFAP9.08e-11-3.53e-01-0.191
23326USP22A018-E-020HumanColorectumFAP9.70e-12-1.62e-01-0.2034
23326USP22F034HumanColorectumFAP8.84e-10-1.70e-01-0.0665
Page: 1 2 3 4 5 6 7 8 9 10 

check button Transcriptomic changes along malignancy continuum.
TissueExpression DynamicsAbbreviation
Colorectum (GSE201348)The image shows the transcriptomic changes along malignancy continuum.log2FC in expression of this searched gene in stem-like cells from each diseased tissue sample relative to stem-like cells in normal samples in each tissue plotted against the malignancy continuum. Samples are colored based on if they are from different disease stage.
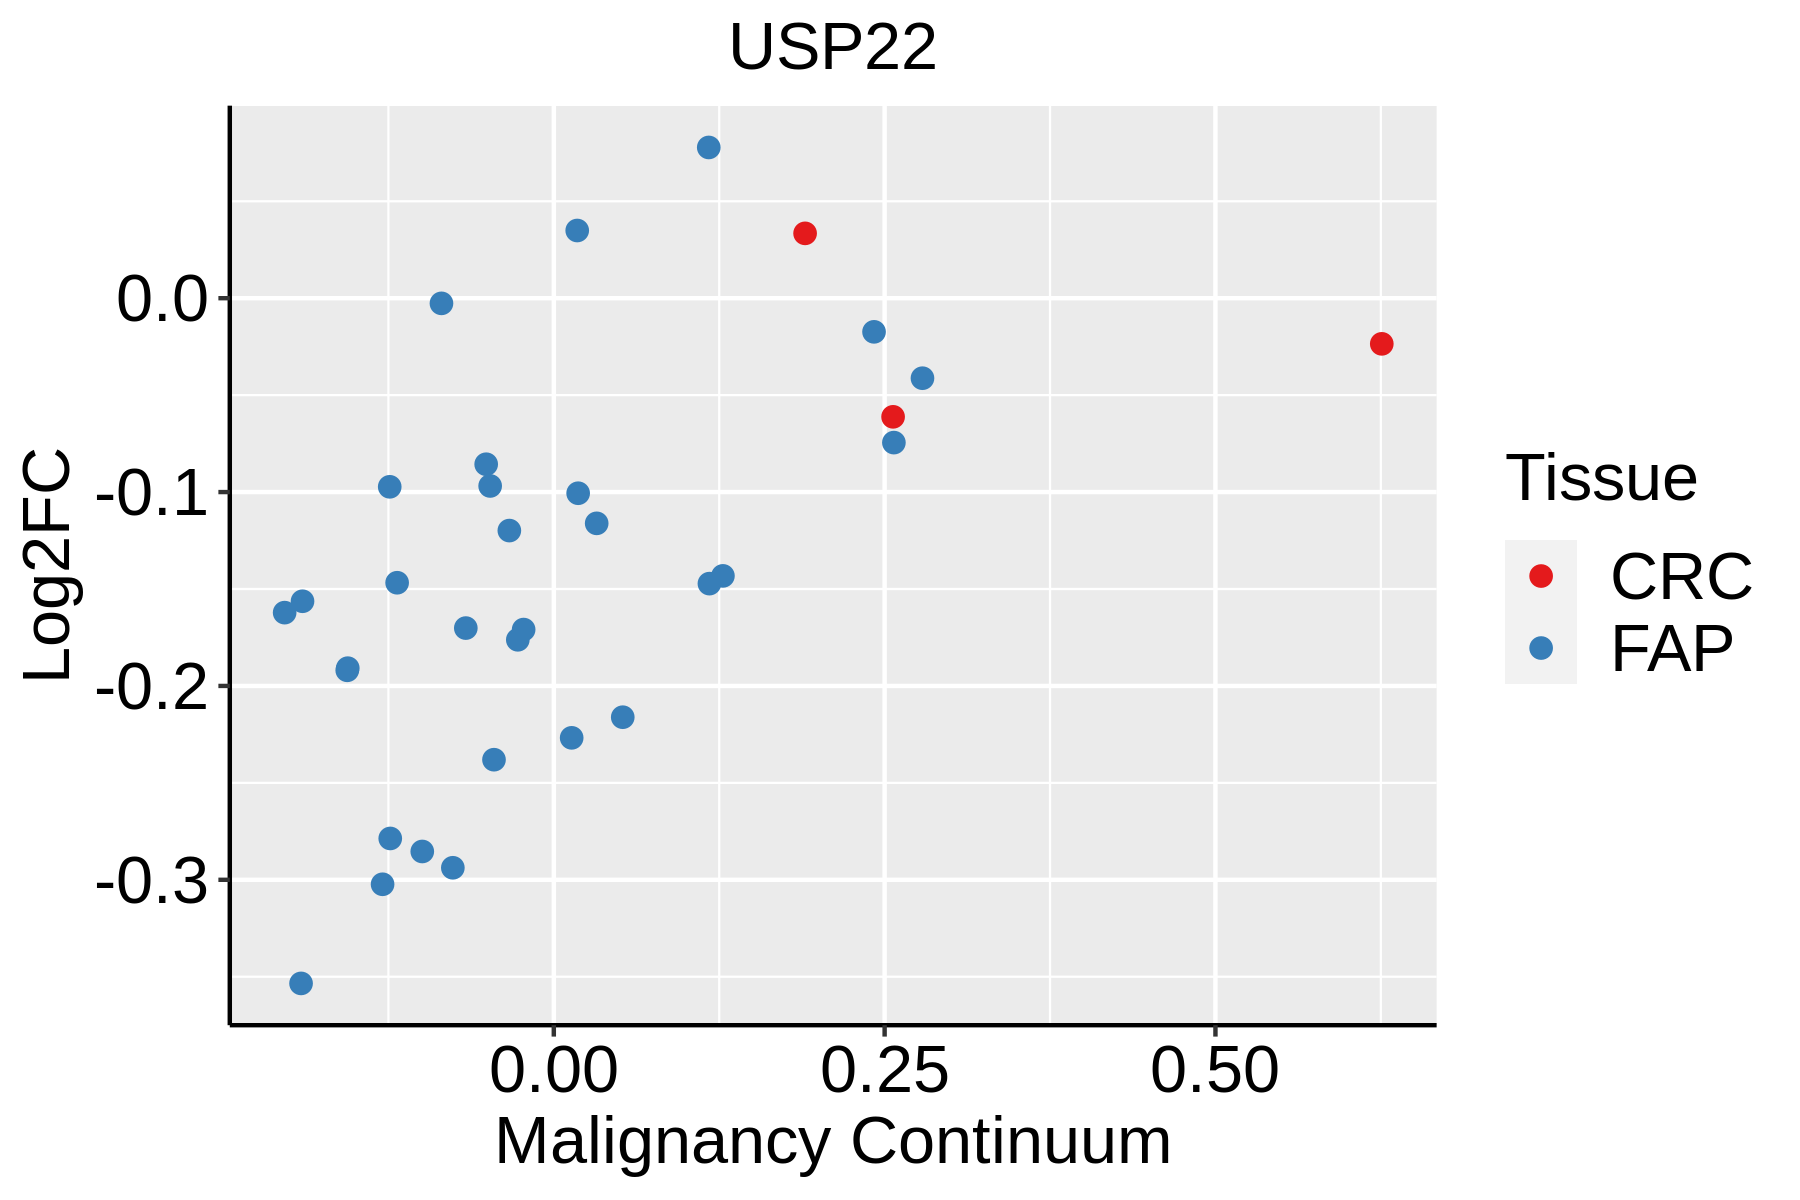
FAP: Familial adenomatous polyposis
CRC: Colorectal cancer
Colorectum (HTA11)The image shows the transcriptomic changes along malignancy continuum.log2FC in expression of this searched gene in stem-like cells from each diseased tissue sample relative to stem-like cells in normal samples in each tissue plotted against the malignancy continuum. Samples are colored based on if they are from different disease stage.AD: Adenomas
SER: Sessile serrated lesions
MSI-H: Microsatellite-high colorectal cancer
MSS: Microsatellite stable colorectal cancer
EsophagusThe image shows the transcriptomic changes along malignancy continuum.log2FC in expression of this searched gene in stem-like cells from each diseased tissue sample relative to stem-like cells in normal samples in each tissue plotted against the malignancy continuum. Samples are colored based on if they are from different disease stage.
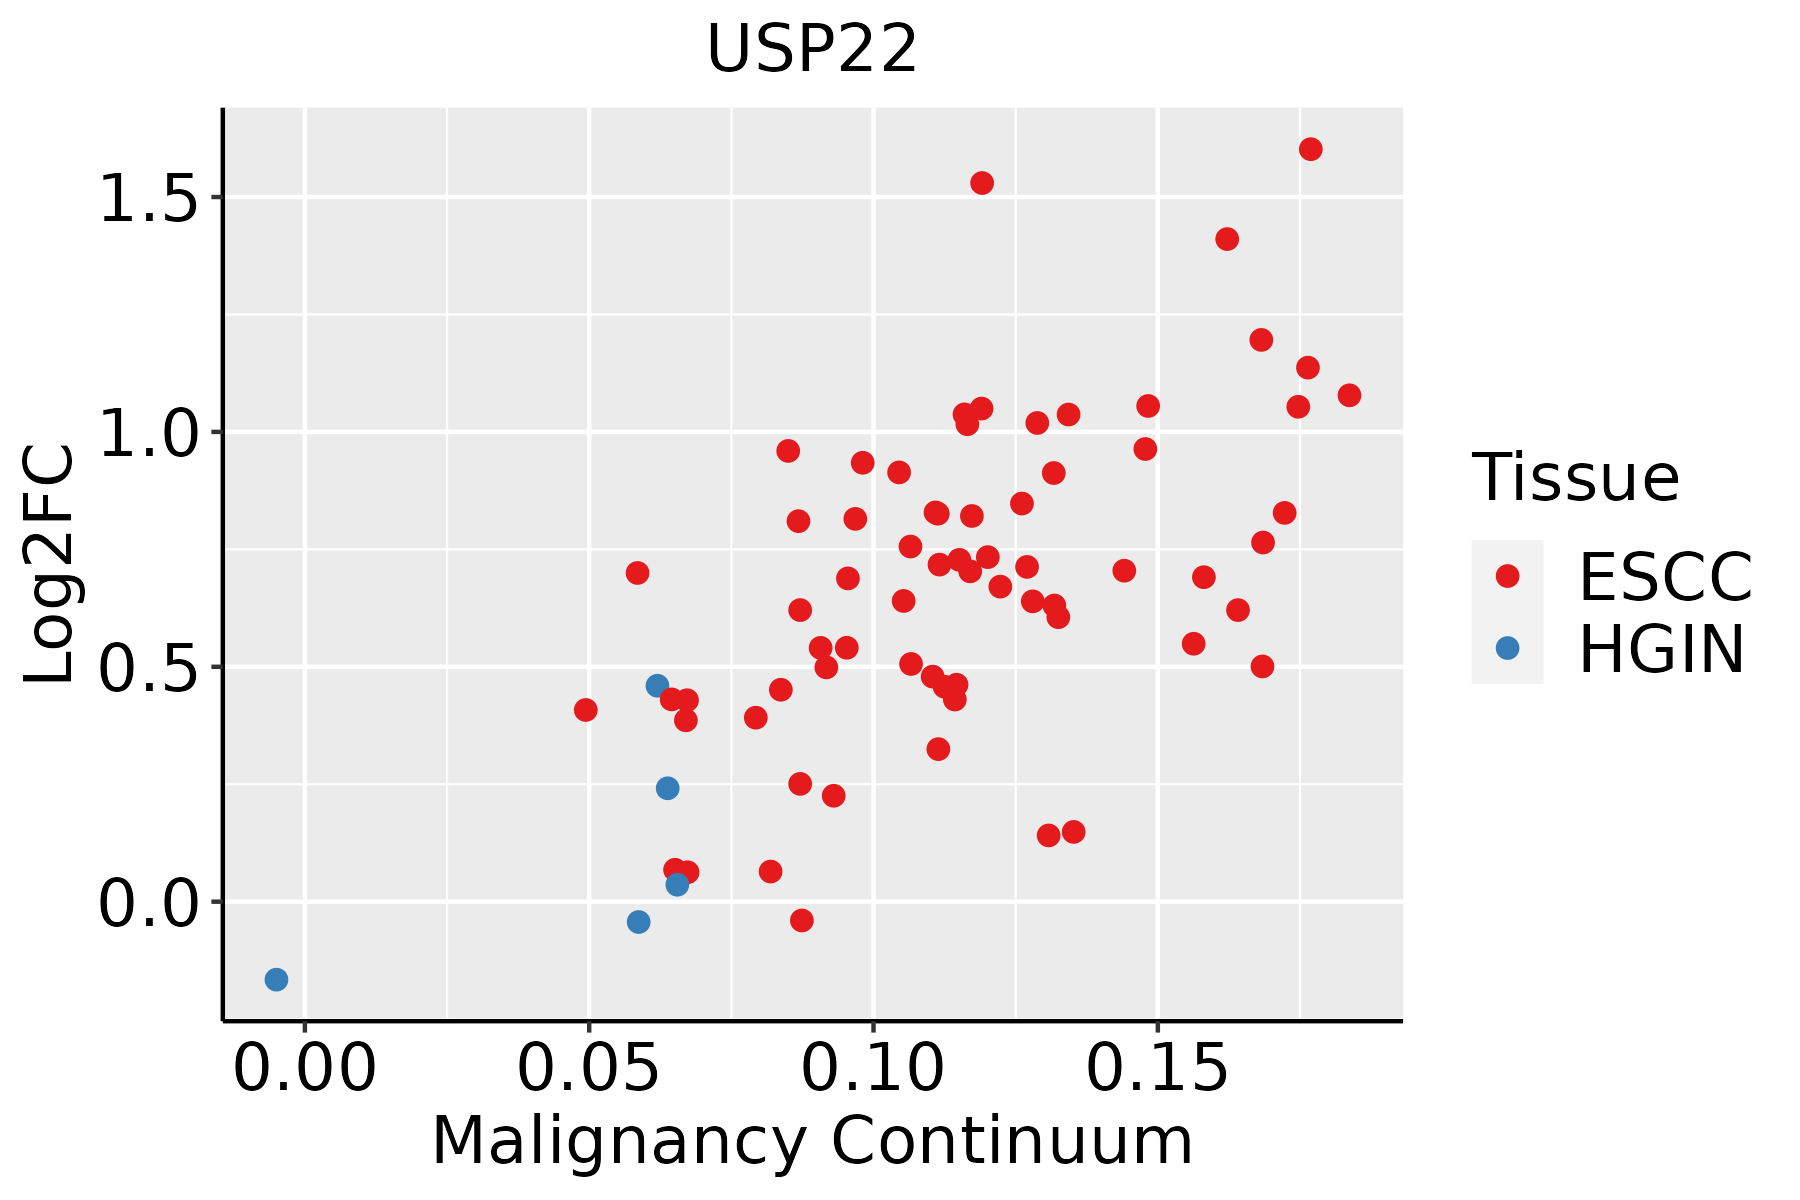
ESCC: Esophageal squamous cell carcinoma
HGIN: High-grade intraepithelial neoplasias
LGIN: Low-grade intraepithelial neoplasias
LiverThe image shows the transcriptomic changes along malignancy continuum.log2FC in expression of this searched gene in stem-like cells from each diseased tissue sample relative to stem-like cells in normal samples in each tissue plotted against the malignancy continuum. Samples are colored based on if they are from different disease stage.
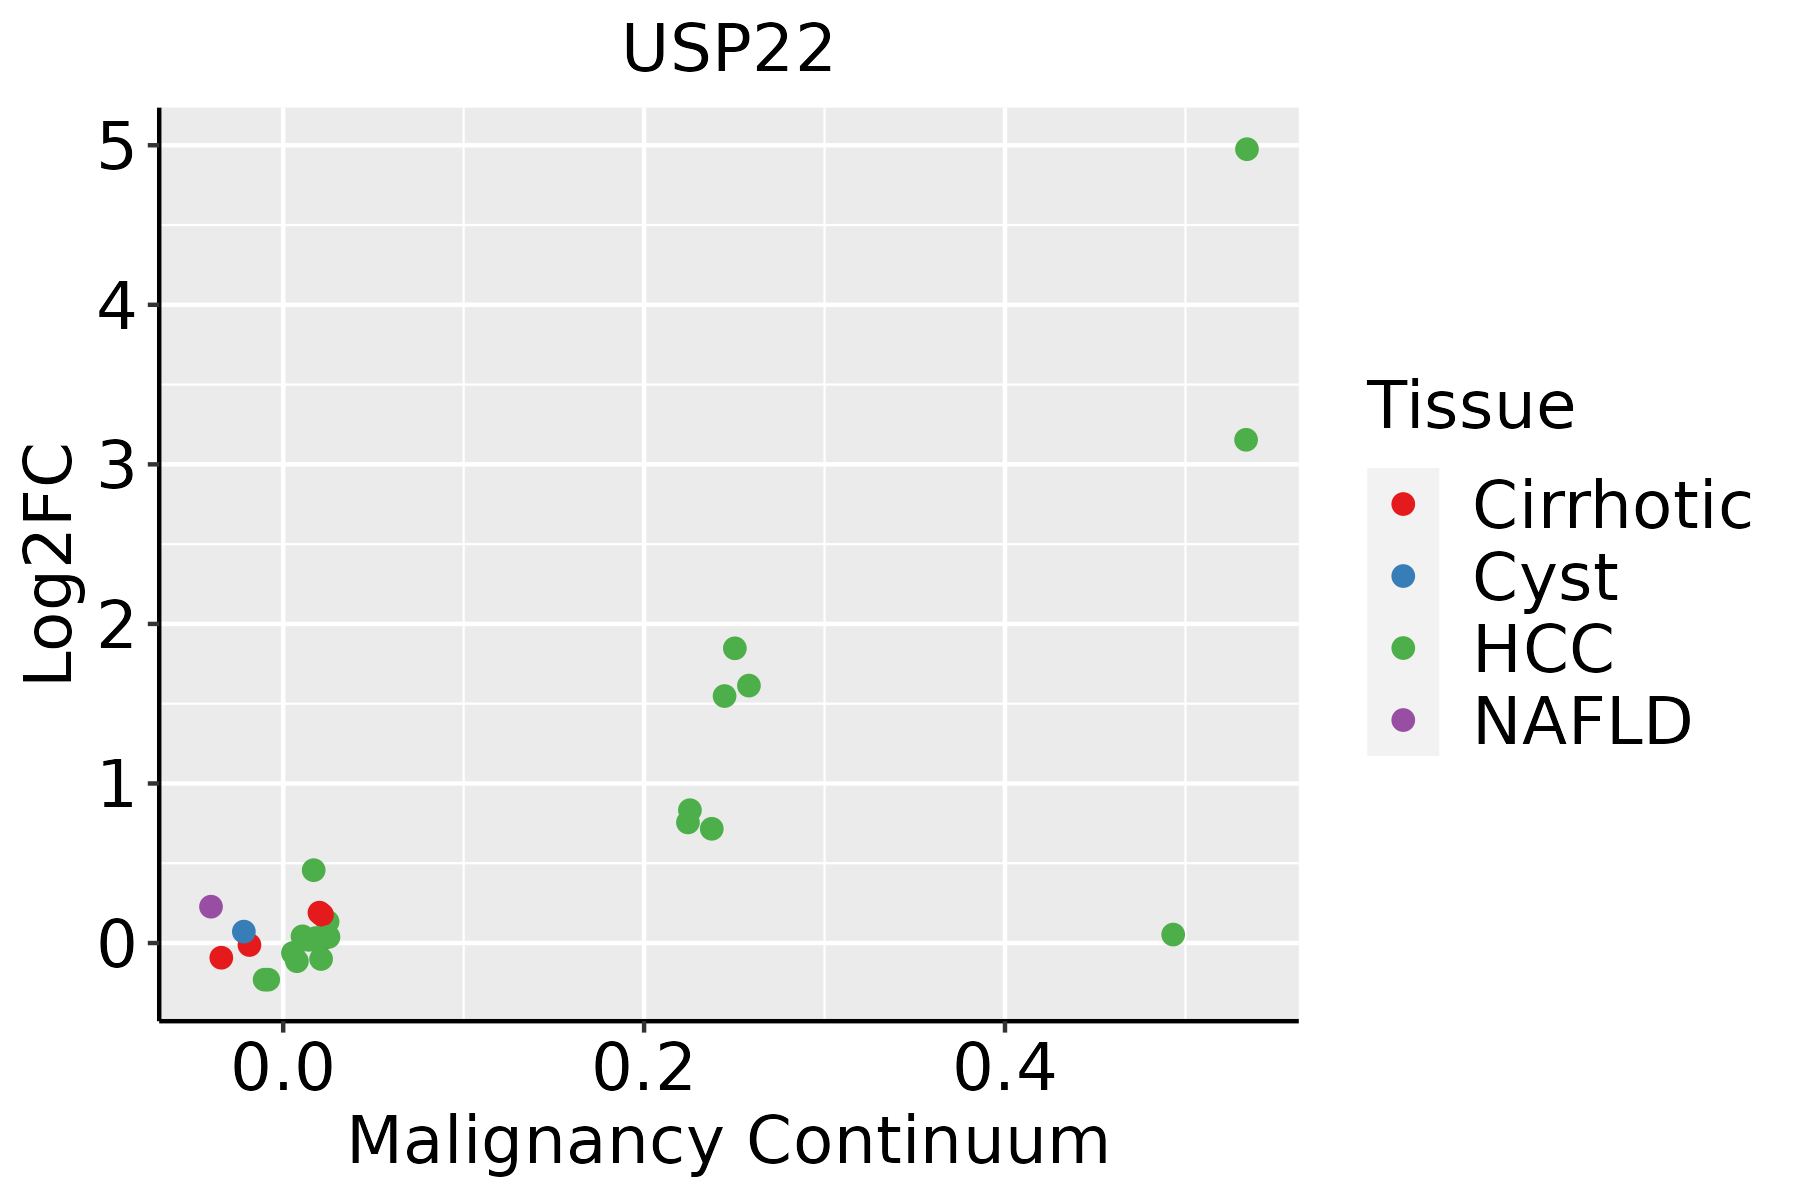
HCC: Hepatocellular carcinoma
NAFLD: Non-alcoholic fatty liver disease
LungThe image shows the transcriptomic changes along malignancy continuum.log2FC in expression of this searched gene in stem-like cells from each diseased tissue sample relative to stem-like cells in normal samples in each tissue plotted against the malignancy continuum. Samples are colored based on if they are from different disease stage.
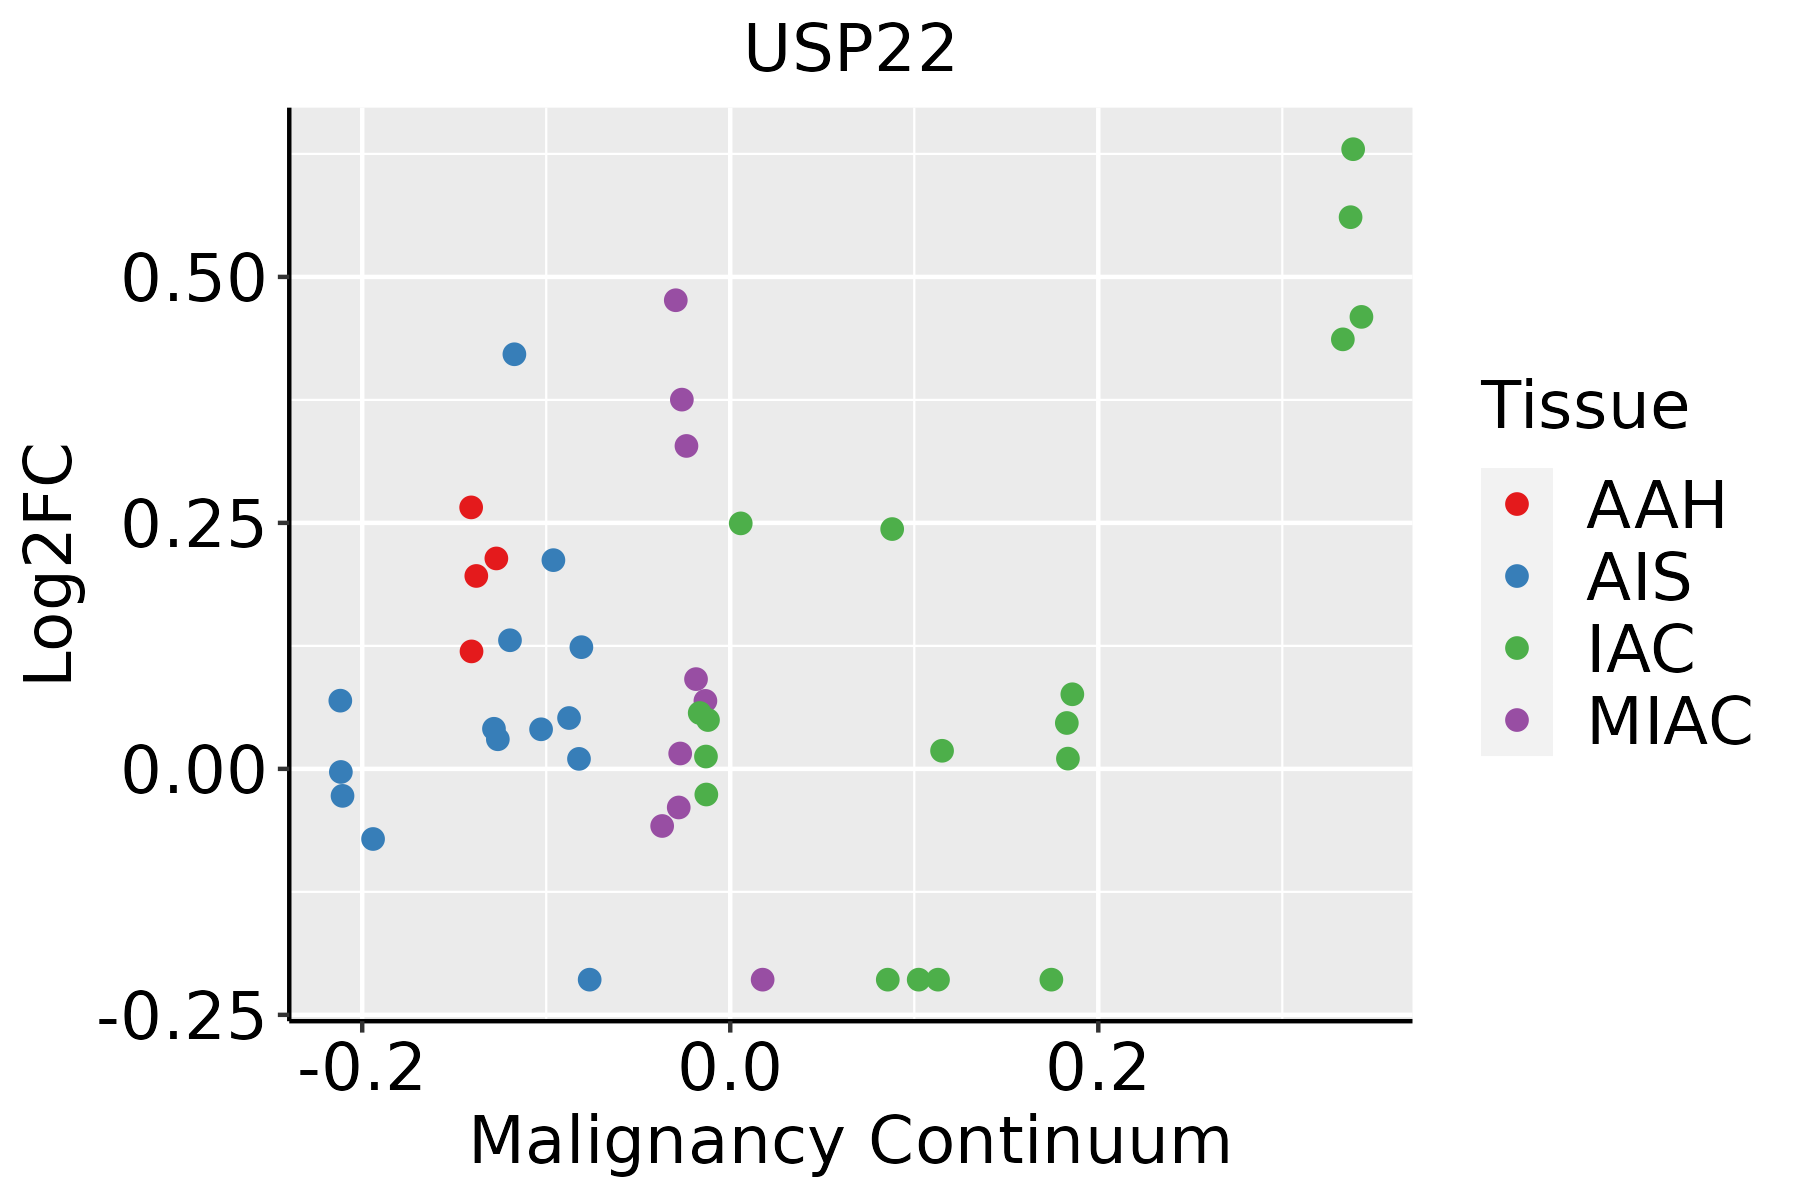
AAH: Atypical adenomatous hyperplasia
AIS: Adenocarcinoma in situ
IAC: Invasive lung adenocarcinoma
MIA: Minimally invasive adenocarcinoma
Oral CavityThe image shows the transcriptomic changes along malignancy continuum.log2FC in expression of this searched gene in stem-like cells from each diseased tissue sample relative to stem-like cells in normal samples in each tissue plotted against the malignancy continuum. Samples are colored based on if they are from different disease stage.
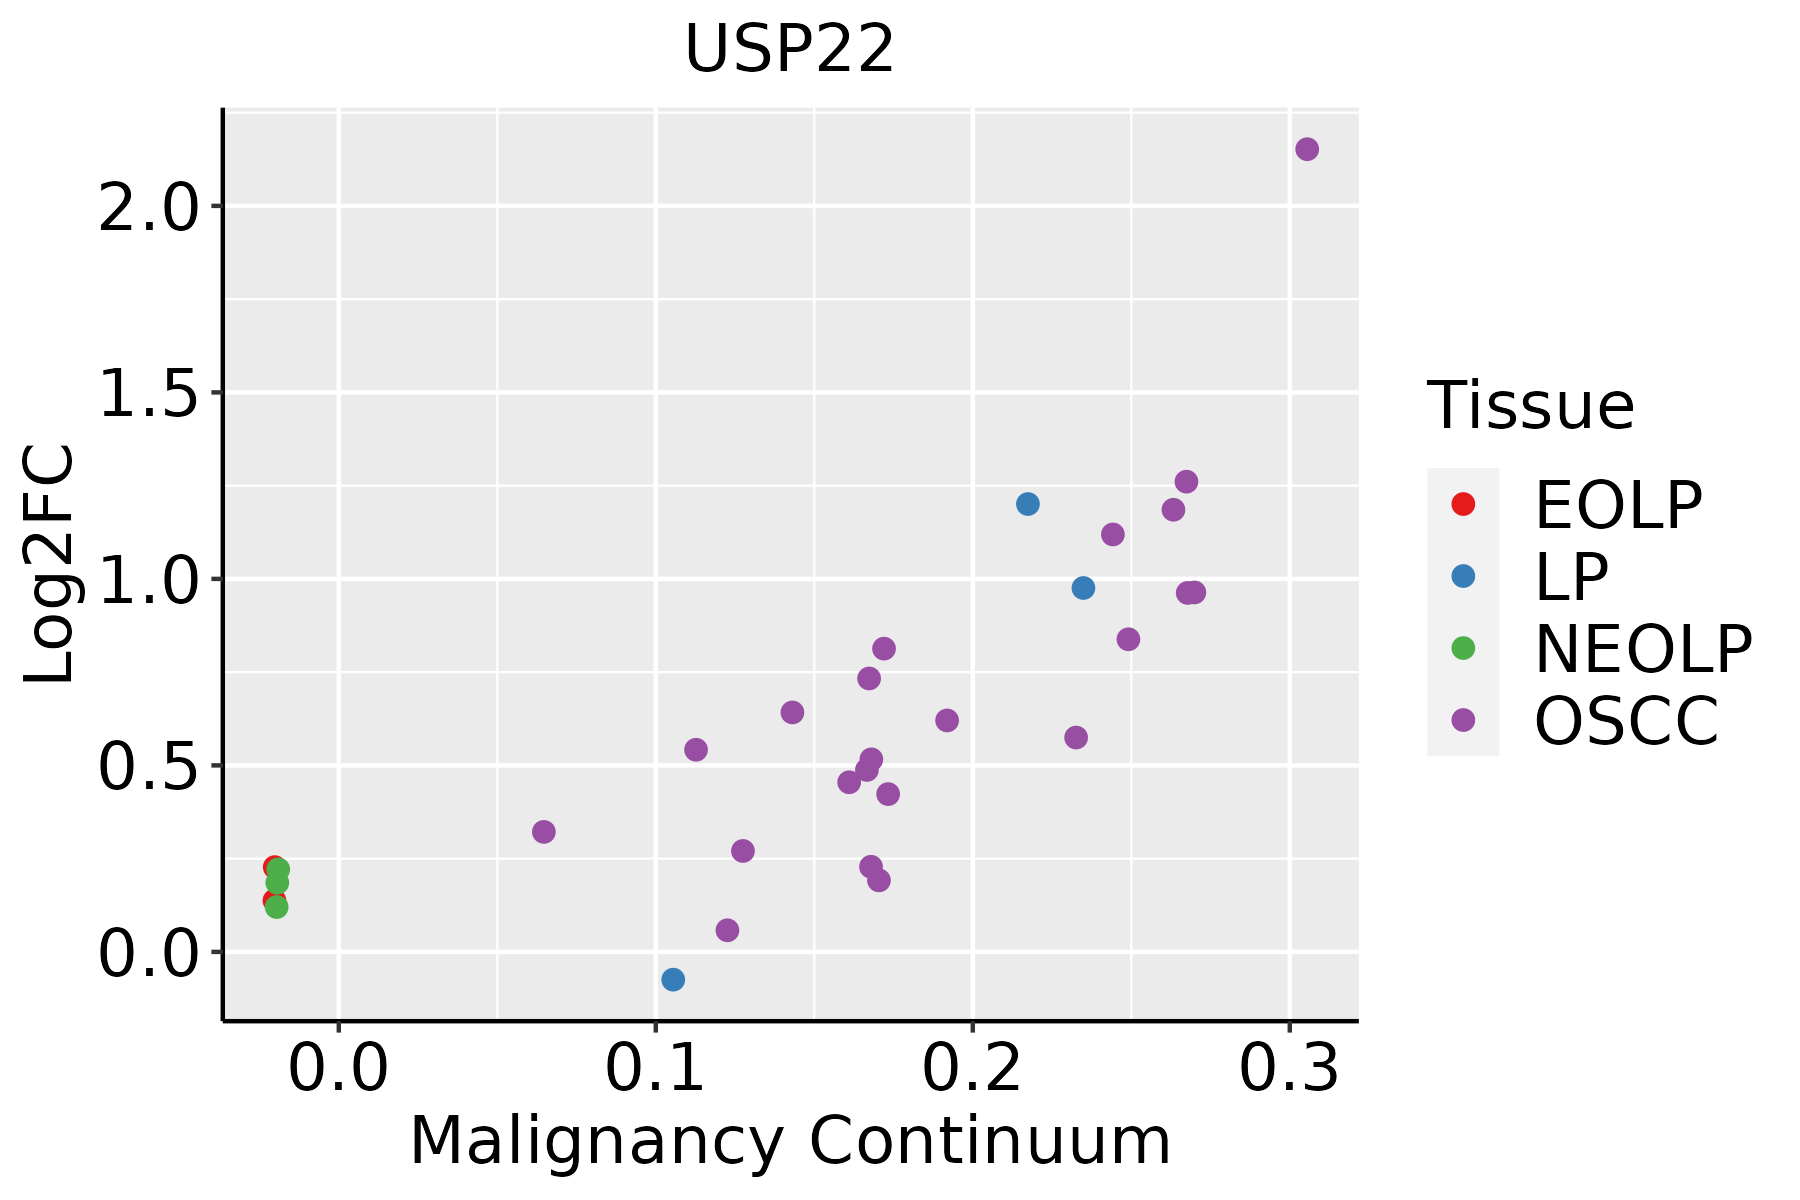
EOLP: Erosive Oral lichen planus
LP: leukoplakia
NEOLP: Non-erosive oral lichen planus
OSCC: Oral squamous cell carcinoma
ProstateThe image shows the transcriptomic changes along malignancy continuum.log2FC in expression of this searched gene in stem-like cells from each diseased tissue sample relative to stem-like cells in normal samples in each tissue plotted against the malignancy continuum. Samples are colored based on if they are from different disease stage.
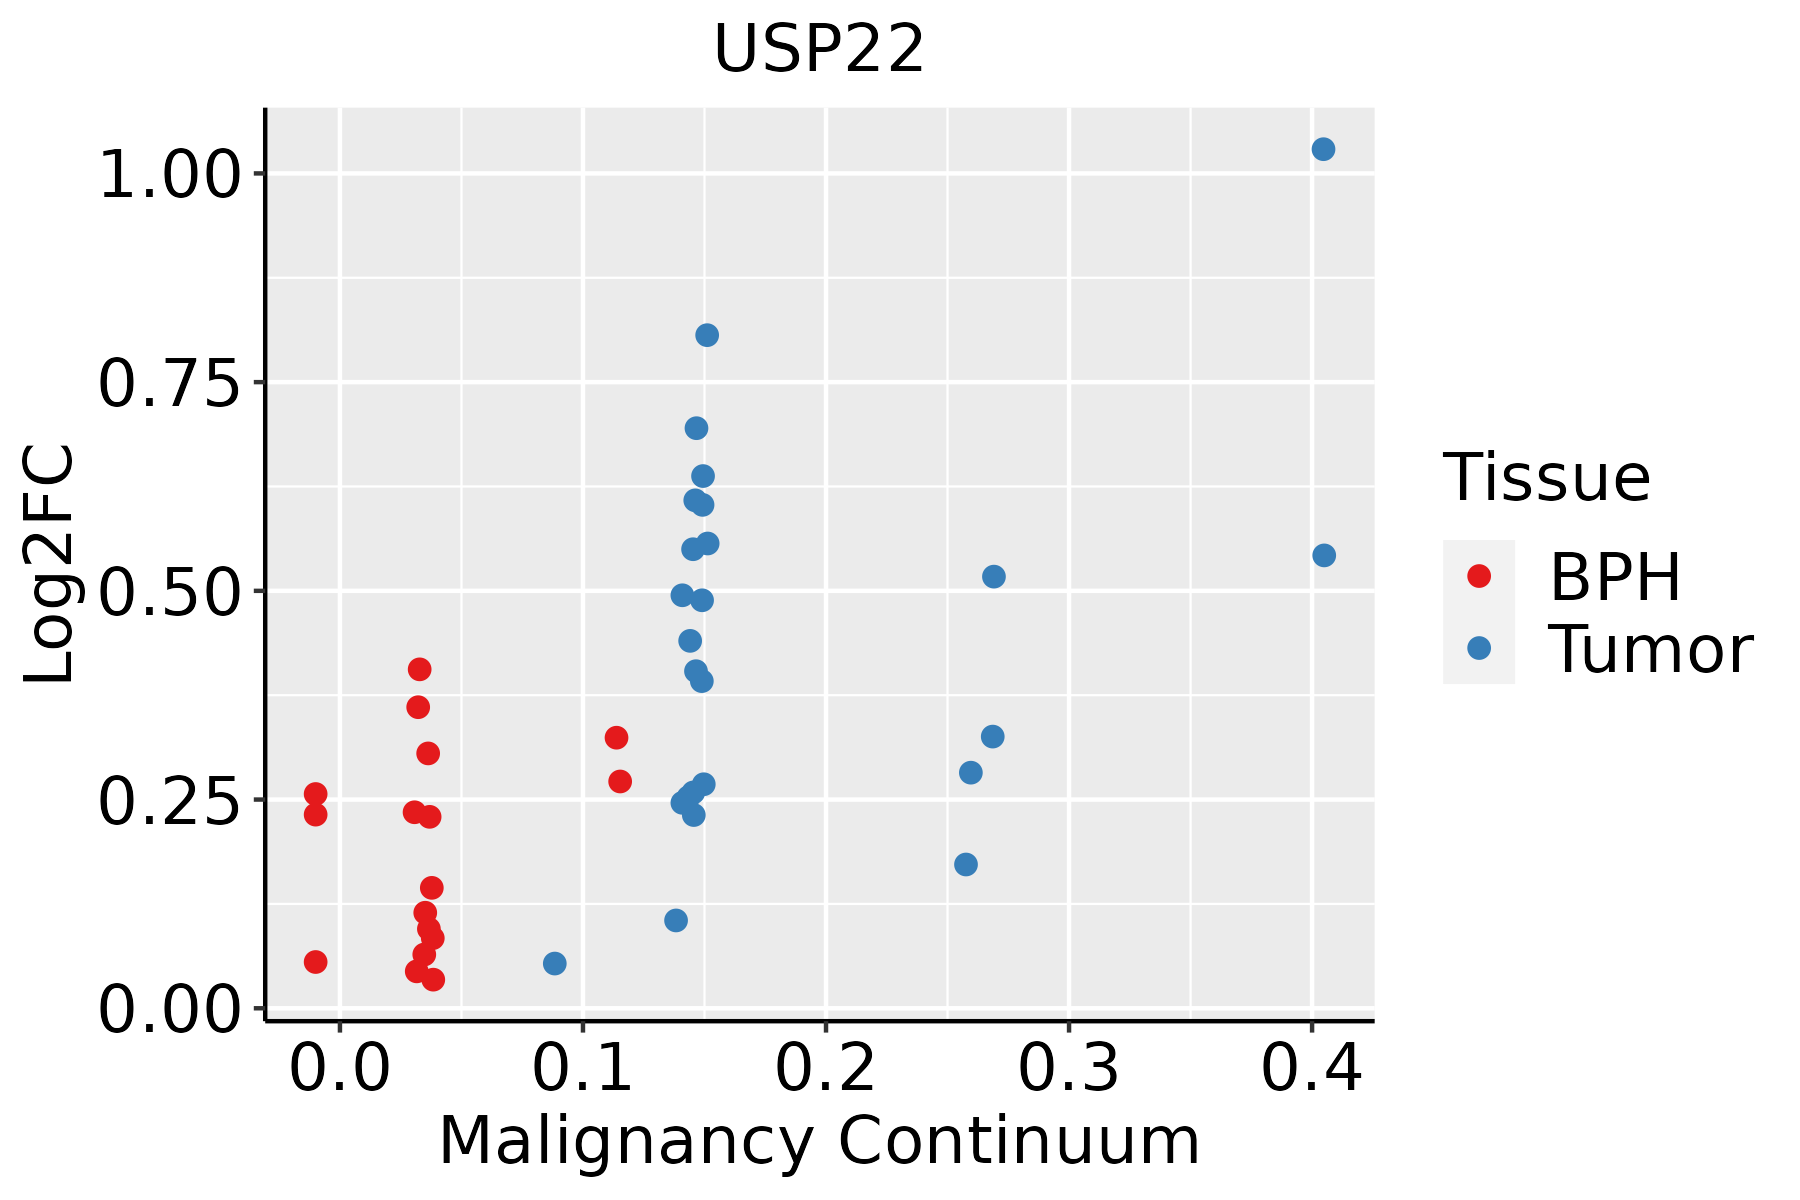
BPH: Benign Prostatic Hyperplasia
SkinThe image shows the transcriptomic changes along malignancy continuum.log2FC in expression of this searched gene in stem-like cells from each diseased tissue sample relative to stem-like cells in normal samples in each tissue plotted against the malignancy continuum. Samples are colored based on if they are from different disease stage.AK: Actinic keratosis
cSCC: Cutaneous squamous cell carcinoma
SCCIS:squamous cell carcinoma in situ
ThyroidThe image shows the transcriptomic changes along malignancy continuum.log2FC in expression of this searched gene in stem-like cells from each diseased tissue sample relative to stem-like cells in normal samples in each tissue plotted against the malignancy continuum. Samples are colored based on if they are from different disease stage.ATC: Anaplastic thyroid cancer
HT: Hashimoto's thyroiditis
PTC: Papillary thyroid cancer
∗log2FC in expression of this searched gene in stem-like cells from each diseased tissue sample relative to stem-like cells in normal samples in each tissue plotted against the malignancy continuum. Samples are colored based on if they are from different disease stage.

Top

Malignant transformation related pathway analysis

check buttonFind out the enriched GO biological processes and KEGG pathways involved in transition from healthy to precancer to cancer
check button Figure of enriched GO biological processes.
TissueDisease StageEnriched GO biological Processes
ColorectumADGO analysis - Figure of enriched GO biological processes: Top 15 enriched GO BP terms are showed in the bar plot of each disease state in each tissue. Each row represents a significant GO biological process which is colored according to the -log10(p.adjust).
ColorectumSERGO analysis - Figure of enriched GO biological processes: Top 15 enriched GO BP terms are showed in the bar plot of each disease state in each tissue. Each row represents a significant GO biological process which is colored according to the -log10(p.adjust).
ColorectumMSSGO analysis - Figure of enriched GO biological processes: Top 15 enriched GO BP terms are showed in the bar plot of each disease state in each tissue. Each row represents a significant GO biological process which is colored according to the -log10(p.adjust).
ColorectumMSI-HGO analysis - Figure of enriched GO biological processes: Top 15 enriched GO BP terms are showed in the bar plot of each disease state in each tissue. Each row represents a significant GO biological process which is colored according to the -log10(p.adjust).
ColorectumFAPGO analysis - Figure of enriched GO biological processes: Top 15 enriched GO BP terms are showed in the bar plot of each disease state in each tissue. Each row represents a significant GO biological process which is colored according to the -log10(p.adjust).
∗Top 15 enriched GO BP terms are showed in the bar plot of each disease state in each tissue. Each row represents a significant GO biological process which is colored according to the -log10(p.adjust).
Page: 1 2 3 4 5 6 7 8 9 

check button Enriched GO biological processes.
GO IDTissueDisease StageDescriptionGene RatioBg Ratiopvaluep.adjustCount
GO:00165701ColorectumFAPhistone modification94/2622463/187231.06e-041.76e-0394
GO:00457872ColorectumFAPpositive regulation of cell cycle66/2622313/187233.66e-044.63e-0366
GO:00073462ColorectumFAPregulation of mitotic cell cycle85/2622457/187233.41e-032.48e-0285
GO:00165741ColorectumFAPhistone ubiquitination14/262247/187233.95e-032.75e-0214
GO:00459311ColorectumFAPpositive regulation of mitotic cell cycle27/2622121/187238.64e-034.98e-0227
GO:00457873ColorectumCRCpositive regulation of cell cycle55/2078313/187233.76e-045.57e-0355
GO:00165702ColorectumCRChistone modification75/2078463/187234.95e-047.06e-0375
GO:00459312ColorectumCRCpositive regulation of mitotic cell cycle25/2078121/187231.54e-031.63e-0225
GO:00182057EsophagusHGINpeptidyl-lysine modification88/2587376/187232.99e-071.39e-0588
GO:000734610EsophagusHGINregulation of mitotic cell cycle98/2587457/187234.39e-061.42e-0498
GO:00165708EsophagusHGINhistone modification92/2587463/187231.70e-043.30e-0392
GO:00165747EsophagusHGINhistone ubiquitination16/258747/187233.61e-045.68e-0316
GO:00064735EsophagusHGINprotein acetylation45/2587201/187236.17e-048.58e-0345
GO:00183945EsophagusHGINpeptidyl-lysine acetylation39/2587169/187237.46e-049.90e-0339
GO:00435435EsophagusHGINprotein acylation51/2587243/187231.33e-031.57e-0251
GO:00439675EsophagusHGINhistone H4 acetylation19/258767/187231.39e-031.63e-0219
GO:00064755EsophagusHGINinternal protein amino acid acetylation36/2587160/187231.87e-032.01e-0236
GO:00183935EsophagusHGINinternal peptidyl-lysine acetylation35/2587158/187232.82e-032.75e-0235
GO:004593110EsophagusHGINpositive regulation of mitotic cell cycle28/2587121/187233.72e-033.39e-0228
GO:00706463EsophagusHGINprotein modification by small protein removal34/2587157/187234.68e-034.02e-0234
Page: 1 2 3 4 5 6 7 8 9 10 11 12 13 14 15 16 17 18 19 

check button Enriched KEGG pathways.
Pathway IDTissueDisease StageDescriptionGene RatioBg Ratiopvaluep.adjustqvalueCount
Page: 1 

Top

Cell-cell communication analysis

check buttonIdentification of potential cell-cell interactions between two cell types and their ligand-receptor pairs for different disease states
LigandReceptorLRpairPathwayTissueDisease Stage
Page: 1 

Top

Single-cell gene regulatory network inference analysis

check buttonFind out the significant the regulons (TFs) and the target genes of each regulon across cell types for different disease states
TFCell TypeTissueDisease StageTarget GeneRSSRegulon Activity
∗The dot plots of a searched regulon are shown for all cell subpopulations in each disease state of each tissue based on the regulon specific score inferred using pySCENIC and by calculating the average expression.
Page: 1 

Top

Somatic mutation of malignant transformation related genes

check buttonAnnotation of somatic variants for genes involved in malignant transformation
Hugo SymbolVariant ClassVariant ClassificationdbSNP RSHGVScHGVSpHGVSp ShortSWISSPROTBIOTYPESIFTPolyPhenTumor Sample BarcodeTissueHistologySexAgeStageTherapy TypesDrugsOutcome
USP22SNVMissense_Mutationnovelc.799N>Gp.Leu267Valp.L267VQ9UPT9protein_codingdeleterious(0.01)possibly_damaging(0.871)TCGA-A2-A0CP-01Breastbreast invasive carcinomaFemale<65I/IIChemotherapycytoxanSD
USP22SNVMissense_Mutationnovelc.1378G>Ap.Asp460Asnp.D460NQ9UPT9protein_codingtolerated(0.07)benign(0.142)TCGA-A8-A081-01Breastbreast invasive carcinomaFemale>=65I/IIUnknownUnknownSD
USP22SNVMissense_Mutationc.734T>Cp.Leu245Prop.L245PQ9UPT9protein_codingdeleterious(0)probably_damaging(1)TCGA-D8-A1XK-01Breastbreast invasive carcinomaFemale<65I/IIChemotherapydoxorubicine+cyclophosphamideSD
USP22insertionNonsense_Mutationnovelc.578_579insATAGTTGTGTAACTGCTGCTACTCAAGATGAAGAACTGTTAp.Leu194Terp.L194*Q9UPT9protein_codingTCGA-A8-A095-01Breastbreast invasive carcinomaFemale<65I/IIChemotherapy5-fluorouracilCR
USP22insertionNonsense_Mutationnovelc.427_428insGCTGGGAATGAATGACTTGAGCCAAGATCGGCTCCTGp.Glu143GlyfsTer4p.E143Gfs*4Q9UPT9protein_codingTCGA-BH-A0HL-01Breastbreast invasive carcinomaFemale<65I/IIChemotherapycyclophosphamideSD
USP22SNVMissense_Mutationnovelc.953N>Gp.Ser318Cysp.S318CQ9UPT9protein_codingdeleterious(0)probably_damaging(0.995)TCGA-VS-A958-01Cervixcervical & endocervical cancerFemale<65I/IIChemotherapycisplatinCR
USP22SNVMissense_Mutationnovelc.805G>Ap.Ala269Thrp.A269TQ9UPT9protein_codingdeleterious(0.02)probably_damaging(0.982)TCGA-AA-3949-01Colorectumcolon adenocarcinomaFemale>=65III/IVUnknownUnknownSD
USP22SNVMissense_Mutationrs770592022c.202G>Ap.Val68Ilep.V68IQ9UPT9protein_codingtolerated(0.06)benign(0.013)TCGA-AA-A01R-01Colorectumcolon adenocarcinomaMale<65III/IVChemotherapy5-fluorouracilPD
USP22SNVMissense_Mutationc.628N>Tp.Arg210Cysp.R210CQ9UPT9protein_codingtolerated(0.08)benign(0.022)TCGA-AD-5900-01Colorectumcolon adenocarcinomaMale>=65I/IIUnknownUnknownSD
USP22SNVMissense_Mutationnovelc.429N>Tp.Glu143Aspp.E143DQ9UPT9protein_codingtolerated(0.25)benign(0.001)TCGA-CA-6717-01Colorectumcolon adenocarcinomaMale<65I/IIChemotherapyoxaliplatinCR
Page: 1 2 3 4 5 6 7 

Top

Related drugs of malignant transformation related genes

check buttonIdentification of chemicals and drugs interact with genes involved in malignant transfromation
(DGIdb 4.0)
Entrez IDSymbolCategoryInteraction TypesDrug Claim NameDrug NamePMIDs
Page: 1