
|
|||||
|
 | |
| |
| |
| |
| |
| |
|
Gene: USP21 |
Gene summary for USP21 |
| Gene information | Species | Human | Gene symbol | USP21 | Gene ID | 27005 |
| Gene name | ubiquitin specific peptidase 21 | |
| Gene Alias | USP16 | |
| Cytomap | 1q23.3 | |
| Gene Type | protein-coding | GO ID | GO:0006139 | UniProtAcc | Q9UK80 |
Top |
Malignant transformation analysis |
| Identification of the aberrant gene expression in precancerous and cancerous lesions by comparing the gene expression of stem-like cells in diseased tissues with normal stem cells |
| Entrez ID | Symbol | Replicates | Species | Organ | Tissue | Adj P-value | Log2FC | Malignancy |
| 27005 | USP21 | LZE7T | Human | Esophagus | ESCC | 2.07e-09 | 3.62e-01 | 0.0667 |
| 27005 | USP21 | LZE8T | Human | Esophagus | ESCC | 6.71e-04 | 1.08e-01 | 0.067 |
| 27005 | USP21 | LZE20T | Human | Esophagus | ESCC | 4.98e-02 | 7.09e-02 | 0.0662 |
| 27005 | USP21 | LZE22D1 | Human | Esophagus | HGIN | 5.14e-03 | 1.82e-01 | 0.0595 |
| 27005 | USP21 | LZE22T | Human | Esophagus | ESCC | 1.48e-05 | 3.52e-01 | 0.068 |
| 27005 | USP21 | LZE24T | Human | Esophagus | ESCC | 6.88e-12 | 2.55e-01 | 0.0596 |
| 27005 | USP21 | LZE21T | Human | Esophagus | ESCC | 6.52e-03 | 1.70e-01 | 0.0655 |
| 27005 | USP21 | LZE6T | Human | Esophagus | ESCC | 2.96e-03 | 1.67e-01 | 0.0845 |
| 27005 | USP21 | P1T-E | Human | Esophagus | ESCC | 5.20e-08 | 2.76e-01 | 0.0875 |
| 27005 | USP21 | P2T-E | Human | Esophagus | ESCC | 3.39e-32 | 4.55e-01 | 0.1177 |
| 27005 | USP21 | P4T-E | Human | Esophagus | ESCC | 4.13e-17 | 3.50e-01 | 0.1323 |
| 27005 | USP21 | P5T-E | Human | Esophagus | ESCC | 5.95e-16 | 1.54e-01 | 0.1327 |
| 27005 | USP21 | P8T-E | Human | Esophagus | ESCC | 2.76e-21 | 1.87e-01 | 0.0889 |
| 27005 | USP21 | P9T-E | Human | Esophagus | ESCC | 1.34e-08 | 1.78e-01 | 0.1131 |
| 27005 | USP21 | P10T-E | Human | Esophagus | ESCC | 4.31e-24 | 2.82e-01 | 0.116 |
| 27005 | USP21 | P11T-E | Human | Esophagus | ESCC | 6.27e-12 | 3.91e-01 | 0.1426 |
| 27005 | USP21 | P12T-E | Human | Esophagus | ESCC | 2.17e-25 | 1.72e-01 | 0.1122 |
| 27005 | USP21 | P15T-E | Human | Esophagus | ESCC | 2.65e-19 | 3.59e-01 | 0.1149 |
| 27005 | USP21 | P16T-E | Human | Esophagus | ESCC | 3.56e-26 | 4.48e-01 | 0.1153 |
| 27005 | USP21 | P17T-E | Human | Esophagus | ESCC | 2.68e-03 | 1.21e-01 | 0.1278 |
| Page: 1 2 3 4 |
| Tissue | Expression Dynamics | Abbreviation |
| Esophagus | 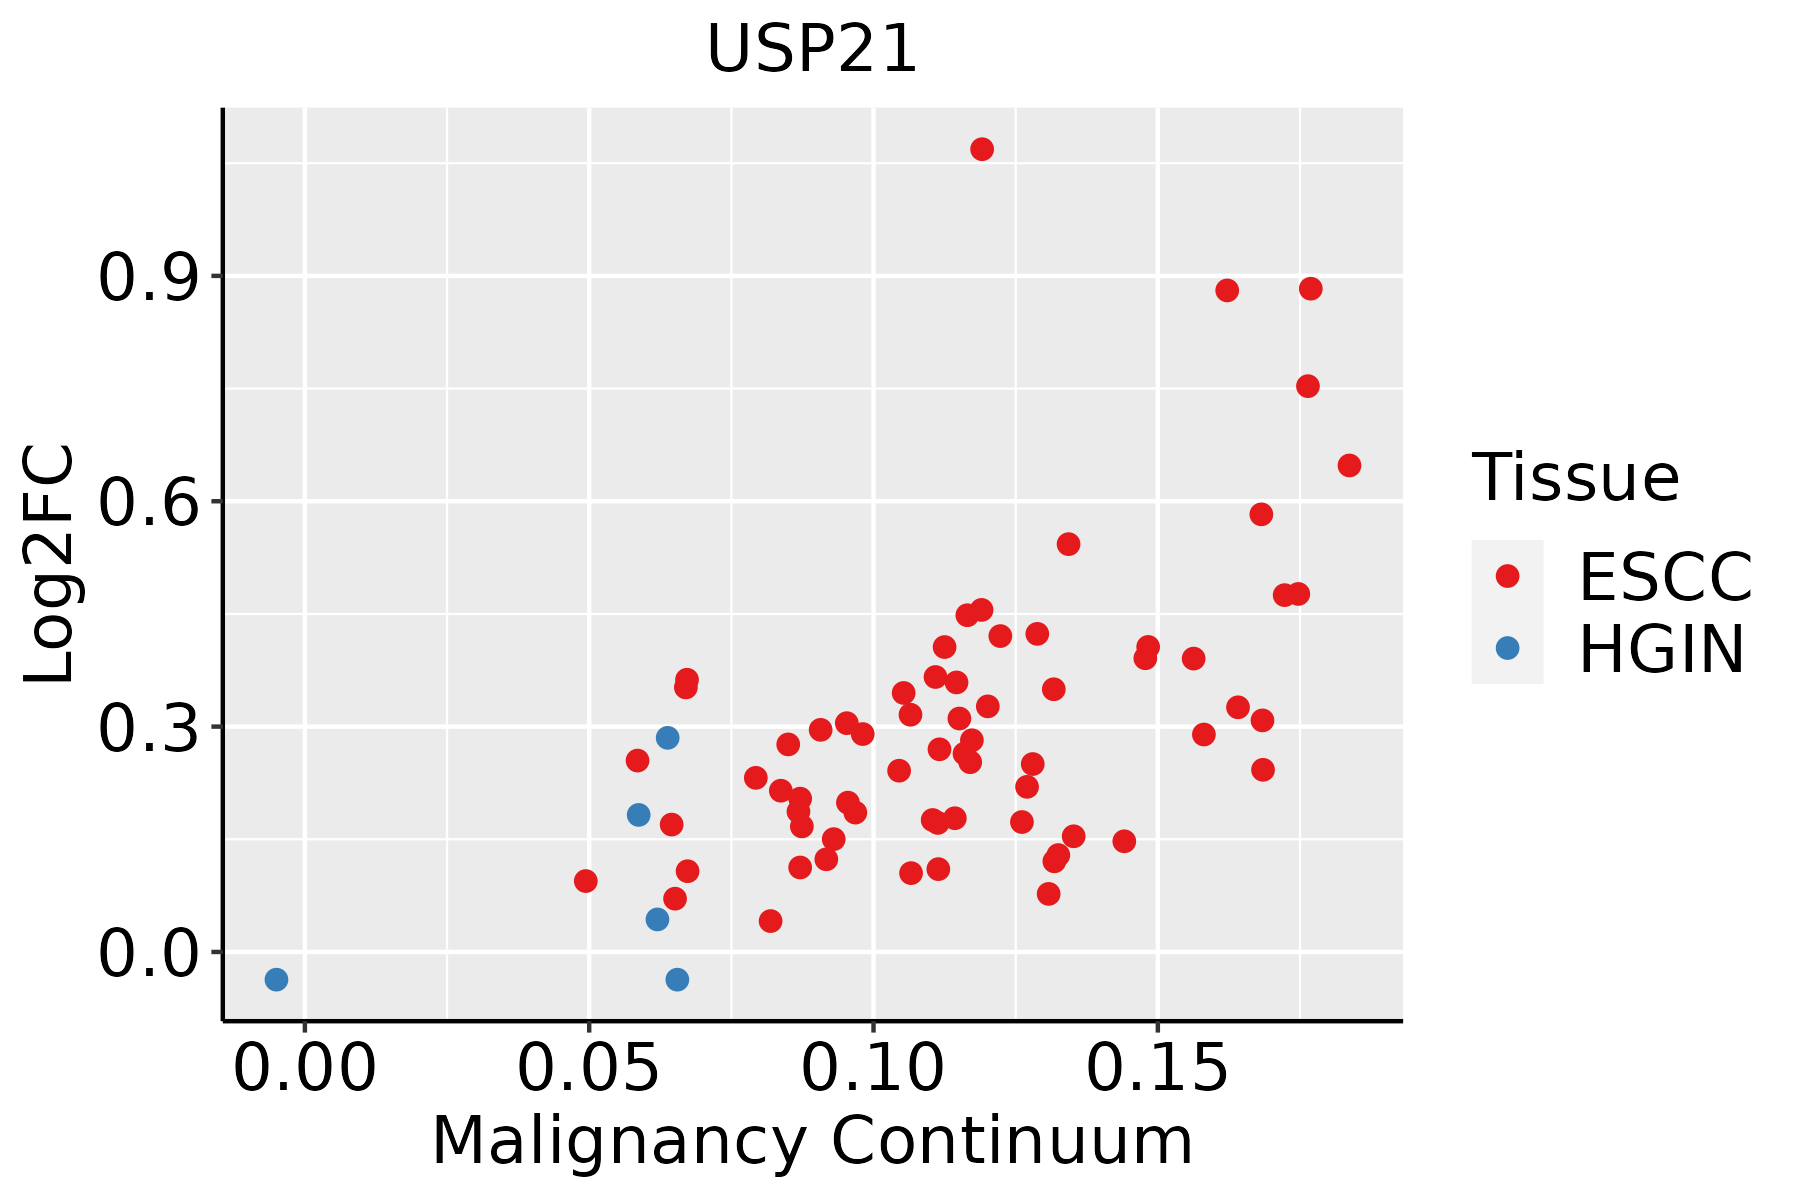 | ESCC: Esophageal squamous cell carcinoma |
| HGIN: High-grade intraepithelial neoplasias | ||
| LGIN: Low-grade intraepithelial neoplasias |
| ∗log2FC in expression of this searched gene in stem-like cells from each diseased tissue sample relative to stem-like cells in normal samples in each tissue plotted against the malignancy continuum. Samples are colored based on if they are from different disease stage. |
Top |
Malignant transformation related pathway analysis |
| Find out the enriched GO biological processes and KEGG pathways involved in transition from healthy to precancer to cancer |
| Tissue | Disease Stage | Enriched GO biological Processes |
| Colorectum | AD |  |
| Colorectum | SER |  |
| Colorectum | MSS |  |
| Colorectum | MSI-H |  |
| Colorectum | FAP |  |
| ∗Top 15 enriched GO BP terms are showed in the bar plot of each disease state in each tissue. Each row represents a significant GO biological process which is colored according to the -log10(p.adjust). |
| Page: 1 2 3 4 5 6 7 8 9 |
| GO ID | Tissue | Disease Stage | Description | Gene Ratio | Bg Ratio | pvalue | p.adjust | Count |
| GO:00165708 | Esophagus | HGIN | histone modification | 92/2587 | 463/18723 | 1.70e-04 | 3.30e-03 | 92 |
| GO:00706463 | Esophagus | HGIN | protein modification by small protein removal | 34/2587 | 157/18723 | 4.68e-03 | 4.02e-02 | 34 |
| GO:001657015 | Esophagus | ESCC | histone modification | 323/8552 | 463/18723 | 2.61e-26 | 7.88e-24 | 323 |
| GO:007064612 | Esophagus | ESCC | protein modification by small protein removal | 95/8552 | 157/18723 | 1.25e-04 | 8.56e-04 | 95 |
| GO:00165783 | Esophagus | ESCC | histone deubiquitination | 18/8552 | 23/18723 | 1.50e-03 | 7.06e-03 | 18 |
| GO:00165793 | Esophagus | ESCC | protein deubiquitination | 79/8552 | 139/18723 | 5.23e-03 | 1.97e-02 | 79 |
| Page: 1 |
| Pathway ID | Tissue | Disease Stage | Description | Gene Ratio | Bg Ratio | pvalue | p.adjust | qvalue | Count |
| Page: 1 |
Top |
Cell-cell communication analysis |
| Identification of potential cell-cell interactions between two cell types and their ligand-receptor pairs for different disease states |
| Ligand | Receptor | LRpair | Pathway | Tissue | Disease Stage |
| Page: 1 |
Top |
Single-cell gene regulatory network inference analysis |
| Find out the significant the regulons (TFs) and the target genes of each regulon across cell types for different disease states |
| TF | Cell Type | Tissue | Disease Stage | Target Gene | RSS | Regulon Activity |
| ∗The dot plots of a searched regulon are shown for all cell subpopulations in each disease state of each tissue based on the regulon specific score inferred using pySCENIC and by calculating the average expression. |
| Page: 1 |
Top |
Somatic mutation of malignant transformation related genes |
| Annotation of somatic variants for genes involved in malignant transformation |
| Hugo Symbol | Variant Class | Variant Classification | dbSNP RS | HGVSc | HGVSp | HGVSp Short | SWISSPROT | BIOTYPE | SIFT | PolyPhen | Tumor Sample Barcode | Tissue | Histology | Sex | Age | Stage | Therapy Types | Drugs | Outcome |
| USP21 | SNV | Missense_Mutation | c.1054G>T | p.Asp352Tyr | p.D352Y | Q9UK80 | protein_coding | deleterious(0) | possibly_damaging(0.583) | TCGA-AN-A0FV-01 | Breast | breast invasive carcinoma | Female | <65 | I/II | Unknown | Unknown | SD | |
| USP21 | SNV | Missense_Mutation | novel | c.181G>C | p.Glu61Gln | p.E61Q | Q9UK80 | protein_coding | deleterious_low_confidence(0.01) | benign(0.102) | TCGA-BH-A0DP-01 | Breast | breast invasive carcinoma | Female | <65 | I/II | Hormone Therapy | arimidex | SD |
| USP21 | SNV | Missense_Mutation | c.790N>C | p.Asp264His | p.D264H | Q9UK80 | protein_coding | deleterious(0) | probably_damaging(0.968) | TCGA-D8-A27G-01 | Breast | breast invasive carcinoma | Female | >=65 | I/II | Unknown | Unknown | SD | |
| USP21 | deletion | Frame_Shift_Del | novel | c.214_286delNNNNNNNNNNNNNNNNNNNNNNNNNNNNNNNNNNNNNNNNNNNNNNNNNNNNNNNNNNNNNNNNNNNNNNNNN | p.Arg72GlnfsTer13 | p.R72Qfs*13 | Q9UK80 | protein_coding | TCGA-AC-A8OP-01 | Breast | breast invasive carcinoma | Female | >=65 | I/II | Unknown | Unknown | SD | ||
| USP21 | insertion | Frame_Shift_Ins | novel | c.536_537insGGGAGGGGTCGGGAGTATAGAAAGGGTCAAAG | p.His180GlyfsTer17 | p.H180Gfs*17 | Q9UK80 | protein_coding | TCGA-AN-A0FW-01 | Breast | breast invasive carcinoma | Female | >=65 | III/IV | Unknown | Unknown | SD | ||
| USP21 | insertion | Nonsense_Mutation | novel | c.182_183insCATCCTACTTTACTAGCCGGGTATGGGGTCCC | p.Glu61AspfsTer6 | p.E61Dfs*6 | Q9UK80 | protein_coding | TCGA-BH-A0DP-01 | Breast | breast invasive carcinoma | Female | <65 | I/II | Hormone Therapy | arimidex | SD | ||
| USP21 | SNV | Missense_Mutation | c.1057N>A | p.Asp353Asn | p.D353N | Q9UK80 | protein_coding | deleterious(0.01) | benign(0.093) | TCGA-DR-A0ZM-01 | Cervix | cervical & endocervical cancer | Female | <65 | III/IV | Unspecific | Cisplatin | SD | |
| USP21 | SNV | Missense_Mutation | rs760197993 | c.565N>T | p.Arg189Trp | p.R189W | Q9UK80 | protein_coding | deleterious_low_confidence(0) | benign(0) | TCGA-EA-A3HS-01 | Cervix | cervical & endocervical cancer | Female | <65 | I/II | Unknown | Unknown | SD |
| USP21 | SNV | Missense_Mutation | c.1381N>T | p.Leu461Phe | p.L461F | Q9UK80 | protein_coding | deleterious(0) | probably_damaging(0.966) | TCGA-EK-A2RO-01 | Cervix | cervical & endocervical cancer | Female | <65 | I/II | Unknown | Unknown | SD | |
| USP21 | SNV | Missense_Mutation | novel | c.555G>A | p.Met185Ile | p.M185I | Q9UK80 | protein_coding | tolerated_low_confidence(0.17) | benign(0) | TCGA-ZX-AA5X-01 | Cervix | cervical & endocervical cancer | Female | <65 | III/IV | Unknown | Unknown | SD |
| Page: 1 2 3 4 5 6 7 8 |
Top |
Related drugs of malignant transformation related genes |
| Identification of chemicals and drugs interact with genes involved in malignant transfromation |
| (DGIdb 4.0) |
| Entrez ID | Symbol | Category | Interaction Types | Drug Claim Name | Drug Name | PMIDs |
| Page: 1 |

Copyright 2023-Present -The University of Texas Health Science Center at Houston |