
|
|||||
|
 | |
| |
| |
| |
| |
| |
|
Gene: USP2 |
Gene summary for USP2 |
| Gene information | Species | Human | Gene symbol | USP2 | Gene ID | 9099 |
| Gene name | ubiquitin specific peptidase 2 | |
| Gene Alias | UBP41 | |
| Cytomap | 11q23.3 | |
| Gene Type | protein-coding | GO ID | GO:0000122 | UniProtAcc | O75604 |
Top |
Malignant transformation analysis |
| Identification of the aberrant gene expression in precancerous and cancerous lesions by comparing the gene expression of stem-like cells in diseased tissues with normal stem cells |
| Entrez ID | Symbol | Replicates | Species | Organ | Tissue | Adj P-value | Log2FC | Malignancy |
| 9099 | USP2 | HTA11_347_2000001011 | Human | Colorectum | AD | 4.38e-02 | 1.18e-01 | -0.1954 |
| 9099 | USP2 | HTA11_696_2000001011 | Human | Colorectum | AD | 5.33e-06 | 2.05e-01 | -0.1464 |
| Page: 1 |
| Tissue | Expression Dynamics | Abbreviation |
| Colorectum (GSE201348) |  | FAP: Familial adenomatous polyposis |
| CRC: Colorectal cancer | ||
| Colorectum (HTA11) | 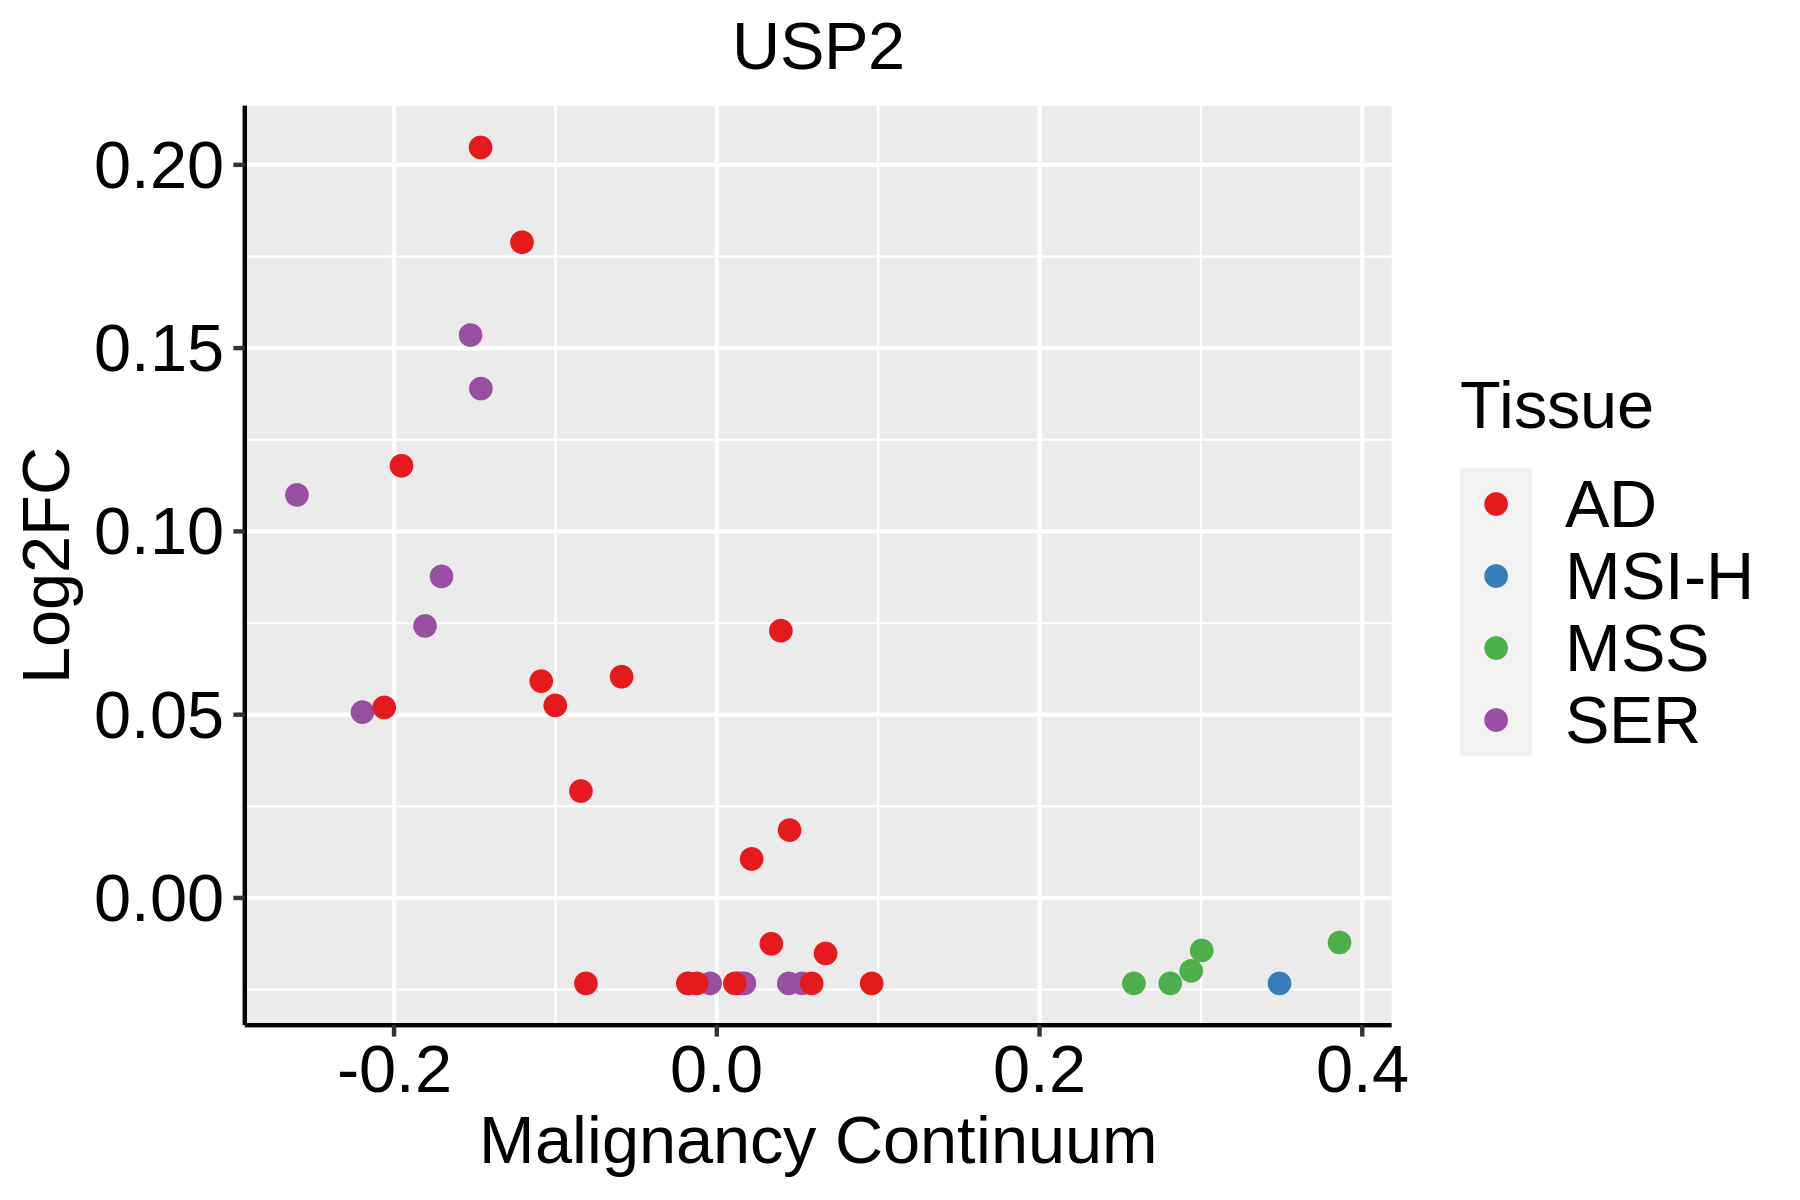 | AD: Adenomas |
| SER: Sessile serrated lesions | ||
| MSI-H: Microsatellite-high colorectal cancer | ||
| MSS: Microsatellite stable colorectal cancer |
| ∗log2FC in expression of this searched gene in stem-like cells from each diseased tissue sample relative to stem-like cells in normal samples in each tissue plotted against the malignancy continuum. Samples are colored based on if they are from different disease stage. |
Top |
Malignant transformation related pathway analysis |
| Find out the enriched GO biological processes and KEGG pathways involved in transition from healthy to precancer to cancer |
| Tissue | Disease Stage | Enriched GO biological Processes |
| Colorectum | AD |  |
| Colorectum | SER |  |
| Colorectum | MSS |  |
| Colorectum | MSI-H |  |
| Colorectum | FAP |  |
| ∗Top 15 enriched GO BP terms are showed in the bar plot of each disease state in each tissue. Each row represents a significant GO biological process which is colored according to the -log10(p.adjust). |
| Page: 1 2 3 4 5 6 7 8 9 |
| GO ID | Tissue | Disease Stage | Description | Gene Ratio | Bg Ratio | pvalue | p.adjust | Count |
| GO:004217610 | Cervix | CC | regulation of protein catabolic process | 104/2311 | 391/18723 | 9.39e-15 | 9.36e-12 | 104 |
| GO:190336210 | Cervix | CC | regulation of cellular protein catabolic process | 72/2311 | 255/18723 | 5.98e-12 | 2.10e-09 | 72 |
| GO:001049810 | Cervix | CC | proteasomal protein catabolic process | 111/2311 | 490/18723 | 8.98e-11 | 1.58e-08 | 111 |
| GO:190305010 | Cervix | CC | regulation of proteolysis involved in cellular protein catabolic process | 60/2311 | 221/18723 | 1.82e-09 | 1.98e-07 | 60 |
| GO:004586110 | Cervix | CC | negative regulation of proteolysis | 80/2311 | 351/18723 | 2.88e-08 | 1.98e-06 | 80 |
| GO:003133010 | Cervix | CC | negative regulation of cellular catabolic process | 63/2311 | 262/18723 | 1.10e-07 | 5.68e-06 | 63 |
| GO:006113610 | Cervix | CC | regulation of proteasomal protein catabolic process | 48/2311 | 187/18723 | 4.63e-07 | 1.77e-05 | 48 |
| GO:190589710 | Cervix | CC | regulation of response to endoplasmic reticulum stress | 27/2311 | 82/18723 | 9.24e-07 | 3.25e-05 | 27 |
| GO:000989510 | Cervix | CC | negative regulation of catabolic process | 69/2311 | 320/18723 | 2.15e-06 | 6.55e-05 | 69 |
| GO:003497610 | Cervix | CC | response to endoplasmic reticulum stress | 57/2311 | 256/18723 | 5.81e-06 | 1.42e-04 | 57 |
| GO:19033639 | Cervix | CC | negative regulation of cellular protein catabolic process | 24/2311 | 75/18723 | 6.43e-06 | 1.55e-04 | 24 |
| GO:190357310 | Cervix | CC | negative regulation of response to endoplasmic reticulum stress | 17/2311 | 44/18723 | 8.57e-06 | 1.97e-04 | 17 |
| GO:19030519 | Cervix | CC | negative regulation of proteolysis involved in cellular protein catabolic process | 20/2311 | 64/18723 | 5.44e-05 | 8.04e-04 | 20 |
| GO:00073695 | Cervix | CC | gastrulation | 42/2311 | 185/18723 | 5.83e-05 | 8.46e-04 | 42 |
| GO:004217710 | Cervix | CC | negative regulation of protein catabolic process | 30/2311 | 121/18723 | 1.23e-04 | 1.53e-03 | 30 |
| GO:00074923 | Cervix | CC | endoderm development | 20/2311 | 77/18723 | 8.40e-04 | 7.30e-03 | 20 |
| GO:00434099 | Cervix | CC | negative regulation of MAPK cascade | 37/2311 | 180/18723 | 1.17e-03 | 9.50e-03 | 37 |
| GO:0001704 | Cervix | CC | formation of primary germ layer | 27/2311 | 121/18723 | 1.49e-03 | 1.16e-02 | 27 |
| GO:19017995 | Cervix | CC | negative regulation of proteasomal protein catabolic process | 13/2311 | 49/18723 | 5.34e-03 | 3.10e-02 | 13 |
| GO:00711083 | Cervix | CC | protein K48-linked deubiquitination | 10/2311 | 35/18723 | 7.99e-03 | 4.18e-02 | 10 |
| Page: 1 2 3 4 5 6 7 8 9 10 11 12 13 14 15 16 17 18 19 20 21 22 23 24 25 26 27 28 29 30 31 32 33 34 |
| Pathway ID | Tissue | Disease Stage | Description | Gene Ratio | Bg Ratio | pvalue | p.adjust | qvalue | Count |
| Page: 1 |
Top |
Cell-cell communication analysis |
| Identification of potential cell-cell interactions between two cell types and their ligand-receptor pairs for different disease states |
| Ligand | Receptor | LRpair | Pathway | Tissue | Disease Stage |
| Page: 1 |
Top |
Single-cell gene regulatory network inference analysis |
| Find out the significant the regulons (TFs) and the target genes of each regulon across cell types for different disease states |
| TF | Cell Type | Tissue | Disease Stage | Target Gene | RSS | Regulon Activity |
| ∗The dot plots of a searched regulon are shown for all cell subpopulations in each disease state of each tissue based on the regulon specific score inferred using pySCENIC and by calculating the average expression. |
| Page: 1 |
Top |
Somatic mutation of malignant transformation related genes |
| Annotation of somatic variants for genes involved in malignant transformation |
| Hugo Symbol | Variant Class | Variant Classification | dbSNP RS | HGVSc | HGVSp | HGVSp Short | SWISSPROT | BIOTYPE | SIFT | PolyPhen | Tumor Sample Barcode | Tissue | Histology | Sex | Age | Stage | Therapy Types | Drugs | Outcome |
| USP2 | SNV | Missense_Mutation | rs369164717 | c.1216N>T | p.Arg406Trp | p.R406W | O75604 | protein_coding | deleterious(0) | probably_damaging(0.995) | TCGA-AN-A0G0-01 | Breast | breast invasive carcinoma | Female | <65 | I/II | Unknown | Unknown | SD |
| USP2 | SNV | Missense_Mutation | novel | c.1354N>A | p.Glu452Lys | p.E452K | O75604 | protein_coding | tolerated(0.18) | benign(0.058) | TCGA-PE-A5DE-01 | Breast | breast invasive carcinoma | Female | <65 | I/II | Chemotherapy | taxotere | CR |
| USP2 | SNV | Missense_Mutation | novel | c.1743G>A | p.Met581Ile | p.M581I | O75604 | protein_coding | tolerated(0.36) | benign(0.034) | TCGA-C5-A8XJ-01 | Cervix | cervical & endocervical cancer | Female | >=65 | I/II | Chemotherapy | cisplatin | SD |
| USP2 | SNV | Missense_Mutation | rs756703374 | c.1688N>A | p.Arg563His | p.R563H | O75604 | protein_coding | deleterious(0) | possibly_damaging(0.665) | TCGA-A6-2672-01 | Colorectum | colon adenocarcinoma | Female | >=65 | III/IV | Unknown | Unknown | SD |
| USP2 | SNV | Missense_Mutation | rs748109847 | c.1498C>T | p.Leu500Phe | p.L500F | O75604 | protein_coding | deleterious(0) | benign(0.424) | TCGA-A6-6141-01 | Colorectum | colon adenocarcinoma | Male | <65 | I/II | Chemotherapy | 5-fu | SD |
| USP2 | SNV | Missense_Mutation | novel | c.728N>G | p.Gln243Arg | p.Q243R | O75604 | protein_coding | tolerated(0.51) | benign(0.107) | TCGA-AA-3663-01 | Colorectum | colon adenocarcinoma | Male | <65 | I/II | Unknown | Unknown | SD |
| USP2 | SNV | Missense_Mutation | rs373153803 | c.524N>T | p.Thr175Met | p.T175M | O75604 | protein_coding | deleterious_low_confidence(0.03) | possibly_damaging(0.813) | TCGA-AA-3950-01 | Colorectum | colon adenocarcinoma | Female | >=65 | I/II | Unknown | Unknown | SD |
| USP2 | SNV | Missense_Mutation | rs369895568 | c.704N>T | p.Thr235Met | p.T235M | O75604 | protein_coding | tolerated(0.11) | benign(0.003) | TCGA-AA-3972-01 | Colorectum | colon adenocarcinoma | Male | >=65 | III/IV | Chemotherapy | capecitabine | PD |
| USP2 | SNV | Missense_Mutation | c.287C>T | p.Thr96Ile | p.T96I | O75604 | protein_coding | tolerated_low_confidence(0.23) | benign(0.282) | TCGA-AA-A00N-01 | Colorectum | colon adenocarcinoma | Male | >=65 | I/II | Unknown | Unknown | PD | |
| USP2 | SNV | Missense_Mutation | c.626N>A | p.Ser209Tyr | p.S209Y | O75604 | protein_coding | deleterious_low_confidence(0.03) | benign(0.058) | TCGA-AY-6197-01 | Colorectum | colon adenocarcinoma | Male | <65 | I/II | Unknown | Unknown | SD |
| Page: 1 2 3 4 5 6 7 |
Top |
Related drugs of malignant transformation related genes |
| Identification of chemicals and drugs interact with genes involved in malignant transfromation |
| (DGIdb 4.0) |
| Entrez ID | Symbol | Category | Interaction Types | Drug Claim Name | Drug Name | PMIDs |
| 9099 | USP2 | DRUGGABLE GENOME, ENZYME, TRANSCRIPTION FACTOR, PROTEASE | QUINALIZARIN | QUINALIZARIN | ||
| 9099 | USP2 | DRUGGABLE GENOME, ENZYME, TRANSCRIPTION FACTOR, PROTEASE | THONZONIUM BROMIDE | THONZONIUM BROMIDE | ||
| 9099 | USP2 | DRUGGABLE GENOME, ENZYME, TRANSCRIPTION FACTOR, PROTEASE | DEPHOSTATIN | DEPHOSTATIN | ||
| 9099 | USP2 | DRUGGABLE GENOME, ENZYME, TRANSCRIPTION FACTOR, PROTEASE | SURAMIN | SURAMIN | ||
| 9099 | USP2 | DRUGGABLE GENOME, ENZYME, TRANSCRIPTION FACTOR, PROTEASE | CALMIDAZOLIUM CHLORIDE | CALMIDAZOLIUM CHLORIDE | ||
| 9099 | USP2 | DRUGGABLE GENOME, ENZYME, TRANSCRIPTION FACTOR, PROTEASE | ZAPRINAST | ZAPRINAST | ||
| 9099 | USP2 | DRUGGABLE GENOME, ENZYME, TRANSCRIPTION FACTOR, PROTEASE | GNF-PF-254 | CHEMBL461579 | ||
| 9099 | USP2 | DRUGGABLE GENOME, ENZYME, TRANSCRIPTION FACTOR, PROTEASE | JUGLONE | JUGLONE | ||
| 9099 | USP2 | DRUGGABLE GENOME, ENZYME, TRANSCRIPTION FACTOR, PROTEASE | SENNOSIDE B | SENNOSIDE B | ||
| 9099 | USP2 | DRUGGABLE GENOME, ENZYME, TRANSCRIPTION FACTOR, PROTEASE | ELLAGIC ACID | ELLAGIC ACID |
| Page: 1 2 3 |

Copyright 2023-Present -The University of Texas Health Science Center at Houston |