
|
|||||
|
 | |
| |
| |
| |
| |
| |
|
Gene: USP18 |
Gene summary for USP18 |
| Gene information | Species | Human | Gene symbol | USP18 | Gene ID | 11274 |
| Gene name | ubiquitin specific peptidase 18 | |
| Gene Alias | ISG43 | |
| Cytomap | 22q11.21 | |
| Gene Type | protein-coding | GO ID | GO:0001959 | UniProtAcc | Q9UMW8 |
Top |
Malignant transformation analysis |
| Identification of the aberrant gene expression in precancerous and cancerous lesions by comparing the gene expression of stem-like cells in diseased tissues with normal stem cells |
| Entrez ID | Symbol | Replicates | Species | Organ | Tissue | Adj P-value | Log2FC | Malignancy |
| 11274 | USP18 | LZE24T | Human | Esophagus | ESCC | 5.01e-24 | 5.61e-01 | 0.0596 |
| 11274 | USP18 | P2T-E | Human | Esophagus | ESCC | 5.95e-29 | 6.14e-01 | 0.1177 |
| 11274 | USP18 | P4T-E | Human | Esophagus | ESCC | 3.48e-08 | 2.09e-01 | 0.1323 |
| 11274 | USP18 | P5T-E | Human | Esophagus | ESCC | 1.88e-11 | 2.88e-01 | 0.1327 |
| 11274 | USP18 | P8T-E | Human | Esophagus | ESCC | 1.62e-13 | 2.32e-01 | 0.0889 |
| 11274 | USP18 | P9T-E | Human | Esophagus | ESCC | 1.75e-19 | 4.19e-01 | 0.1131 |
| 11274 | USP18 | P10T-E | Human | Esophagus | ESCC | 3.97e-04 | 1.03e-01 | 0.116 |
| 11274 | USP18 | P11T-E | Human | Esophagus | ESCC | 2.96e-18 | 6.41e-01 | 0.1426 |
| 11274 | USP18 | P12T-E | Human | Esophagus | ESCC | 1.96e-05 | 1.67e-01 | 0.1122 |
| 11274 | USP18 | P15T-E | Human | Esophagus | ESCC | 3.26e-02 | 9.31e-02 | 0.1149 |
| 11274 | USP18 | P16T-E | Human | Esophagus | ESCC | 8.84e-05 | 9.88e-02 | 0.1153 |
| 11274 | USP18 | P17T-E | Human | Esophagus | ESCC | 7.64e-08 | 2.84e-01 | 0.1278 |
| 11274 | USP18 | P20T-E | Human | Esophagus | ESCC | 2.18e-03 | 1.21e-01 | 0.1124 |
| 11274 | USP18 | P21T-E | Human | Esophagus | ESCC | 2.02e-06 | 1.97e-01 | 0.1617 |
| 11274 | USP18 | P22T-E | Human | Esophagus | ESCC | 1.66e-02 | 8.94e-02 | 0.1236 |
| 11274 | USP18 | P23T-E | Human | Esophagus | ESCC | 2.37e-12 | 3.10e-01 | 0.108 |
| 11274 | USP18 | P24T-E | Human | Esophagus | ESCC | 7.31e-14 | 3.35e-01 | 0.1287 |
| 11274 | USP18 | P26T-E | Human | Esophagus | ESCC | 4.44e-08 | 1.96e-01 | 0.1276 |
| 11274 | USP18 | P27T-E | Human | Esophagus | ESCC | 2.56e-16 | 2.74e-01 | 0.1055 |
| 11274 | USP18 | P28T-E | Human | Esophagus | ESCC | 5.17e-27 | 4.43e-01 | 0.1149 |
| Page: 1 2 3 4 5 |
| Tissue | Expression Dynamics | Abbreviation |
| Esophagus | 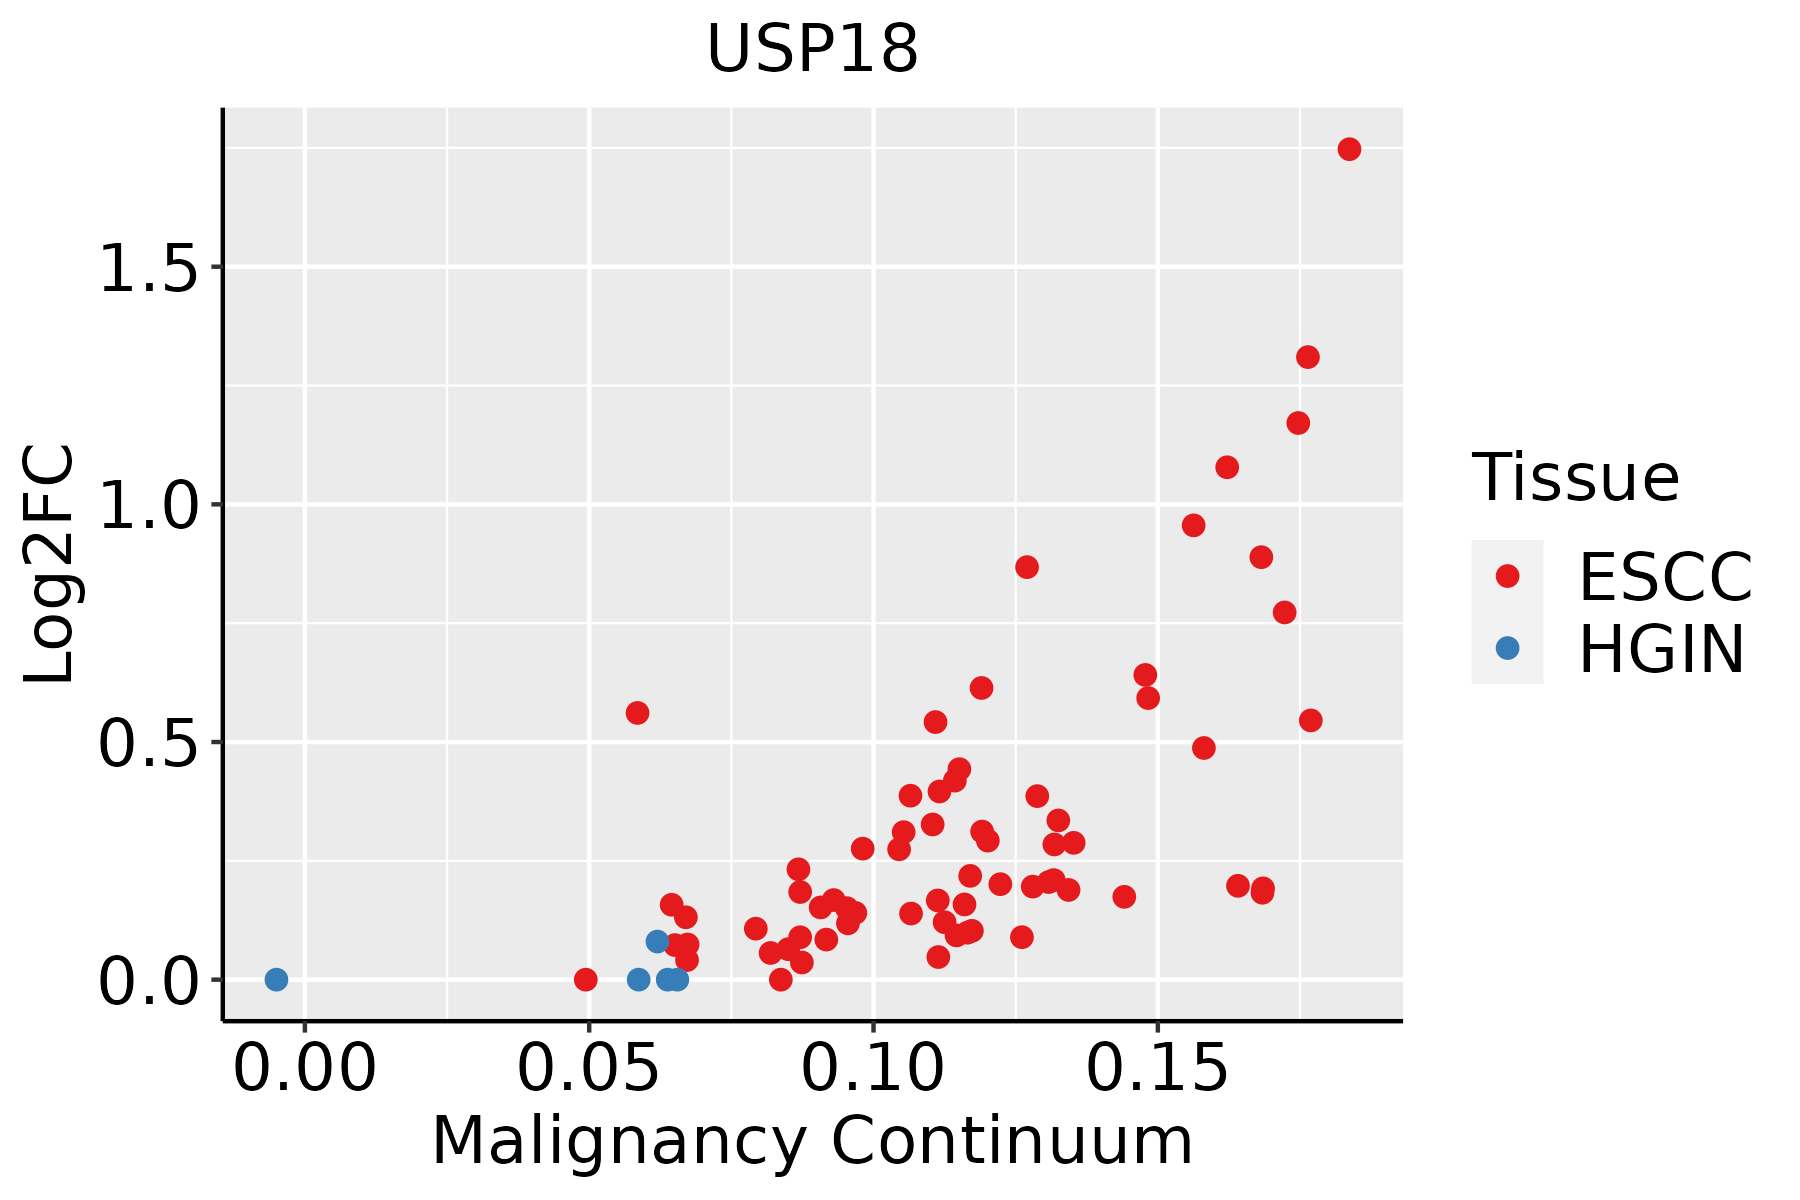 | ESCC: Esophageal squamous cell carcinoma |
| HGIN: High-grade intraepithelial neoplasias | ||
| LGIN: Low-grade intraepithelial neoplasias | ||
| Liver | 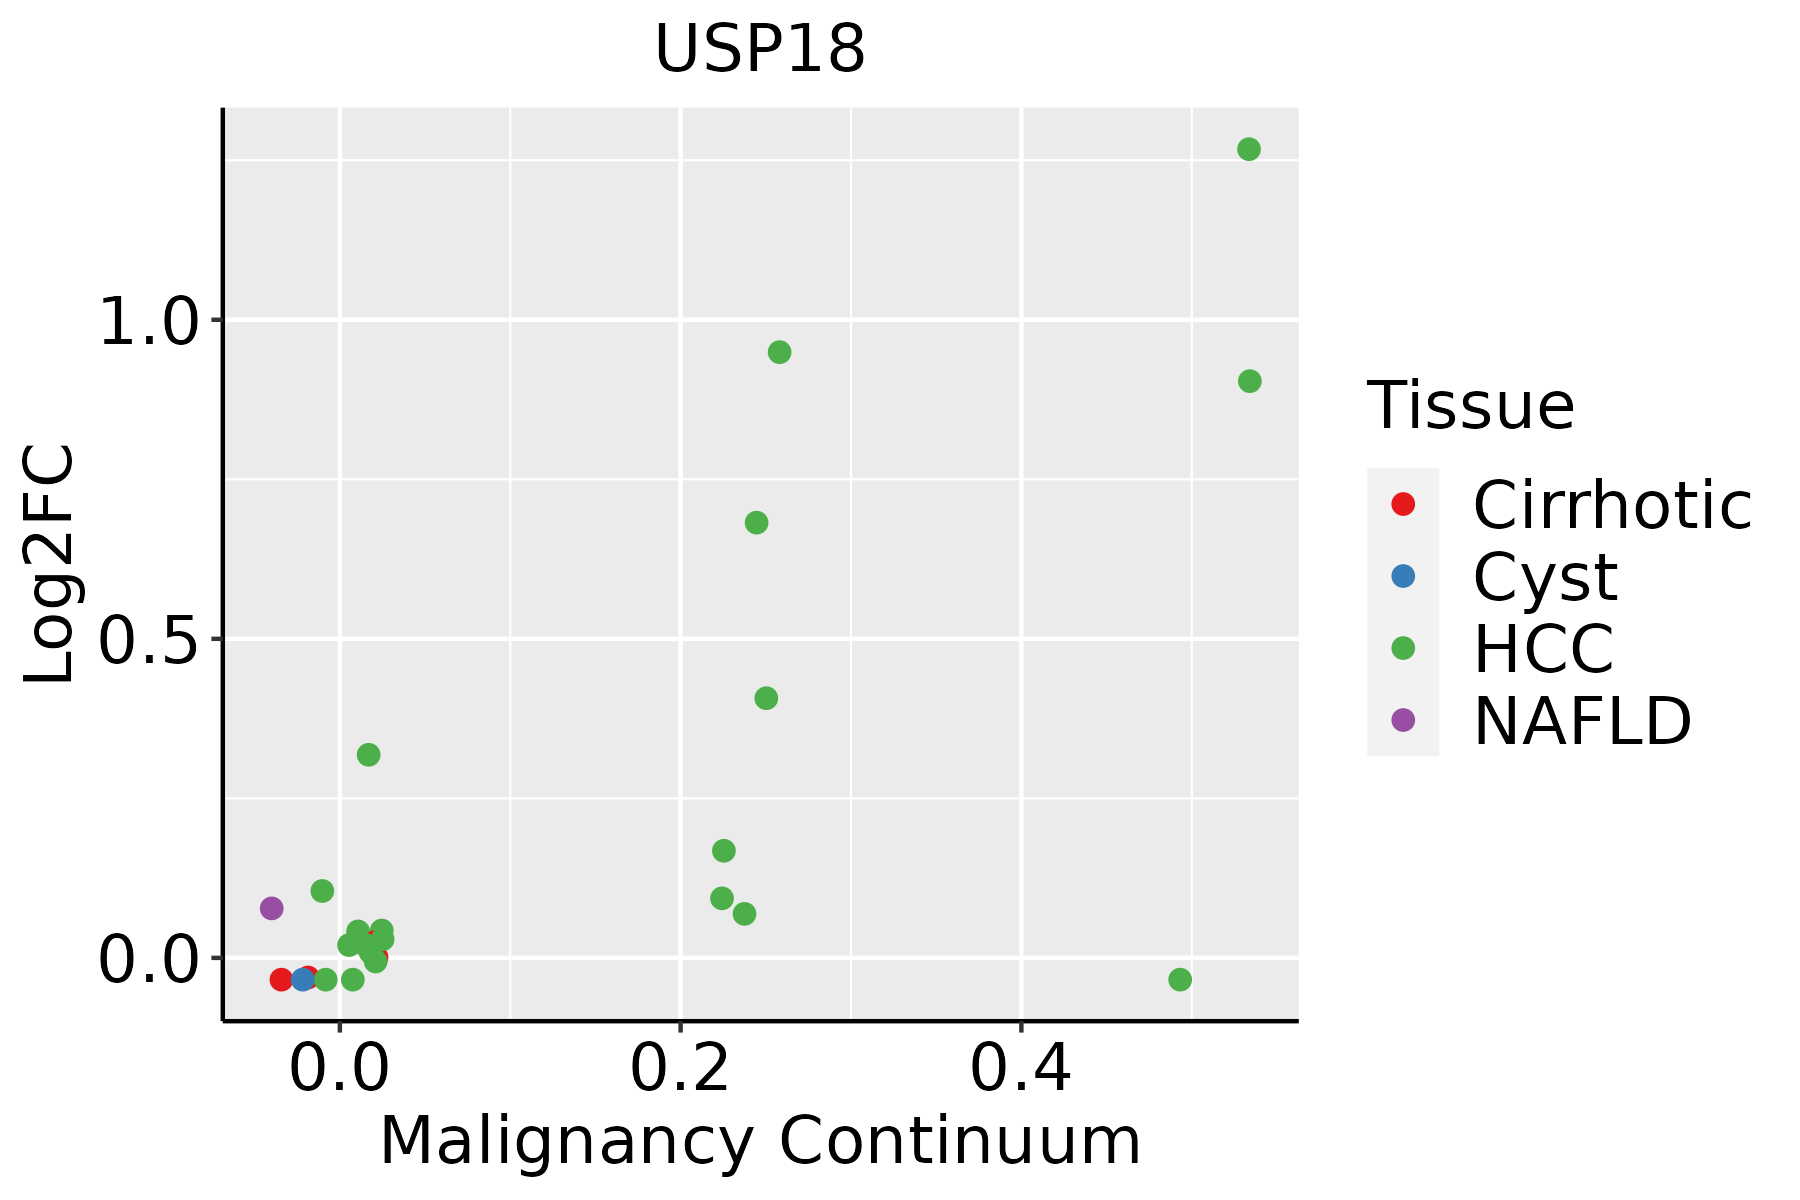 | HCC: Hepatocellular carcinoma |
| NAFLD: Non-alcoholic fatty liver disease | ||
| Oral Cavity |  | EOLP: Erosive Oral lichen planus |
| LP: leukoplakia | ||
| NEOLP: Non-erosive oral lichen planus | ||
| OSCC: Oral squamous cell carcinoma | ||
| Thyroid |  | ATC: Anaplastic thyroid cancer |
| HT: Hashimoto's thyroiditis | ||
| PTC: Papillary thyroid cancer |
| ∗log2FC in expression of this searched gene in stem-like cells from each diseased tissue sample relative to stem-like cells in normal samples in each tissue plotted against the malignancy continuum. Samples are colored based on if they are from different disease stage. |
Top |
Malignant transformation related pathway analysis |
| Find out the enriched GO biological processes and KEGG pathways involved in transition from healthy to precancer to cancer |
| Tissue | Disease Stage | Enriched GO biological Processes |
| Colorectum | AD |  |
| Colorectum | SER |  |
| Colorectum | MSS |  |
| Colorectum | MSI-H |  |
| Colorectum | FAP |  |
| ∗Top 15 enriched GO BP terms are showed in the bar plot of each disease state in each tissue. Each row represents a significant GO biological process which is colored according to the -log10(p.adjust). |
| Page: 1 2 3 4 5 6 7 8 9 |
| GO ID | Tissue | Disease Stage | Description | Gene Ratio | Bg Ratio | pvalue | p.adjust | Count |
| GO:001631110 | Esophagus | ESCC | dephosphorylation | 251/8552 | 417/18723 | 1.26e-09 | 2.99e-08 | 251 |
| GO:000647018 | Esophagus | ESCC | protein dephosphorylation | 177/8552 | 281/18723 | 3.13e-09 | 6.72e-08 | 177 |
| GO:003434013 | Esophagus | ESCC | response to type I interferon | 48/8552 | 58/18723 | 6.18e-09 | 1.26e-07 | 48 |
| GO:00603375 | Esophagus | ESCC | type I interferon signaling pathway | 41/8552 | 50/18723 | 1.35e-07 | 2.17e-06 | 41 |
| GO:00713575 | Esophagus | ESCC | cellular response to type I interferon | 42/8552 | 52/18723 | 2.15e-07 | 3.30e-06 | 42 |
| GO:00028318 | Esophagus | ESCC | regulation of response to biotic stimulus | 191/8552 | 327/18723 | 2.12e-06 | 2.45e-05 | 191 |
| GO:00607595 | Esophagus | ESCC | regulation of response to cytokine stimulus | 103/8552 | 162/18723 | 3.14e-06 | 3.53e-05 | 103 |
| GO:000283212 | Esophagus | ESCC | negative regulation of response to biotic stimulus | 72/8552 | 108/18723 | 8.36e-06 | 8.11e-05 | 72 |
| GO:00019595 | Esophagus | ESCC | regulation of cytokine-mediated signaling pathway | 95/8552 | 150/18723 | 9.48e-06 | 9.04e-05 | 95 |
| GO:00603385 | Esophagus | ESCC | regulation of type I interferon-mediated signaling pathway | 29/8552 | 36/18723 | 1.91e-05 | 1.67e-04 | 29 |
| GO:007064612 | Esophagus | ESCC | protein modification by small protein removal | 95/8552 | 157/18723 | 1.25e-04 | 8.56e-04 | 95 |
| GO:00450885 | Esophagus | ESCC | regulation of innate immune response | 125/8552 | 218/18723 | 3.34e-04 | 1.96e-03 | 125 |
| GO:00507775 | Esophagus | ESCC | negative regulation of immune response | 112/8552 | 194/18723 | 4.67e-04 | 2.62e-03 | 112 |
| GO:000268316 | Esophagus | ESCC | negative regulation of immune system process | 231/8552 | 434/18723 | 8.48e-04 | 4.36e-03 | 231 |
| GO:00458245 | Esophagus | ESCC | negative regulation of innate immune response | 45/8552 | 71/18723 | 1.98e-03 | 8.90e-03 | 45 |
| GO:00359703 | Esophagus | ESCC | peptidyl-threonine dephosphorylation | 13/8552 | 16/18723 | 4.05e-03 | 1.62e-02 | 13 |
| GO:00165793 | Esophagus | ESCC | protein deubiquitination | 79/8552 | 139/18723 | 5.23e-03 | 1.97e-02 | 79 |
| GO:00603392 | Esophagus | ESCC | negative regulation of type I interferon-mediated signaling pathway | 15/8552 | 20/18723 | 7.60e-03 | 2.71e-02 | 15 |
| GO:001631121 | Liver | HCC | dephosphorylation | 230/7958 | 417/18723 | 1.00e-07 | 1.96e-06 | 230 |
| GO:000647021 | Liver | HCC | protein dephosphorylation | 162/7958 | 281/18723 | 1.91e-07 | 3.46e-06 | 162 |
| Page: 1 2 3 4 5 |
| Pathway ID | Tissue | Disease Stage | Description | Gene Ratio | Bg Ratio | pvalue | p.adjust | qvalue | Count |
| Page: 1 |
Top |
Cell-cell communication analysis |
| Identification of potential cell-cell interactions between two cell types and their ligand-receptor pairs for different disease states |
| Ligand | Receptor | LRpair | Pathway | Tissue | Disease Stage |
| Page: 1 |
Top |
Single-cell gene regulatory network inference analysis |
| Find out the significant the regulons (TFs) and the target genes of each regulon across cell types for different disease states |
| TF | Cell Type | Tissue | Disease Stage | Target Gene | RSS | Regulon Activity |
| ∗The dot plots of a searched regulon are shown for all cell subpopulations in each disease state of each tissue based on the regulon specific score inferred using pySCENIC and by calculating the average expression. |
| Page: 1 |
Top |
Somatic mutation of malignant transformation related genes |
| Annotation of somatic variants for genes involved in malignant transformation |
| Hugo Symbol | Variant Class | Variant Classification | dbSNP RS | HGVSc | HGVSp | HGVSp Short | SWISSPROT | BIOTYPE | SIFT | PolyPhen | Tumor Sample Barcode | Tissue | Histology | Sex | Age | Stage | Therapy Types | Drugs | Outcome |
| USP18 | SNV | Missense_Mutation | novel | c.783N>G | p.Ile261Met | p.I261M | Q9UMW8 | protein_coding | tolerated(0.14) | possibly_damaging(0.501) | TCGA-AC-A23H-01 | Breast | breast invasive carcinoma | Female | >=65 | I/II | Unknown | Unknown | PD |
| USP18 | deletion | Frame_Shift_Del | novel | c.59delC | p.Ser20CysfsTer17 | p.S20Cfs*17 | Q9UMW8 | protein_coding | TCGA-EW-A2FV-01 | Breast | breast invasive carcinoma | Female | <65 | III/IV | Chemotherapy | docetaxel | SD | ||
| USP18 | SNV | Missense_Mutation | c.87N>C | p.Lys29Asn | p.K29N | Q9UMW8 | protein_coding | tolerated(0.13) | benign(0.001) | TCGA-C5-A1BQ-01 | Cervix | cervical & endocervical cancer | Female | >=65 | III/IV | Chemotherapy | cisplatin | CR | |
| USP18 | SNV | Missense_Mutation | novel | c.773G>A | p.Arg258Gln | p.R258Q | Q9UMW8 | protein_coding | deleterious(0) | probably_damaging(1) | TCGA-AA-3984-01 | Colorectum | colon adenocarcinoma | Female | <65 | I/II | Unknown | Unknown | SD |
| USP18 | SNV | Missense_Mutation | c.475N>A | p.His159Asn | p.H159N | Q9UMW8 | protein_coding | tolerated(0.13) | benign(0.083) | TCGA-CM-4744-01 | Colorectum | colon adenocarcinoma | Male | >=65 | I/II | Unknown | Unknown | SD | |
| USP18 | SNV | Missense_Mutation | rs769160740 | c.130N>T | p.Arg44Cys | p.R44C | Q9UMW8 | protein_coding | tolerated(0.18) | benign(0) | TCGA-G4-6588-01 | Colorectum | colon adenocarcinoma | Female | <65 | I/II | Unknown | Unknown | SD |
| USP18 | SNV | Missense_Mutation | c.140N>T | p.Ala47Val | p.A47V | Q9UMW8 | protein_coding | tolerated(0.16) | benign(0.122) | TCGA-AG-3894-01 | Colorectum | rectum adenocarcinoma | Male | >=65 | I/II | Chemotherapy | 5-fluorouracil | CR | |
| USP18 | SNV | Missense_Mutation | novel | c.744N>T | p.Leu248Phe | p.L248F | Q9UMW8 | protein_coding | deleterious(0.01) | possibly_damaging(0.603) | TCGA-EI-7002-01 | Colorectum | rectum adenocarcinoma | Male | <65 | III/IV | Chemotherapy | irinotecan+5-fluorouracilim | SD |
| USP18 | SNV | Missense_Mutation | novel | c.136A>G | p.Arg46Gly | p.R46G | Q9UMW8 | protein_coding | tolerated(0.72) | benign(0) | TCGA-AJ-A3EL-01 | Endometrium | uterine corpus endometrioid carcinoma | Female | <65 | I/II | Unknown | Unknown | SD |
| USP18 | SNV | Missense_Mutation | novel | c.377N>A | p.Cys126Tyr | p.C126Y | Q9UMW8 | protein_coding | deleterious(0) | probably_damaging(0.998) | TCGA-AP-A1DO-01 | Endometrium | uterine corpus endometrioid carcinoma | Female | <65 | I/II | Unknown | Unknown | SD |
| Page: 1 2 3 |
Top |
Related drugs of malignant transformation related genes |
| Identification of chemicals and drugs interact with genes involved in malignant transfromation |
| (DGIdb 4.0) |
| Entrez ID | Symbol | Category | Interaction Types | Drug Claim Name | Drug Name | PMIDs |
| Page: 1 |

Copyright 2023-Present -The University of Texas Health Science Center at Houston |