
|
|||||
|
 | |
| |
| |
| |
| |
| |
|
Gene: USP15 |
Gene summary for USP15 |
| Gene information | Species | Human | Gene symbol | USP15 | Gene ID | 9958 |
| Gene name | ubiquitin specific peptidase 15 | |
| Gene Alias | UNPH-2 | |
| Cytomap | 12q14.1 | |
| Gene Type | protein-coding | GO ID | GO:0002221 | UniProtAcc | Q9Y4E8 |
Top |
Malignant transformation analysis |
| Identification of the aberrant gene expression in precancerous and cancerous lesions by comparing the gene expression of stem-like cells in diseased tissues with normal stem cells |
| Entrez ID | Symbol | Replicates | Species | Organ | Tissue | Adj P-value | Log2FC | Malignancy |
| 9958 | USP15 | CA_HPV_1 | Human | Cervix | CC | 3.31e-05 | 2.46e-01 | 0.0264 |
| 9958 | USP15 | CA_HPV_2 | Human | Cervix | CC | 5.30e-03 | 2.41e-01 | 0.0391 |
| 9958 | USP15 | CCI_2 | Human | Cervix | CC | 6.18e-07 | 1.23e+00 | 0.5249 |
| 9958 | USP15 | CCI_3 | Human | Cervix | CC | 6.49e-05 | 8.11e-01 | 0.516 |
| 9958 | USP15 | HTA11_3410_2000001011 | Human | Colorectum | AD | 1.22e-16 | -7.22e-01 | 0.0155 |
| 9958 | USP15 | HTA11_2487_2000001011 | Human | Colorectum | SER | 3.82e-04 | -5.65e-01 | -0.1808 |
| 9958 | USP15 | HTA11_2951_2000001011 | Human | Colorectum | AD | 2.59e-02 | -6.93e-01 | 0.0216 |
| 9958 | USP15 | HTA11_1938_2000001011 | Human | Colorectum | AD | 3.11e-02 | -4.37e-01 | -0.0811 |
| 9958 | USP15 | HTA11_3361_2000001011 | Human | Colorectum | AD | 4.68e-09 | -7.54e-01 | -0.1207 |
| 9958 | USP15 | HTA11_696_2000001011 | Human | Colorectum | AD | 9.52e-19 | -5.50e-01 | -0.1464 |
| 9958 | USP15 | HTA11_866_2000001011 | Human | Colorectum | AD | 9.30e-06 | -3.83e-01 | -0.1001 |
| 9958 | USP15 | HTA11_5212_2000001011 | Human | Colorectum | AD | 1.97e-03 | -7.30e-01 | -0.2061 |
| 9958 | USP15 | HTA11_546_2000001011 | Human | Colorectum | AD | 2.49e-04 | -5.70e-01 | -0.0842 |
| 9958 | USP15 | HTA11_7862_2000001011 | Human | Colorectum | AD | 3.30e-04 | -5.24e-01 | -0.0179 |
| 9958 | USP15 | HTA11_866_3004761011 | Human | Colorectum | AD | 2.05e-19 | -7.50e-01 | 0.096 |
| 9958 | USP15 | HTA11_9408_2000001011 | Human | Colorectum | AD | 5.16e-03 | -9.03e-01 | 0.0451 |
| 9958 | USP15 | HTA11_8622_2000001021 | Human | Colorectum | SER | 1.01e-06 | -8.73e-01 | 0.0528 |
| 9958 | USP15 | HTA11_7663_2000001011 | Human | Colorectum | SER | 6.52e-03 | -4.68e-01 | 0.0131 |
| 9958 | USP15 | HTA11_10711_2000001011 | Human | Colorectum | AD | 1.71e-07 | -6.25e-01 | 0.0338 |
| 9958 | USP15 | HTA11_7696_3000711011 | Human | Colorectum | AD | 9.47e-30 | -7.21e-01 | 0.0674 |
| Page: 1 2 3 4 5 6 7 8 9 10 |
| Tissue | Expression Dynamics | Abbreviation |
| Cervix | 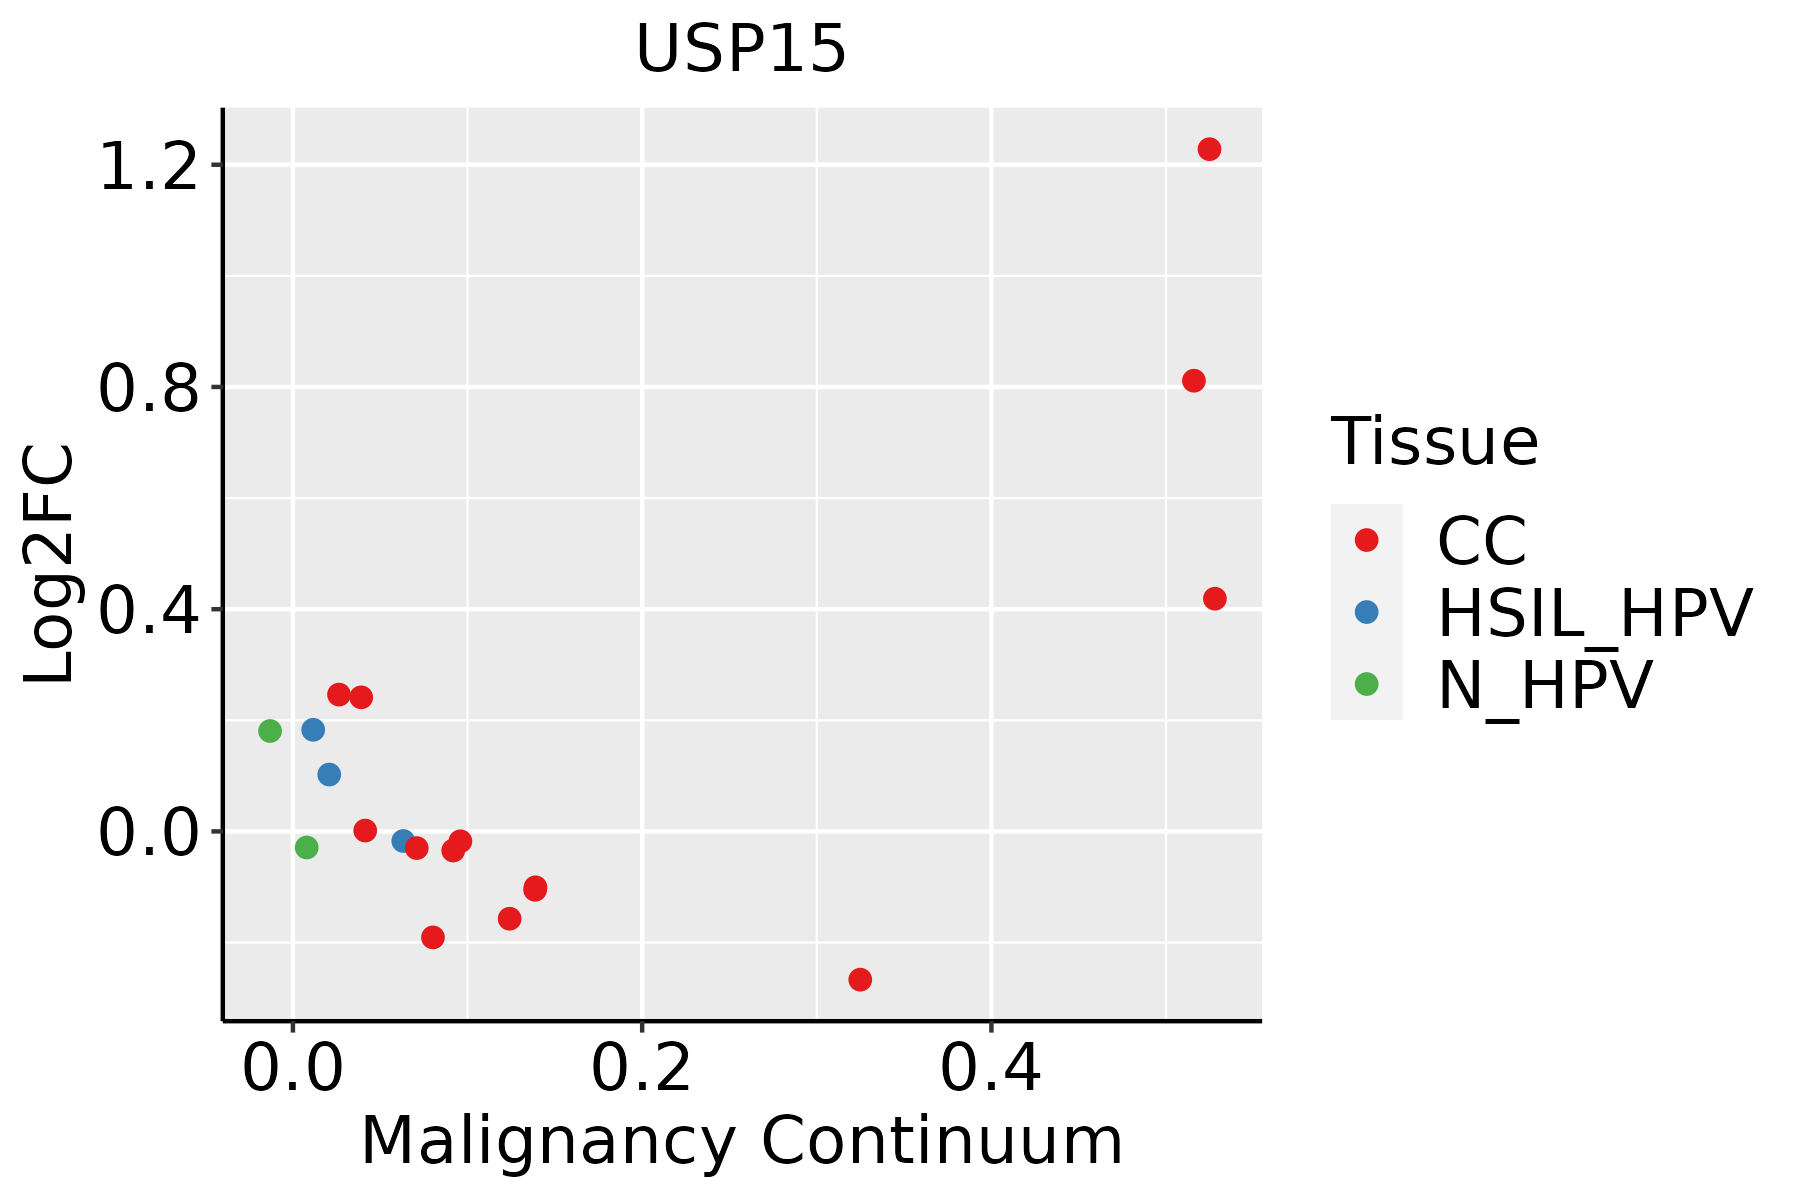 | CC: Cervix cancer |
| HSIL_HPV: HPV-infected high-grade squamous intraepithelial lesions | ||
| N_HPV: HPV-infected normal cervix | ||
| Colorectum (GSE201348) |  | FAP: Familial adenomatous polyposis |
| CRC: Colorectal cancer | ||
| Colorectum (HTA11) |  | AD: Adenomas |
| SER: Sessile serrated lesions | ||
| MSI-H: Microsatellite-high colorectal cancer | ||
| MSS: Microsatellite stable colorectal cancer | ||
| Esophagus |  | ESCC: Esophageal squamous cell carcinoma |
| HGIN: High-grade intraepithelial neoplasias | ||
| LGIN: Low-grade intraepithelial neoplasias | ||
| Liver | 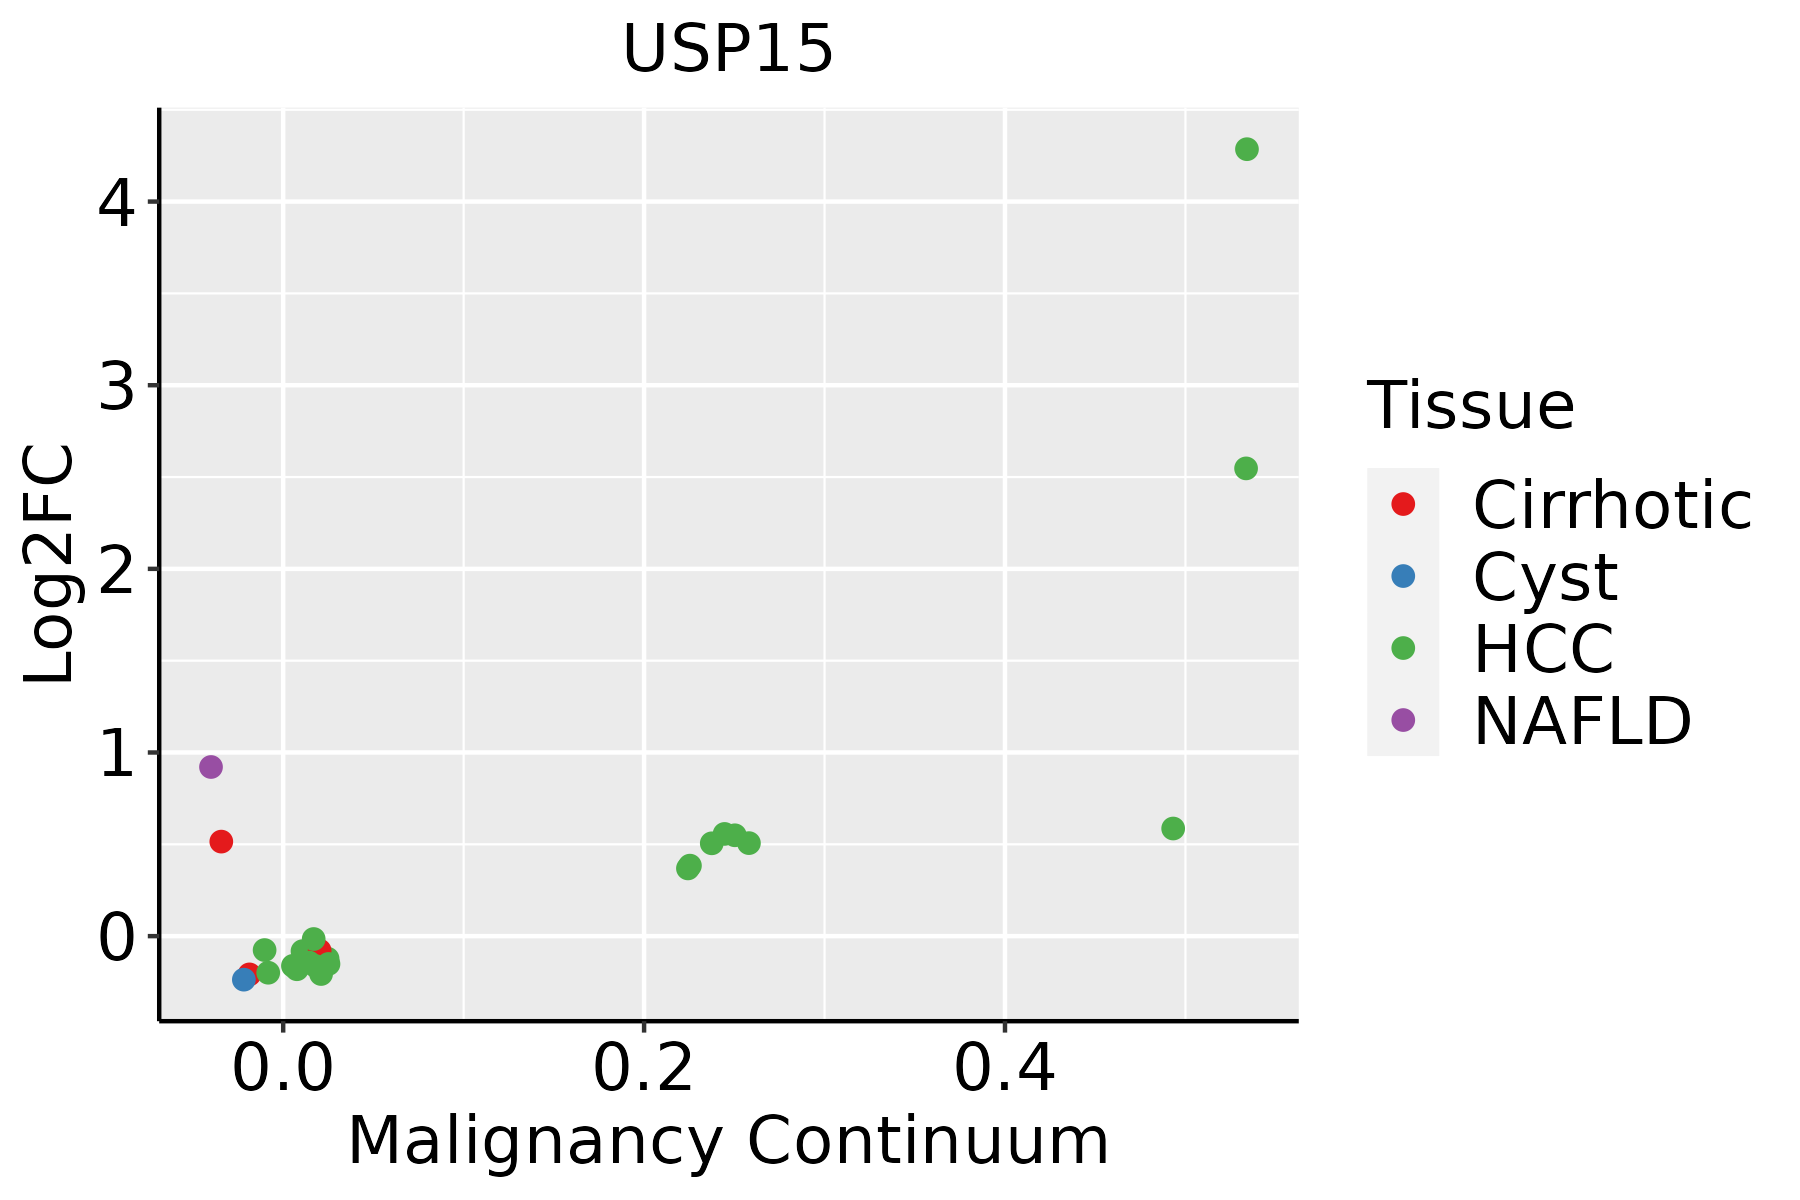 | HCC: Hepatocellular carcinoma |
| NAFLD: Non-alcoholic fatty liver disease | ||
| Lung | 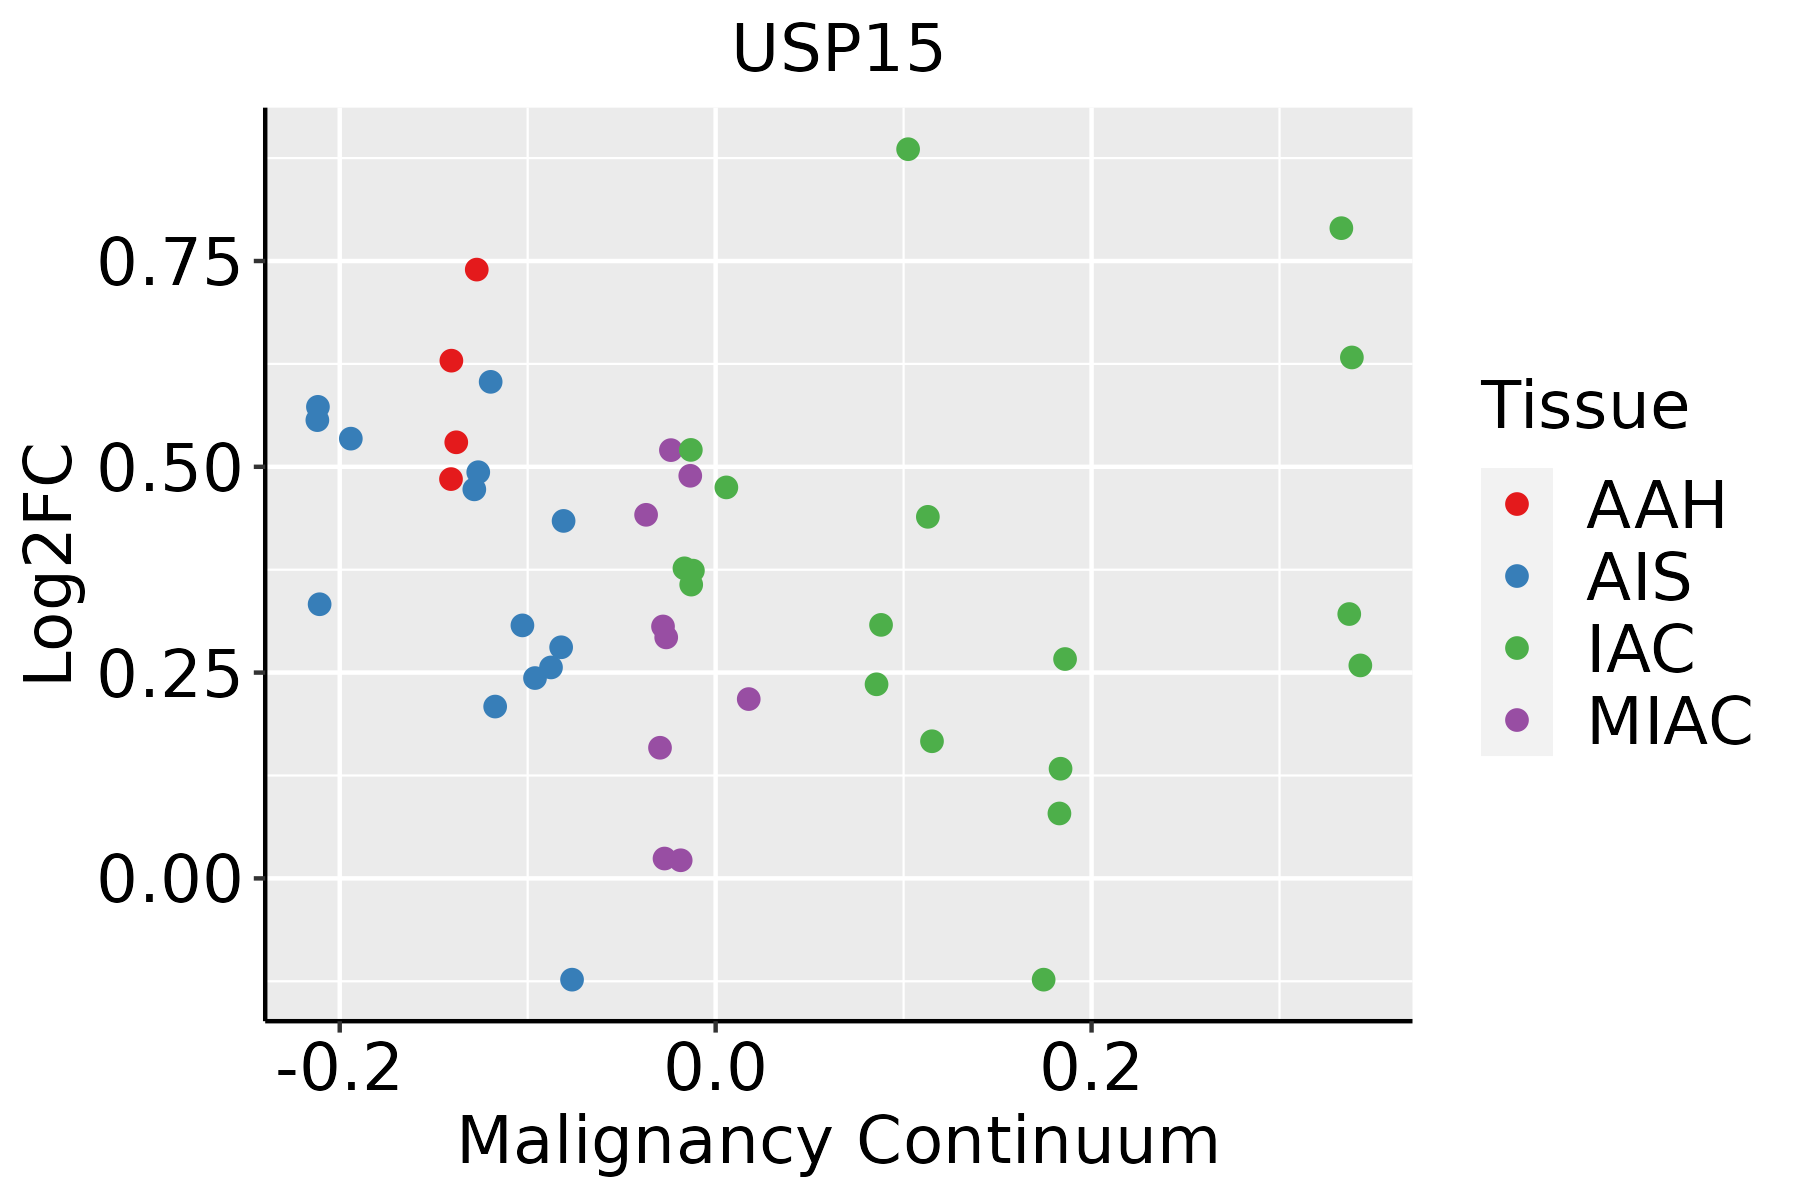 | AAH: Atypical adenomatous hyperplasia |
| AIS: Adenocarcinoma in situ | ||
| IAC: Invasive lung adenocarcinoma | ||
| MIA: Minimally invasive adenocarcinoma | ||
| Oral Cavity | 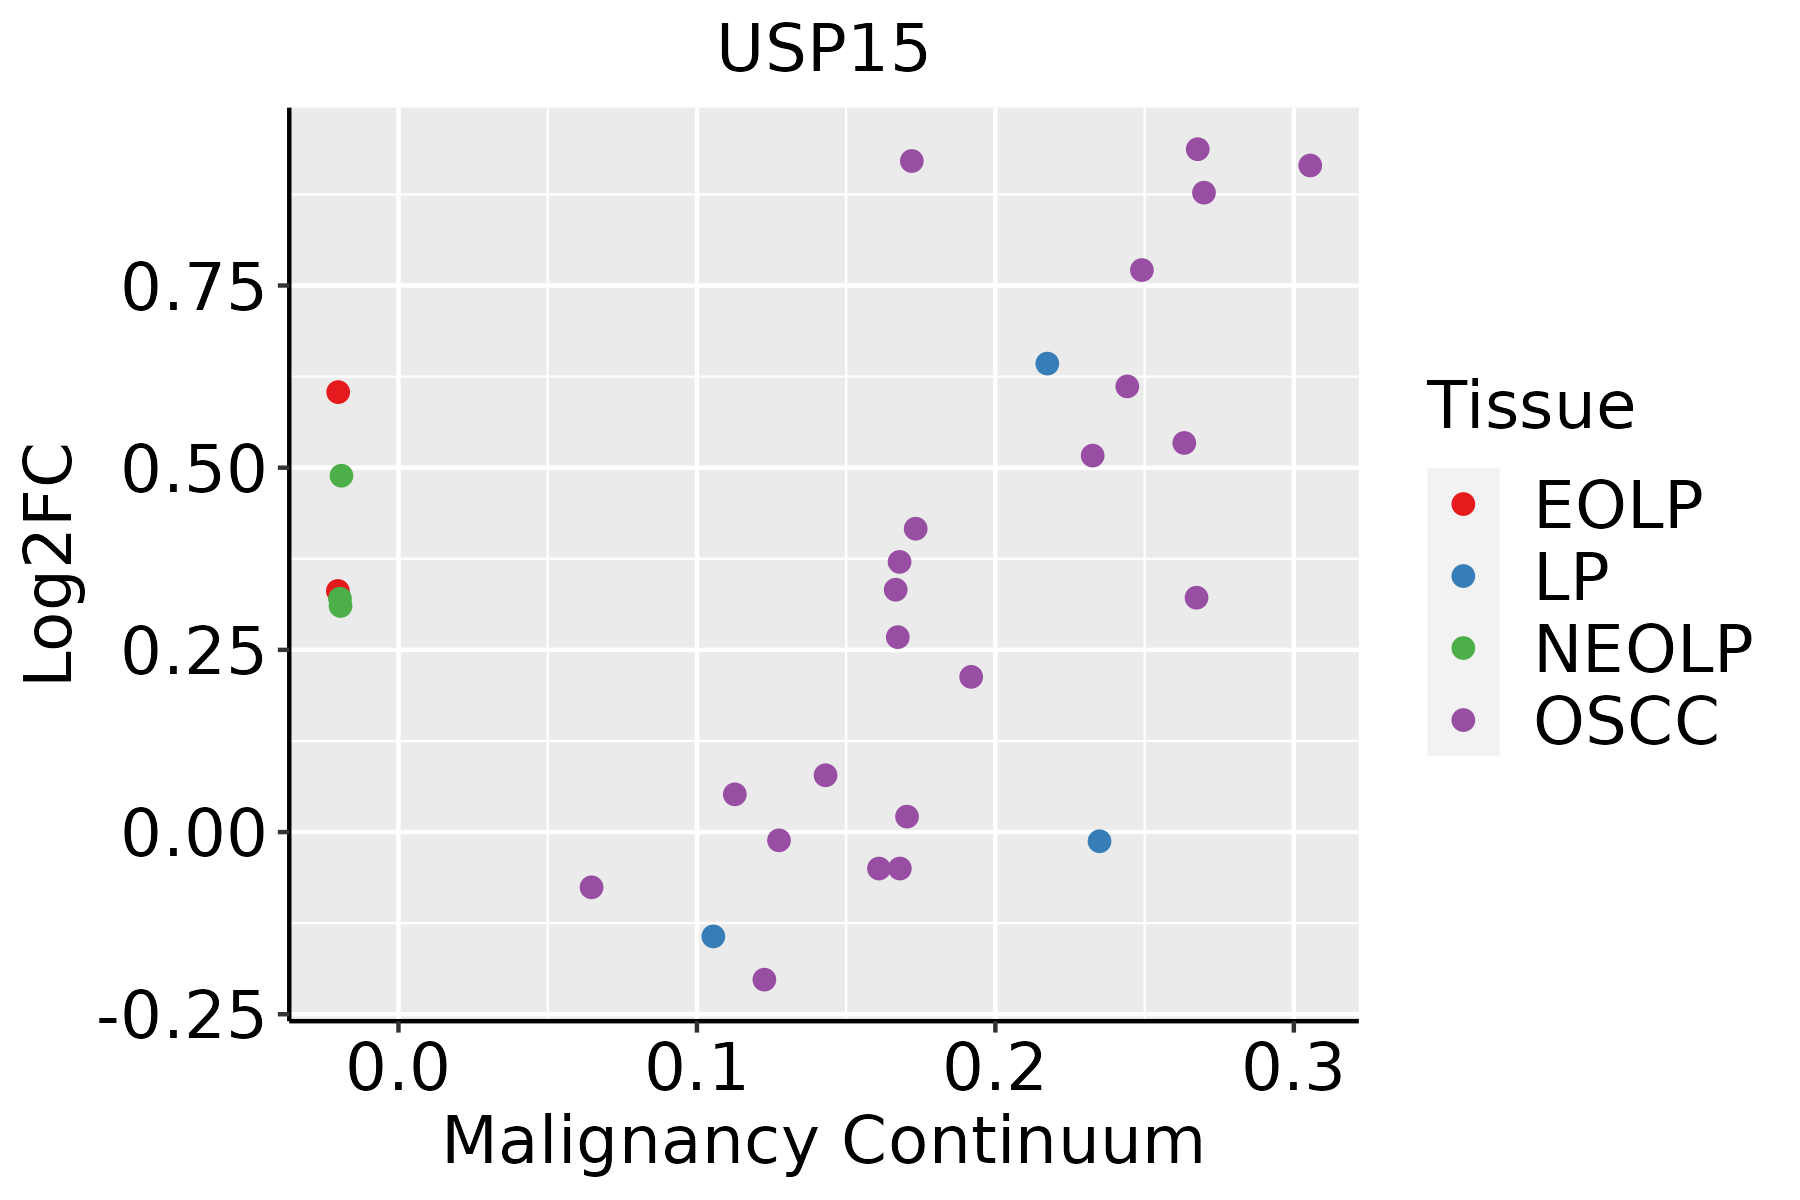 | EOLP: Erosive Oral lichen planus |
| LP: leukoplakia | ||
| NEOLP: Non-erosive oral lichen planus | ||
| OSCC: Oral squamous cell carcinoma | ||
| Skin | 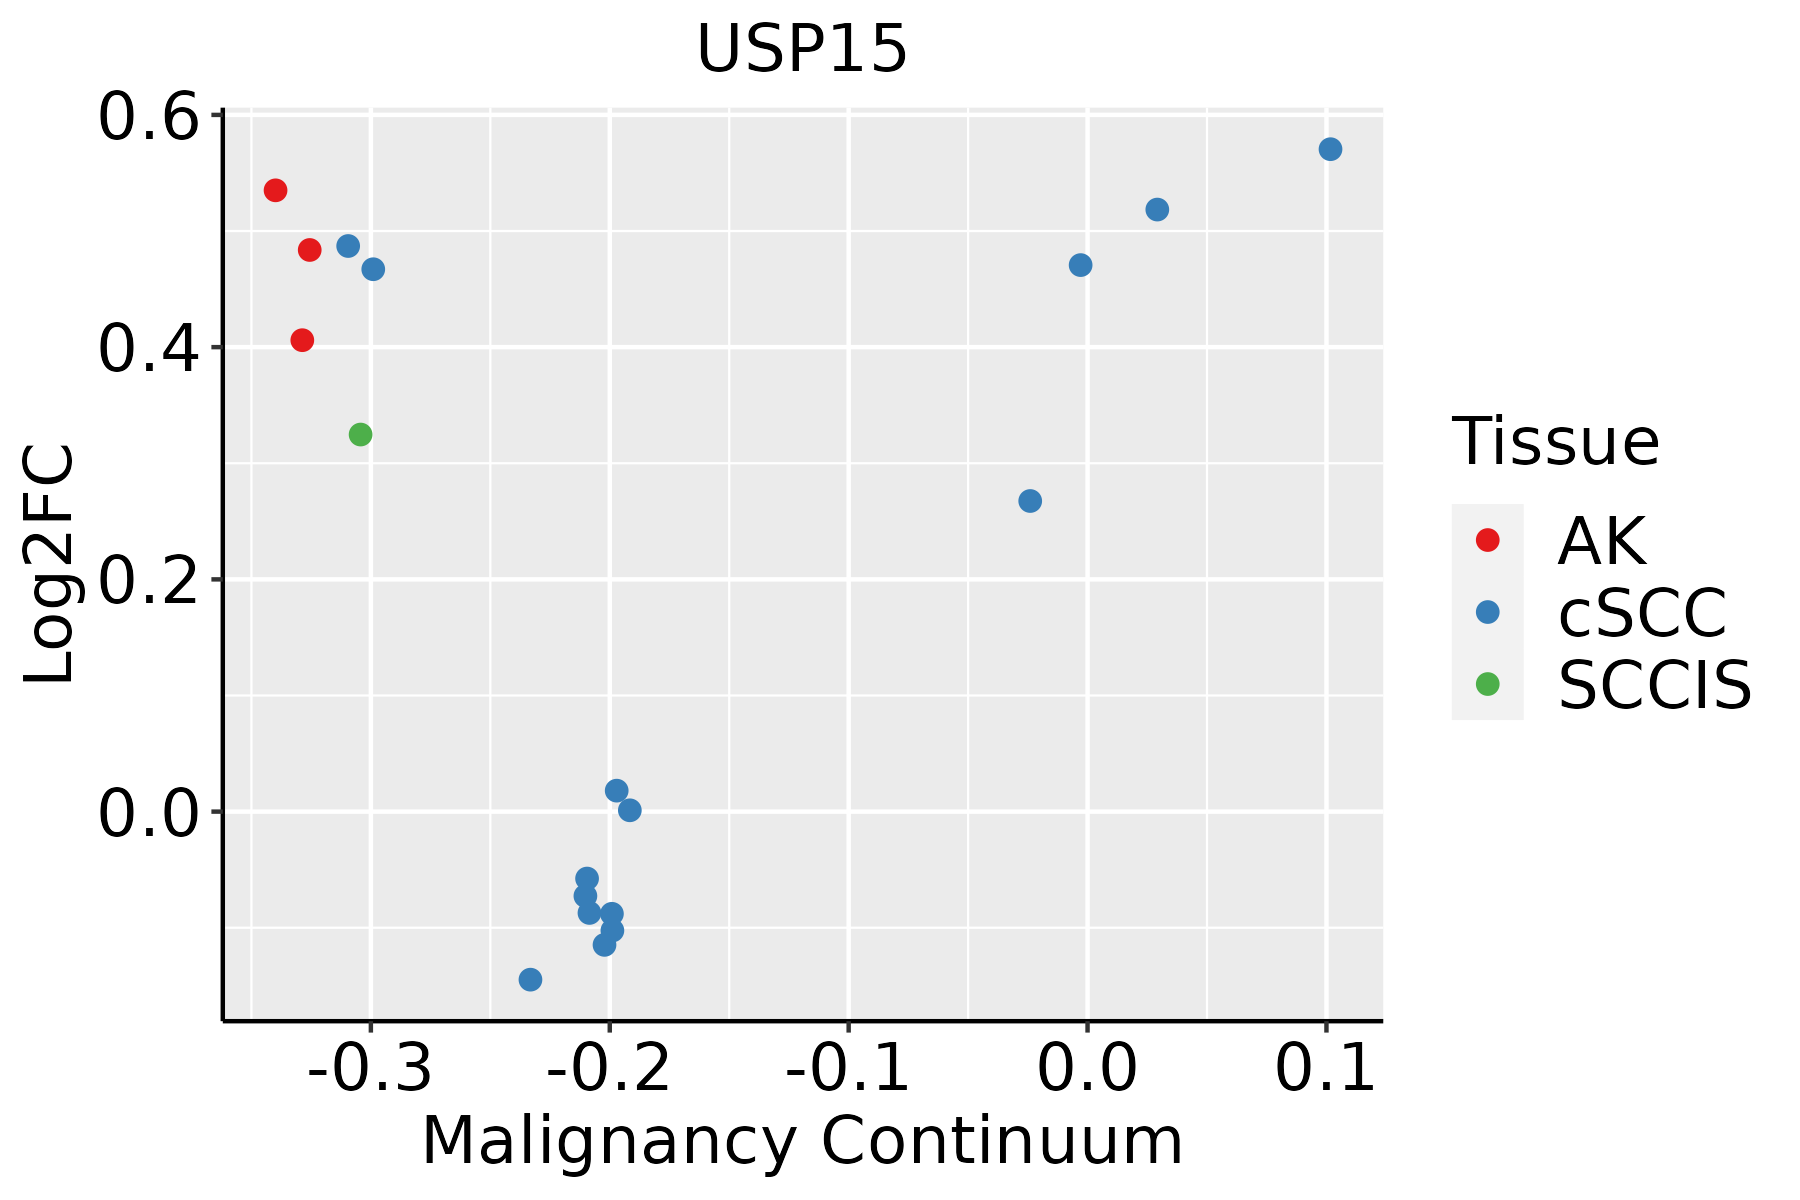 | AK: Actinic keratosis |
| cSCC: Cutaneous squamous cell carcinoma | ||
| SCCIS:squamous cell carcinoma in situ | ||
| Thyroid | 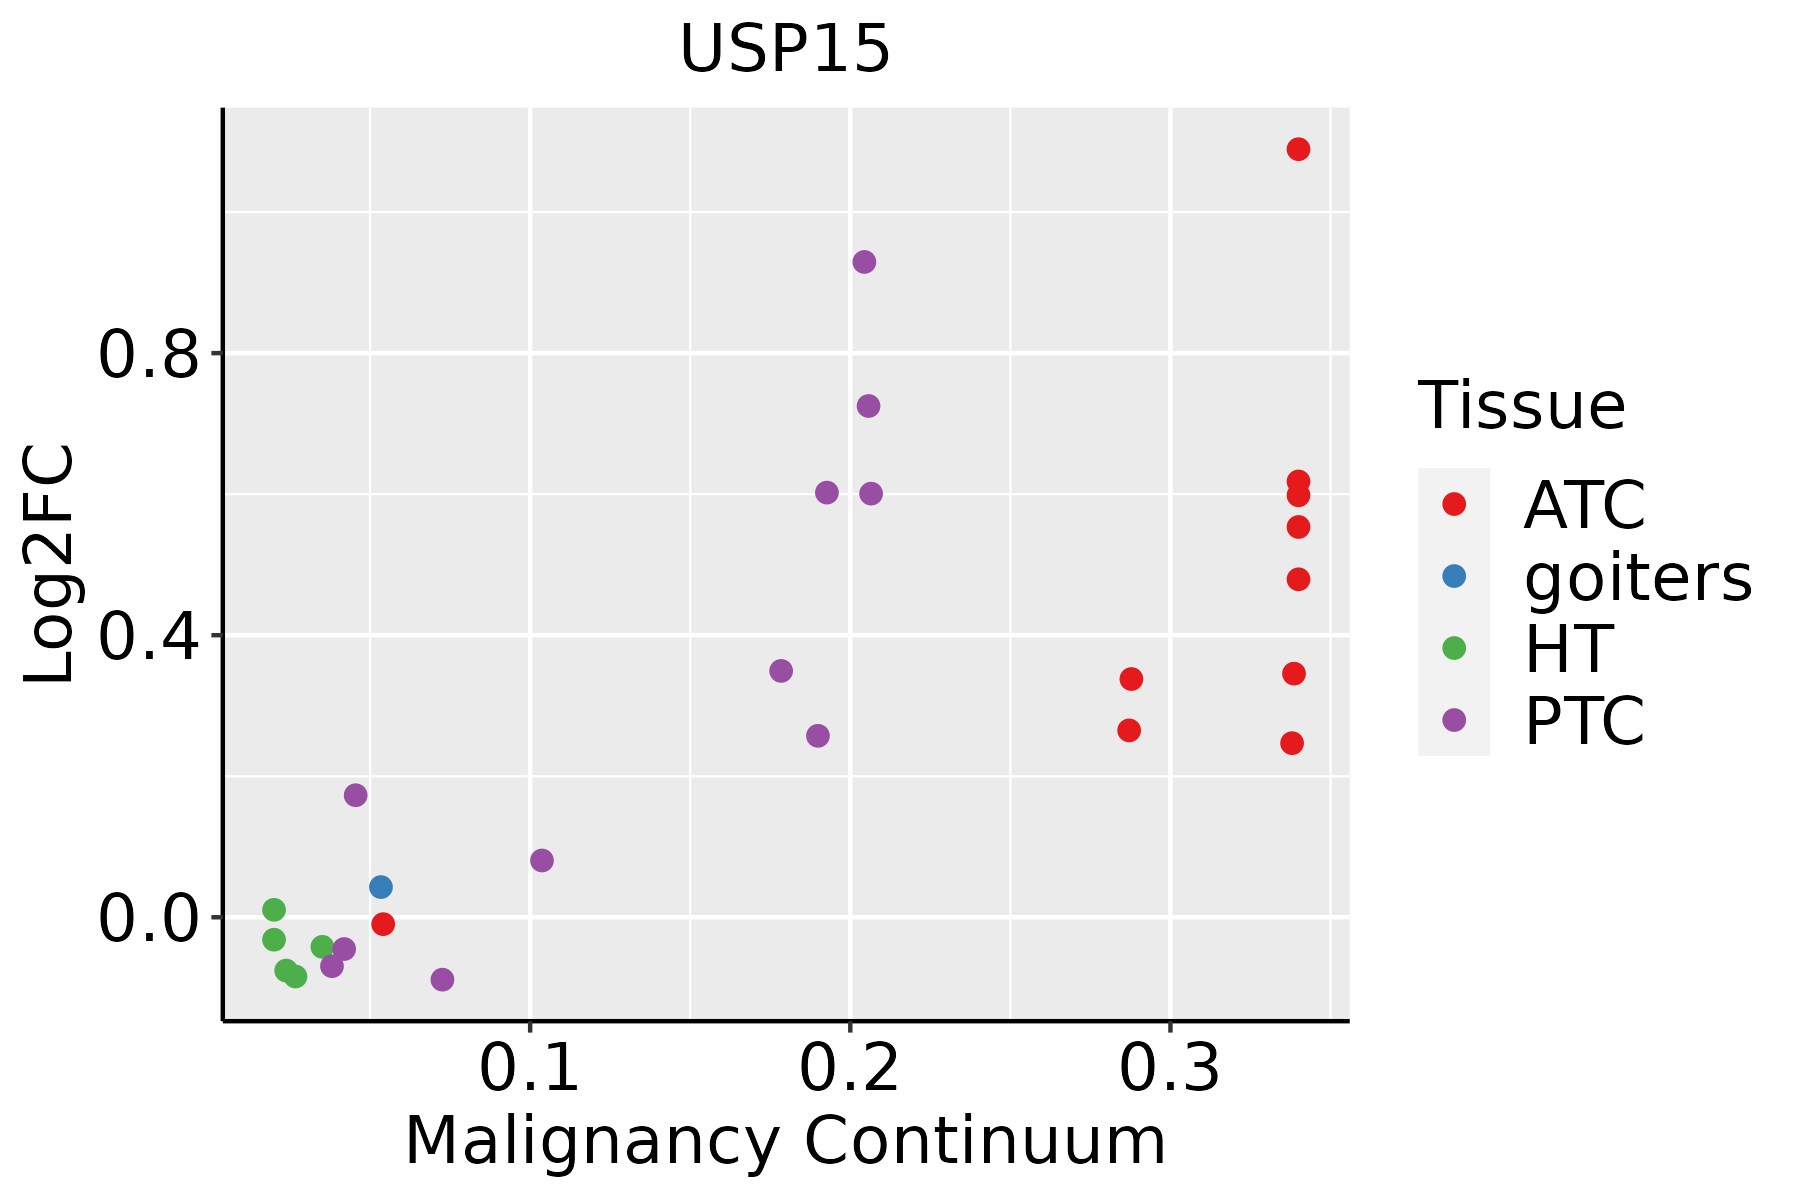 | ATC: Anaplastic thyroid cancer |
| HT: Hashimoto's thyroiditis | ||
| PTC: Papillary thyroid cancer |
| ∗log2FC in expression of this searched gene in stem-like cells from each diseased tissue sample relative to stem-like cells in normal samples in each tissue plotted against the malignancy continuum. Samples are colored based on if they are from different disease stage. |
Top |
Malignant transformation related pathway analysis |
| Find out the enriched GO biological processes and KEGG pathways involved in transition from healthy to precancer to cancer |
| Tissue | Disease Stage | Enriched GO biological Processes |
| Colorectum | AD |  |
| Colorectum | SER |  |
| Colorectum | MSS |  |
| Colorectum | MSI-H |  |
| Colorectum | FAP |  |
| ∗Top 15 enriched GO BP terms are showed in the bar plot of each disease state in each tissue. Each row represents a significant GO biological process which is colored according to the -log10(p.adjust). |
| Page: 1 2 3 4 5 6 7 8 9 |
| GO ID | Tissue | Disease Stage | Description | Gene Ratio | Bg Ratio | pvalue | p.adjust | Count |
| GO:00321035 | Cervix | CC | positive regulation of response to external stimulus | 95/2311 | 427/18723 | 5.44e-09 | 5.03e-07 | 95 |
| GO:00026837 | Cervix | CC | negative regulation of immune system process | 94/2311 | 434/18723 | 2.63e-08 | 1.87e-06 | 94 |
| GO:00027644 | Cervix | CC | immune response-regulating signaling pathway | 97/2311 | 468/18723 | 1.49e-07 | 7.07e-06 | 97 |
| GO:00305229 | Cervix | CC | intracellular receptor signaling pathway | 60/2311 | 265/18723 | 1.89e-06 | 5.97e-05 | 60 |
| GO:00028315 | Cervix | CC | regulation of response to biotic stimulus | 67/2311 | 327/18723 | 1.79e-05 | 3.36e-04 | 67 |
| GO:00096158 | Cervix | CC | response to virus | 73/2311 | 367/18723 | 2.22e-05 | 3.95e-04 | 73 |
| GO:00022212 | Cervix | CC | pattern recognition receptor signaling pathway | 39/2311 | 172/18723 | 1.08e-04 | 1.38e-03 | 39 |
| GO:00622073 | Cervix | CC | regulation of pattern recognition receptor signaling pathway | 27/2311 | 105/18723 | 1.37e-04 | 1.68e-03 | 27 |
| GO:00165705 | Cervix | CC | histone modification | 84/2311 | 463/18723 | 1.70e-04 | 2.01e-03 | 84 |
| GO:00027534 | Cervix | CC | cytoplasmic pattern recognition receptor signaling pathway | 18/2311 | 60/18723 | 2.26e-04 | 2.55e-03 | 18 |
| GO:00028322 | Cervix | CC | negative regulation of response to biotic stimulus | 27/2311 | 108/18723 | 2.27e-04 | 2.55e-03 | 27 |
| GO:00071786 | Cervix | CC | transmembrane receptor protein serine/threonine kinase signaling pathway | 67/2311 | 355/18723 | 2.39e-04 | 2.67e-03 | 67 |
| GO:00507773 | Cervix | CC | negative regulation of immune response | 41/2311 | 194/18723 | 3.63e-04 | 3.76e-03 | 41 |
| GO:00321022 | Cervix | CC | negative regulation of response to external stimulus | 75/2311 | 420/18723 | 5.96e-04 | 5.61e-03 | 75 |
| GO:00715595 | Cervix | CC | response to transforming growth factor beta | 50/2311 | 256/18723 | 6.31e-04 | 5.91e-03 | 50 |
| GO:00450882 | Cervix | CC | regulation of innate immune response | 44/2311 | 218/18723 | 6.40e-04 | 5.97e-03 | 44 |
| GO:00715605 | Cervix | CC | cellular response to transforming growth factor beta stimulus | 49/2311 | 250/18723 | 6.55e-04 | 6.05e-03 | 49 |
| GO:00395292 | Cervix | CC | RIG-I signaling pathway | 10/2311 | 27/18723 | 9.25e-04 | 7.84e-03 | 10 |
| GO:00028331 | Cervix | CC | positive regulation of response to biotic stimulus | 35/2311 | 168/18723 | 1.23e-03 | 9.87e-03 | 35 |
| GO:00395352 | Cervix | CC | regulation of RIG-I signaling pathway | 8/2311 | 20/18723 | 1.69e-03 | 1.29e-02 | 8 |
| Page: 1 2 3 4 5 6 7 8 9 10 11 12 13 14 15 16 17 18 |
| Pathway ID | Tissue | Disease Stage | Description | Gene Ratio | Bg Ratio | pvalue | p.adjust | qvalue | Count |
| hsa0413718 | Cervix | CC | Mitophagy - animal | 22/1267 | 72/8465 | 5.77e-04 | 2.75e-03 | 1.63e-03 | 22 |
| hsa0413719 | Cervix | CC | Mitophagy - animal | 22/1267 | 72/8465 | 5.77e-04 | 2.75e-03 | 1.63e-03 | 22 |
| hsa04137 | Colorectum | AD | Mitophagy - animal | 29/2092 | 72/8465 | 2.49e-03 | 1.35e-02 | 8.59e-03 | 29 |
| hsa041371 | Colorectum | AD | Mitophagy - animal | 29/2092 | 72/8465 | 2.49e-03 | 1.35e-02 | 8.59e-03 | 29 |
| hsa041372 | Colorectum | SER | Mitophagy - animal | 22/1580 | 72/8465 | 9.93e-03 | 4.78e-02 | 3.47e-02 | 22 |
| hsa041373 | Colorectum | SER | Mitophagy - animal | 22/1580 | 72/8465 | 9.93e-03 | 4.78e-02 | 3.47e-02 | 22 |
| hsa041374 | Colorectum | MSS | Mitophagy - animal | 27/1875 | 72/8465 | 2.17e-03 | 1.10e-02 | 6.76e-03 | 27 |
| hsa041375 | Colorectum | MSS | Mitophagy - animal | 27/1875 | 72/8465 | 2.17e-03 | 1.10e-02 | 6.76e-03 | 27 |
| hsa041378 | Colorectum | FAP | Mitophagy - animal | 20/1404 | 72/8465 | 1.14e-02 | 3.92e-02 | 2.38e-02 | 20 |
| hsa041379 | Colorectum | FAP | Mitophagy - animal | 20/1404 | 72/8465 | 1.14e-02 | 3.92e-02 | 2.38e-02 | 20 |
| hsa0413710 | Colorectum | CRC | Mitophagy - animal | 17/1091 | 72/8465 | 8.74e-03 | 4.00e-02 | 2.71e-02 | 17 |
| hsa0413711 | Colorectum | CRC | Mitophagy - animal | 17/1091 | 72/8465 | 8.74e-03 | 4.00e-02 | 2.71e-02 | 17 |
| hsa0413730 | Esophagus | HGIN | Mitophagy - animal | 23/1383 | 72/8465 | 7.69e-04 | 7.59e-03 | 6.03e-03 | 23 |
| hsa04137113 | Esophagus | HGIN | Mitophagy - animal | 23/1383 | 72/8465 | 7.69e-04 | 7.59e-03 | 6.03e-03 | 23 |
| hsa04137210 | Esophagus | ESCC | Mitophagy - animal | 54/4205 | 72/8465 | 9.33e-06 | 4.96e-05 | 2.54e-05 | 54 |
| hsa0413738 | Esophagus | ESCC | Mitophagy - animal | 54/4205 | 72/8465 | 9.33e-06 | 4.96e-05 | 2.54e-05 | 54 |
| hsa0413712 | Liver | NAFLD | Mitophagy - animal | 18/1043 | 72/8465 | 2.27e-03 | 2.46e-02 | 1.99e-02 | 18 |
| hsa0413713 | Liver | NAFLD | Mitophagy - animal | 18/1043 | 72/8465 | 2.27e-03 | 2.46e-02 | 1.99e-02 | 18 |
| hsa0413721 | Liver | Cirrhotic | Mitophagy - animal | 39/2530 | 72/8465 | 1.38e-05 | 1.24e-04 | 7.64e-05 | 39 |
| hsa0413731 | Liver | Cirrhotic | Mitophagy - animal | 39/2530 | 72/8465 | 1.38e-05 | 1.24e-04 | 7.64e-05 | 39 |
| Page: 1 2 |
Top |
Cell-cell communication analysis |
| Identification of potential cell-cell interactions between two cell types and their ligand-receptor pairs for different disease states |
| Ligand | Receptor | LRpair | Pathway | Tissue | Disease Stage |
| Page: 1 |
Top |
Single-cell gene regulatory network inference analysis |
| Find out the significant the regulons (TFs) and the target genes of each regulon across cell types for different disease states |
| TF | Cell Type | Tissue | Disease Stage | Target Gene | RSS | Regulon Activity |
| ∗The dot plots of a searched regulon are shown for all cell subpopulations in each disease state of each tissue based on the regulon specific score inferred using pySCENIC and by calculating the average expression. |
| Page: 1 |
Top |
Somatic mutation of malignant transformation related genes |
| Annotation of somatic variants for genes involved in malignant transformation |
| Hugo Symbol | Variant Class | Variant Classification | dbSNP RS | HGVSc | HGVSp | HGVSp Short | SWISSPROT | BIOTYPE | SIFT | PolyPhen | Tumor Sample Barcode | Tissue | Histology | Sex | Age | Stage | Therapy Types | Drugs | Outcome |
| USP15 | SNV | Missense_Mutation | c.2426N>A | p.Cys809Tyr | p.C809Y | Q9Y4E8 | protein_coding | deleterious(0) | probably_damaging(1) | TCGA-A2-A0SW-01 | Breast | breast invasive carcinoma | Female | >=65 | III/IV | Hormone Therapy | arimidex | PD | |
| USP15 | SNV | Missense_Mutation | c.832N>C | p.Glu278Gln | p.E278Q | Q9Y4E8 | protein_coding | tolerated(0.09) | possibly_damaging(0.821) | TCGA-A8-A09G-01 | Breast | breast invasive carcinoma | Female | >=65 | III/IV | Unknown | Unknown | SD | |
| USP15 | SNV | Missense_Mutation | c.2701N>A | p.Asp901Asn | p.D901N | Q9Y4E8 | protein_coding | tolerated(1) | benign(0.163) | TCGA-AC-A23H-01 | Breast | breast invasive carcinoma | Female | >=65 | I/II | Unknown | Unknown | PD | |
| USP15 | SNV | Missense_Mutation | novel | c.1552N>A | p.Asp518Asn | p.D518N | Q9Y4E8 | protein_coding | tolerated(0.09) | possibly_damaging(0.601) | TCGA-AC-A5XU-01 | Breast | breast invasive carcinoma | Female | >=65 | I/II | Hormone Therapy | letrozole | SD |
| USP15 | SNV | Missense_Mutation | c.2581A>G | p.Met861Val | p.M861V | Q9Y4E8 | protein_coding | deleterious(0.04) | probably_damaging(0.932) | TCGA-AN-A0AK-01 | Breast | breast invasive carcinoma | Female | >=65 | I/II | Unknown | Unknown | SD | |
| USP15 | SNV | Missense_Mutation | c.874N>G | p.Ser292Gly | p.S292G | Q9Y4E8 | protein_coding | tolerated(0.51) | benign(0.086) | TCGA-AO-A03O-01 | Breast | breast invasive carcinoma | Female | >=65 | I/II | Chemotherapy | doxorubicin | SD | |
| USP15 | SNV | Missense_Mutation | c.963N>C | p.Lys321Asn | p.K321N | Q9Y4E8 | protein_coding | tolerated(0.07) | benign(0.023) | TCGA-C8-A12K-01 | Breast | breast invasive carcinoma | Female | >=65 | I/II | Unknown | Unknown | SD | |
| USP15 | SNV | Missense_Mutation | c.2654N>T | p.Gly885Val | p.G885V | Q9Y4E8 | protein_coding | deleterious(0) | probably_damaging(1) | TCGA-D8-A27G-01 | Breast | breast invasive carcinoma | Female | >=65 | I/II | Unknown | Unknown | SD | |
| USP15 | SNV | Missense_Mutation | c.2899N>C | p.Asp967His | p.D967H | Q9Y4E8 | protein_coding | deleterious(0.03) | benign(0.243) | TCGA-GM-A2DO-01 | Breast | breast invasive carcinoma | Female | <65 | I/II | Hormone Therapy | tamoxiphen | CR | |
| USP15 | SNV | Missense_Mutation | c.1867G>A | p.Glu623Lys | p.E623K | Q9Y4E8 | protein_coding | tolerated(0.49) | benign(0.007) | TCGA-PE-A5DE-01 | Breast | breast invasive carcinoma | Female | <65 | I/II | Chemotherapy | taxotere | CR |
| Page: 1 2 3 4 5 6 7 8 9 10 11 |
Top |
Related drugs of malignant transformation related genes |
| Identification of chemicals and drugs interact with genes involved in malignant transfromation |
| (DGIdb 4.0) |
| Entrez ID | Symbol | Category | Interaction Types | Drug Claim Name | Drug Name | PMIDs |
| Page: 1 |

Copyright 2023-Present -The University of Texas Health Science Center at Houston |