
|
|||||
|
 | |
| |
| |
| |
| |
| |
|
Gene: USP13 |
Gene summary for USP13 |
| Gene information | Species | Human | Gene symbol | USP13 | Gene ID | 8975 |
| Gene name | ubiquitin specific peptidase 13 | |
| Gene Alias | ISOT3 | |
| Cytomap | 3q26.33 | |
| Gene Type | protein-coding | GO ID | GO:0006139 | UniProtAcc | A0A0A6YZ17 |
Top |
Malignant transformation analysis |
| Identification of the aberrant gene expression in precancerous and cancerous lesions by comparing the gene expression of stem-like cells in diseased tissues with normal stem cells |
| Entrez ID | Symbol | Replicates | Species | Organ | Tissue | Adj P-value | Log2FC | Malignancy |
| 8975 | USP13 | LZE7T | Human | Esophagus | ESCC | 1.79e-05 | 2.92e-01 | 0.0667 |
| 8975 | USP13 | P2T-E | Human | Esophagus | ESCC | 1.82e-33 | 7.70e-01 | 0.1177 |
| 8975 | USP13 | P4T-E | Human | Esophagus | ESCC | 5.30e-24 | 5.51e-01 | 0.1323 |
| 8975 | USP13 | P5T-E | Human | Esophagus | ESCC | 4.74e-59 | 9.97e-01 | 0.1327 |
| 8975 | USP13 | P8T-E | Human | Esophagus | ESCC | 2.41e-06 | 9.52e-02 | 0.0889 |
| 8975 | USP13 | P10T-E | Human | Esophagus | ESCC | 7.91e-11 | 2.33e-01 | 0.116 |
| 8975 | USP13 | P11T-E | Human | Esophagus | ESCC | 2.07e-05 | 3.54e-01 | 0.1426 |
| 8975 | USP13 | P12T-E | Human | Esophagus | ESCC | 1.89e-19 | 4.08e-01 | 0.1122 |
| 8975 | USP13 | P15T-E | Human | Esophagus | ESCC | 1.18e-13 | 3.53e-01 | 0.1149 |
| 8975 | USP13 | P16T-E | Human | Esophagus | ESCC | 7.41e-30 | 5.01e-01 | 0.1153 |
| 8975 | USP13 | P22T-E | Human | Esophagus | ESCC | 9.15e-17 | 3.70e-01 | 0.1236 |
| 8975 | USP13 | P23T-E | Human | Esophagus | ESCC | 1.35e-04 | 1.62e-01 | 0.108 |
| 8975 | USP13 | P24T-E | Human | Esophagus | ESCC | 3.23e-06 | 1.24e-01 | 0.1287 |
| 8975 | USP13 | P26T-E | Human | Esophagus | ESCC | 2.77e-29 | 4.96e-01 | 0.1276 |
| 8975 | USP13 | P27T-E | Human | Esophagus | ESCC | 9.38e-27 | 4.80e-01 | 0.1055 |
| 8975 | USP13 | P28T-E | Human | Esophagus | ESCC | 1.83e-10 | 2.22e-01 | 0.1149 |
| 8975 | USP13 | P30T-E | Human | Esophagus | ESCC | 7.29e-13 | 3.83e-01 | 0.137 |
| 8975 | USP13 | P31T-E | Human | Esophagus | ESCC | 2.63e-09 | 1.81e-01 | 0.1251 |
| 8975 | USP13 | P32T-E | Human | Esophagus | ESCC | 1.60e-18 | 4.28e-01 | 0.1666 |
| 8975 | USP13 | P36T-E | Human | Esophagus | ESCC | 3.73e-03 | 1.80e-01 | 0.1187 |
| Page: 1 2 3 |
| Tissue | Expression Dynamics | Abbreviation |
| Esophagus |  | ESCC: Esophageal squamous cell carcinoma |
| HGIN: High-grade intraepithelial neoplasias | ||
| LGIN: Low-grade intraepithelial neoplasias | ||
| Liver | 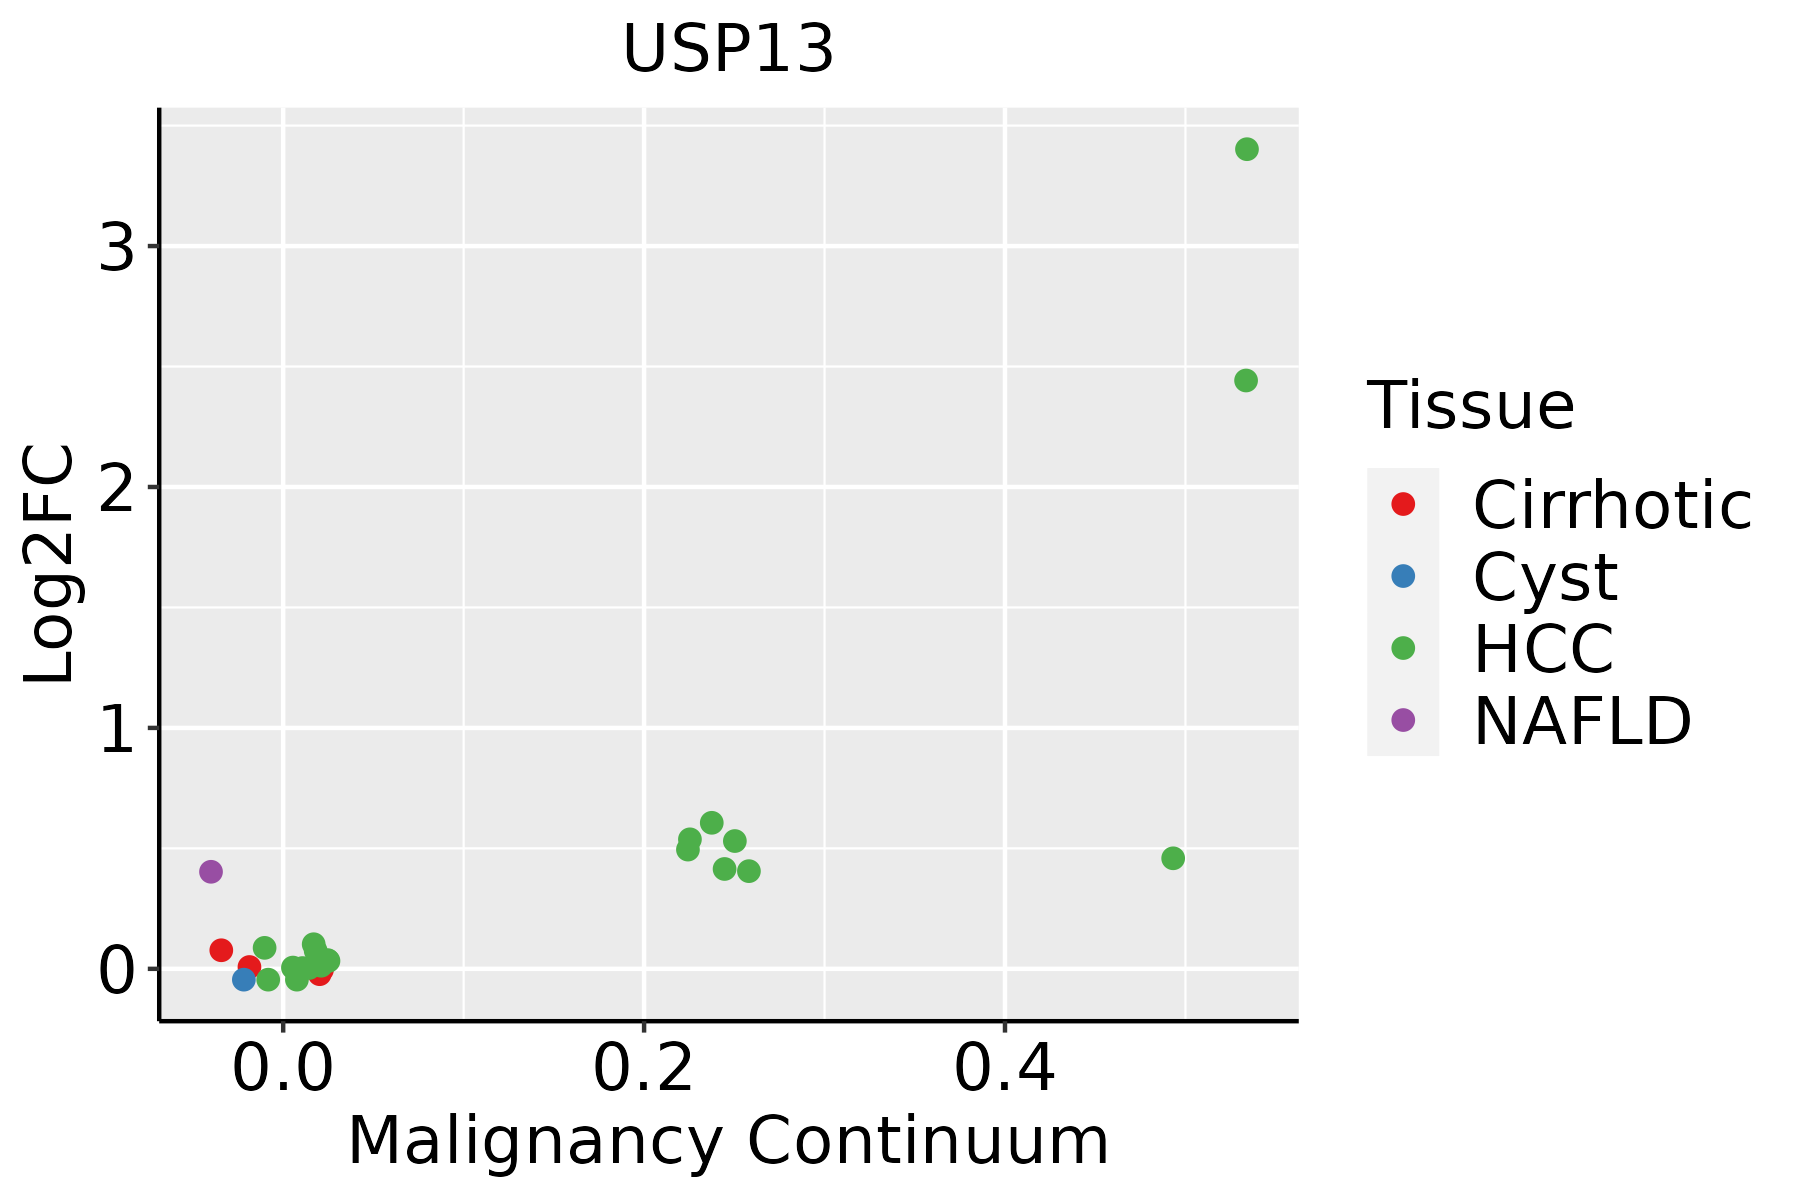 | HCC: Hepatocellular carcinoma |
| NAFLD: Non-alcoholic fatty liver disease |
| ∗log2FC in expression of this searched gene in stem-like cells from each diseased tissue sample relative to stem-like cells in normal samples in each tissue plotted against the malignancy continuum. Samples are colored based on if they are from different disease stage. |
Top |
Malignant transformation related pathway analysis |
| Find out the enriched GO biological processes and KEGG pathways involved in transition from healthy to precancer to cancer |
| Tissue | Disease Stage | Enriched GO biological Processes |
| Colorectum | AD |  |
| Colorectum | SER |  |
| Colorectum | MSS |  |
| Colorectum | MSI-H |  |
| Colorectum | FAP |  |
| ∗Top 15 enriched GO BP terms are showed in the bar plot of each disease state in each tissue. Each row represents a significant GO biological process which is colored according to the -log10(p.adjust). |
| Page: 1 2 3 4 5 6 7 8 9 |
| GO ID | Tissue | Disease Stage | Description | Gene Ratio | Bg Ratio | pvalue | p.adjust | Count |
| GO:0010498111 | Esophagus | ESCC | proteasomal protein catabolic process | 369/8552 | 490/18723 | 1.13e-41 | 1.80e-38 | 369 |
| GO:0042176111 | Esophagus | ESCC | regulation of protein catabolic process | 280/8552 | 391/18723 | 8.65e-26 | 2.39e-23 | 280 |
| GO:0031647111 | Esophagus | ESCC | regulation of protein stability | 223/8552 | 298/18723 | 5.76e-25 | 1.52e-22 | 223 |
| GO:0009896111 | Esophagus | ESCC | positive regulation of catabolic process | 332/8552 | 492/18723 | 4.36e-23 | 9.22e-21 | 332 |
| GO:0034976111 | Esophagus | ESCC | response to endoplasmic reticulum stress | 192/8552 | 256/18723 | 7.15e-22 | 1.30e-19 | 192 |
| GO:0031331111 | Esophagus | ESCC | positive regulation of cellular catabolic process | 292/8552 | 427/18723 | 8.67e-22 | 1.53e-19 | 292 |
| GO:1903362111 | Esophagus | ESCC | regulation of cellular protein catabolic process | 188/8552 | 255/18723 | 5.12e-20 | 6.62e-18 | 188 |
| GO:0045862111 | Esophagus | ESCC | positive regulation of proteolysis | 256/8552 | 372/18723 | 7.88e-20 | 9.43e-18 | 256 |
| GO:001050617 | Esophagus | ESCC | regulation of autophagy | 220/8552 | 317/18723 | 6.72e-18 | 6.36e-16 | 220 |
| GO:1903050111 | Esophagus | ESCC | regulation of proteolysis involved in cellular protein catabolic process | 163/8552 | 221/18723 | 1.44e-17 | 1.27e-15 | 163 |
| GO:0061136111 | Esophagus | ESCC | regulation of proteasomal protein catabolic process | 142/8552 | 187/18723 | 2.40e-17 | 2.00e-15 | 142 |
| GO:0045732111 | Esophagus | ESCC | positive regulation of protein catabolic process | 167/8552 | 231/18723 | 1.47e-16 | 1.14e-14 | 167 |
| GO:0050821111 | Esophagus | ESCC | protein stabilization | 140/8552 | 191/18723 | 6.50e-15 | 3.61e-13 | 140 |
| GO:1903364111 | Esophagus | ESCC | positive regulation of cellular protein catabolic process | 117/8552 | 155/18723 | 3.25e-14 | 1.66e-12 | 117 |
| GO:1901800110 | Esophagus | ESCC | positive regulation of proteasomal protein catabolic process | 91/8552 | 114/18723 | 6.74e-14 | 3.34e-12 | 91 |
| GO:1903052110 | Esophagus | ESCC | positive regulation of proteolysis involved in cellular protein catabolic process | 101/8552 | 133/18723 | 9.58e-13 | 4.19e-11 | 101 |
| GO:003650315 | Esophagus | ESCC | ERAD pathway | 82/8552 | 107/18723 | 5.80e-11 | 1.84e-09 | 82 |
| GO:1905897111 | Esophagus | ESCC | regulation of response to endoplasmic reticulum stress | 63/8552 | 82/18723 | 8.16e-09 | 1.66e-07 | 63 |
| GO:190589813 | Esophagus | ESCC | positive regulation of response to endoplasmic reticulum stress | 29/8552 | 35/18723 | 6.61e-06 | 6.75e-05 | 29 |
| GO:007064612 | Esophagus | ESCC | protein modification by small protein removal | 95/8552 | 157/18723 | 1.25e-04 | 8.56e-04 | 95 |
| Page: 1 2 3 4 |
| Pathway ID | Tissue | Disease Stage | Description | Gene Ratio | Bg Ratio | pvalue | p.adjust | qvalue | Count |
| Page: 1 |
Top |
Cell-cell communication analysis |
| Identification of potential cell-cell interactions between two cell types and their ligand-receptor pairs for different disease states |
| Ligand | Receptor | LRpair | Pathway | Tissue | Disease Stage |
| Page: 1 |
Top |
Single-cell gene regulatory network inference analysis |
| Find out the significant the regulons (TFs) and the target genes of each regulon across cell types for different disease states |
| TF | Cell Type | Tissue | Disease Stage | Target Gene | RSS | Regulon Activity |
| ∗The dot plots of a searched regulon are shown for all cell subpopulations in each disease state of each tissue based on the regulon specific score inferred using pySCENIC and by calculating the average expression. |
| Page: 1 |
Top |
Somatic mutation of malignant transformation related genes |
| Annotation of somatic variants for genes involved in malignant transformation |
| Hugo Symbol | Variant Class | Variant Classification | dbSNP RS | HGVSc | HGVSp | HGVSp Short | SWISSPROT | BIOTYPE | SIFT | PolyPhen | Tumor Sample Barcode | Tissue | Histology | Sex | Age | Stage | Therapy Types | Drugs | Outcome |
| USP13 | SNV | Missense_Mutation | novel | c.1117G>C | p.Asp373His | p.D373H | Q92995 | protein_coding | deleterious(0.01) | benign(0.118) | TCGA-A2-A0CR-01 | Breast | breast invasive carcinoma | Female | <65 | I/II | Chemotherapy | adriamycin | CR |
| USP13 | SNV | Missense_Mutation | c.1960G>C | p.Asp654His | p.D654H | Q92995 | protein_coding | deleterious(0) | probably_damaging(0.998) | TCGA-A8-A08Z-01 | Breast | breast invasive carcinoma | Female | >=65 | III/IV | Unknown | Unknown | SD | |
| USP13 | SNV | Missense_Mutation | novel | c.169N>C | p.Asn57His | p.N57H | Q92995 | protein_coding | deleterious(0) | benign(0.007) | TCGA-AN-A046-01 | Breast | breast invasive carcinoma | Female | >=65 | I/II | Unknown | Unknown | SD |
| USP13 | SNV | Missense_Mutation | rs201476527 | c.727N>A | p.Gly243Arg | p.G243R | Q92995 | protein_coding | deleterious(0.02) | probably_damaging(0.948) | TCGA-AN-A046-01 | Breast | breast invasive carcinoma | Female | >=65 | I/II | Unknown | Unknown | SD |
| USP13 | SNV | Missense_Mutation | c.2390N>A | p.Pro797His | p.P797H | Q92995 | protein_coding | deleterious(0) | probably_damaging(0.998) | TCGA-AO-A128-01 | Breast | breast invasive carcinoma | Female | <65 | I/II | Chemotherapy | doxorubicin | SD | |
| USP13 | deletion | Frame_Shift_Del | c.347delN | p.Leu118Ter | p.L118* | Q92995 | protein_coding | TCGA-D8-A1XK-01 | Breast | breast invasive carcinoma | Female | <65 | I/II | Chemotherapy | doxorubicine+cyclophosphamide | SD | |||
| USP13 | SNV | Missense_Mutation | novel | c.2147C>T | p.Ala716Val | p.A716V | Q92995 | protein_coding | tolerated(0.15) | benign(0.013) | TCGA-2W-A8YY-01 | Cervix | cervical & endocervical cancer | Female | <65 | I/II | Chemotherapy | cisplatin | CR |
| USP13 | SNV | Missense_Mutation | novel | c.2446G>A | p.Gly816Arg | p.G816R | Q92995 | protein_coding | deleterious(0) | probably_damaging(1) | TCGA-2W-A8YY-01 | Cervix | cervical & endocervical cancer | Female | <65 | I/II | Chemotherapy | cisplatin | CR |
| USP13 | SNV | Missense_Mutation | novel | c.223N>A | p.Glu75Lys | p.E75K | Q92995 | protein_coding | tolerated(0.47) | benign(0.023) | TCGA-JW-A5VL-01 | Cervix | cervical & endocervical cancer | Female | <65 | I/II | Unknown | Unknown | SD |
| USP13 | SNV | Missense_Mutation | novel | c.1586N>A | p.Arg529Lys | p.R529K | Q92995 | protein_coding | tolerated(0.74) | benign(0.216) | TCGA-ZJ-AAXD-01 | Cervix | cervical & endocervical cancer | Female | <65 | III/IV | Unknown | Unknown | SD |
| Page: 1 2 3 4 5 6 7 8 9 10 11 12 13 |
Top |
Related drugs of malignant transformation related genes |
| Identification of chemicals and drugs interact with genes involved in malignant transfromation |
| (DGIdb 4.0) |
| Entrez ID | Symbol | Category | Interaction Types | Drug Claim Name | Drug Name | PMIDs |
| Page: 1 |

Copyright 2023-Present -The University of Texas Health Science Center at Houston |