Schematic overview of the cellular and molecular mechanisms involved in the cancer progression, including the proposed cellular and molecular mechanisms in cancer cells trajectory. AT1: alveolar type 1 cells; AT2: alveolar type 2 cells; AAH: atypical adenomatous hyperplasia; AIS: adenocarcinoma in situ; MIA: minimally invasive adenocarcinoma; IA: invasive adenocarcinoma; EMT: epithelial-mesenchymal transition

Home

Download

Statistics

Help

Contact

Center for Computational Systems Medicine
leaf

Gene summary

leaf

Malignant transformation analysis

leaf

Malignant transformation related pathway analysis

leaf

Cell-cell communication analysis

leaf

Single-cell gene regulatory network inference analysis

leaf

Somatic mutation of malignant transformation related genes

leaf

Related drugs of malignant transformation related genes

Gene: USP10

Gene summary for USP10

check button Gene summary.

Gene informationSpeciesHuman
Gene symbol

USP10

Gene ID

9100

Gene nameubiquitin specific peptidase 10
Gene AliasUBPO
Cytomap16q24.1
Gene Typeprotein-coding
GO ID

GO:0000731

UniProtAcc

Q14694


Top

Malignant transformation analysis

check button Identification of the aberrant gene expression in precancerous and cancerous lesions by comparing the gene expression of stem-like cells in diseased tissues with normal stem cells
check button Malignant transformation involving gene list.
Entrez IDSymbolReplicatesSpeciesOrganTissueAdj P-valueLog2FCMalignancy
9100USP10LZE2THumanEsophagusESCC6.65e-037.39e-010.082
9100USP10LZE4THumanEsophagusESCC2.01e-237.90e-010.0811
9100USP10LZE7THumanEsophagusESCC7.41e-116.87e-010.0667
9100USP10LZE8THumanEsophagusESCC5.54e-123.41e-010.067
9100USP10LZE20THumanEsophagusESCC1.99e-059.52e-020.0662
9100USP10LZE22THumanEsophagusESCC1.04e-022.14e-010.068
9100USP10LZE24THumanEsophagusESCC1.50e-124.96e-010.0596
9100USP10LZE21THumanEsophagusESCC1.81e-023.77e-010.0655
9100USP10LZE6THumanEsophagusESCC3.66e-051.70e-010.0845
9100USP10P1T-EHumanEsophagusESCC2.53e-045.62e-010.0875
9100USP10P2T-EHumanEsophagusESCC1.01e-316.22e-010.1177
9100USP10P4T-EHumanEsophagusESCC1.45e-235.98e-010.1323
9100USP10P5T-EHumanEsophagusESCC1.33e-205.15e-010.1327
9100USP10P8T-EHumanEsophagusESCC4.49e-266.35e-010.0889
9100USP10P9T-EHumanEsophagusESCC9.94e-123.36e-010.1131
9100USP10P10T-EHumanEsophagusESCC2.47e-212.59e-010.116
9100USP10P11T-EHumanEsophagusESCC2.57e-075.31e-010.1426
9100USP10P12T-EHumanEsophagusESCC3.71e-184.73e-010.1122
9100USP10P15T-EHumanEsophagusESCC3.27e-308.75e-010.1149
9100USP10P16T-EHumanEsophagusESCC2.43e-284.80e-010.1153
Page: 1 2 3 4 5 6 

check button Transcriptomic changes along malignancy continuum.
TissueExpression DynamicsAbbreviation
EsophagusThe image shows the transcriptomic changes along malignancy continuum.log2FC in expression of this searched gene in stem-like cells from each diseased tissue sample relative to stem-like cells in normal samples in each tissue plotted against the malignancy continuum. Samples are colored based on if they are from different disease stage.
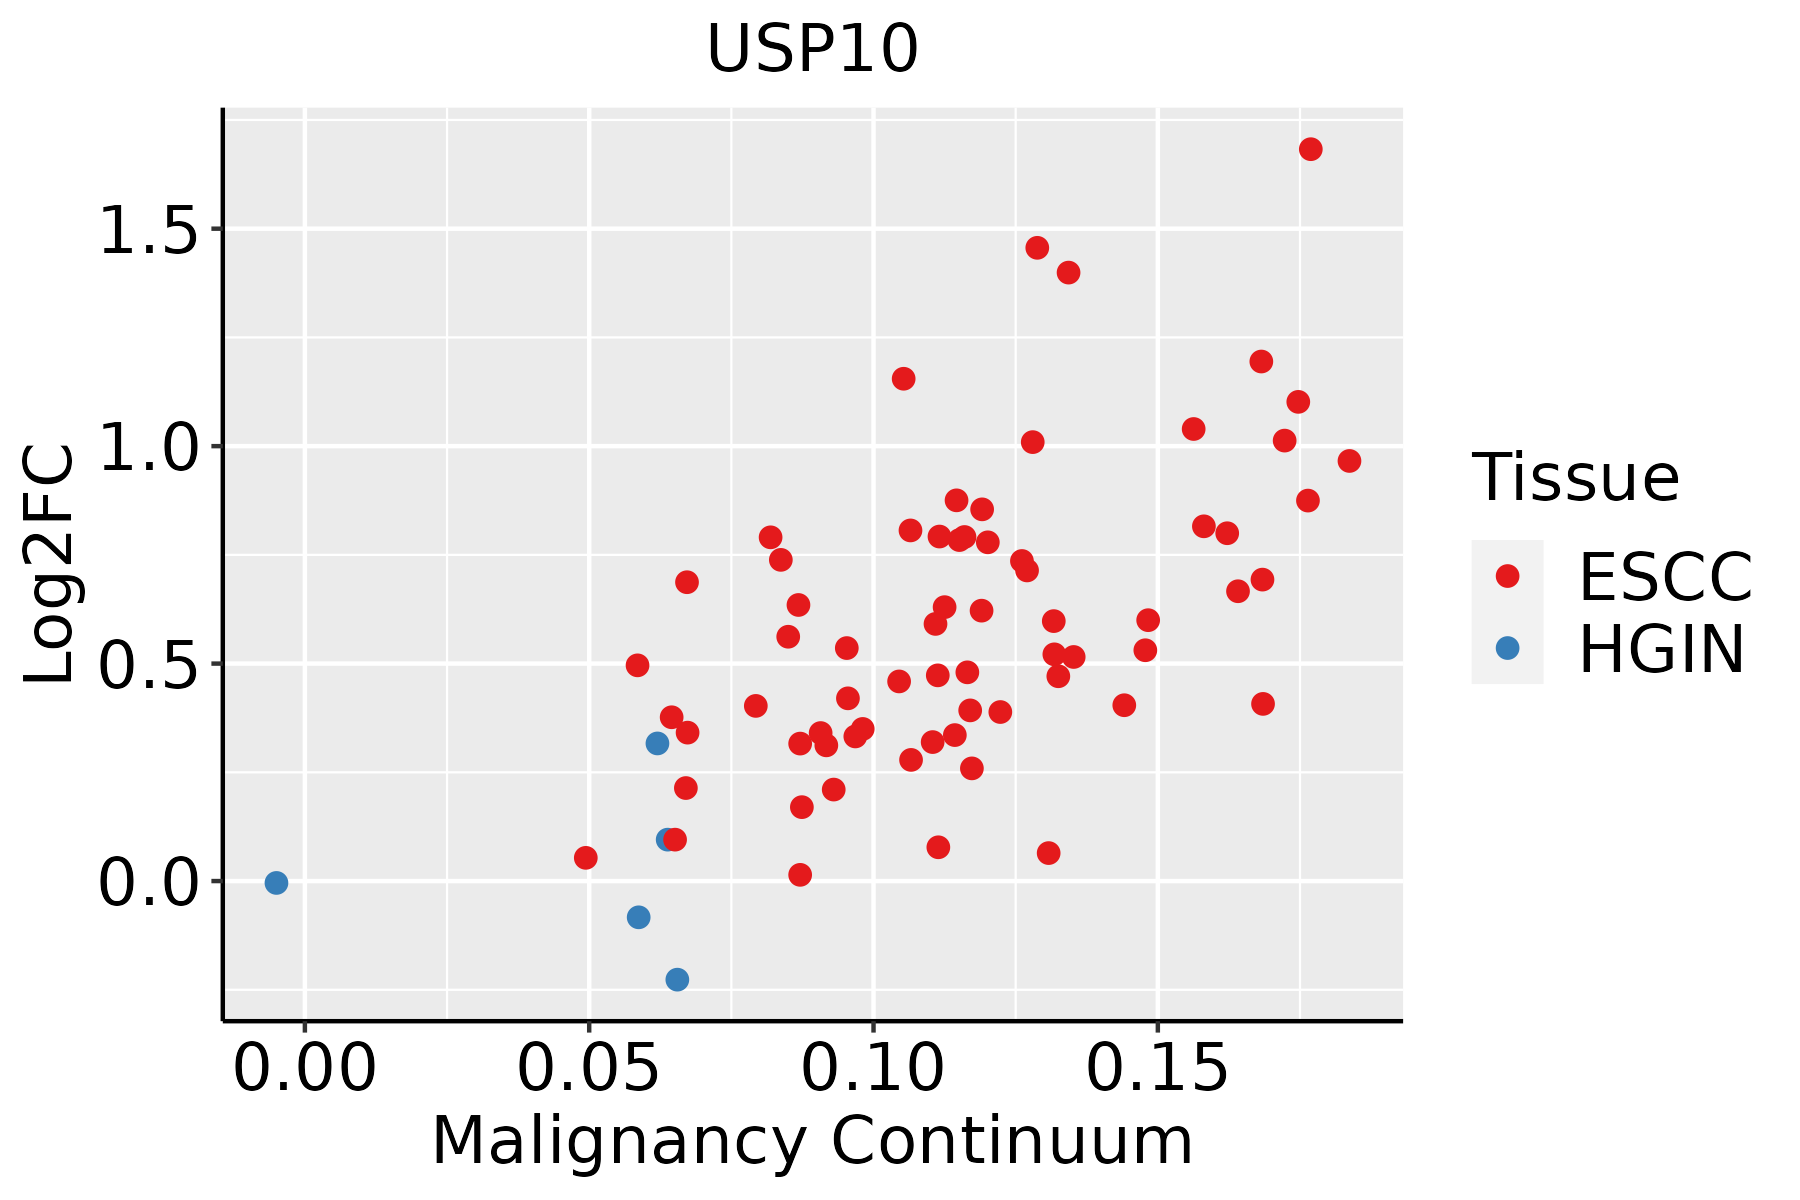
ESCC: Esophageal squamous cell carcinoma
HGIN: High-grade intraepithelial neoplasias
LGIN: Low-grade intraepithelial neoplasias
LiverThe image shows the transcriptomic changes along malignancy continuum.log2FC in expression of this searched gene in stem-like cells from each diseased tissue sample relative to stem-like cells in normal samples in each tissue plotted against the malignancy continuum. Samples are colored based on if they are from different disease stage.HCC: Hepatocellular carcinoma
NAFLD: Non-alcoholic fatty liver disease
Oral CavityThe image shows the transcriptomic changes along malignancy continuum.log2FC in expression of this searched gene in stem-like cells from each diseased tissue sample relative to stem-like cells in normal samples in each tissue plotted against the malignancy continuum. Samples are colored based on if they are from different disease stage.
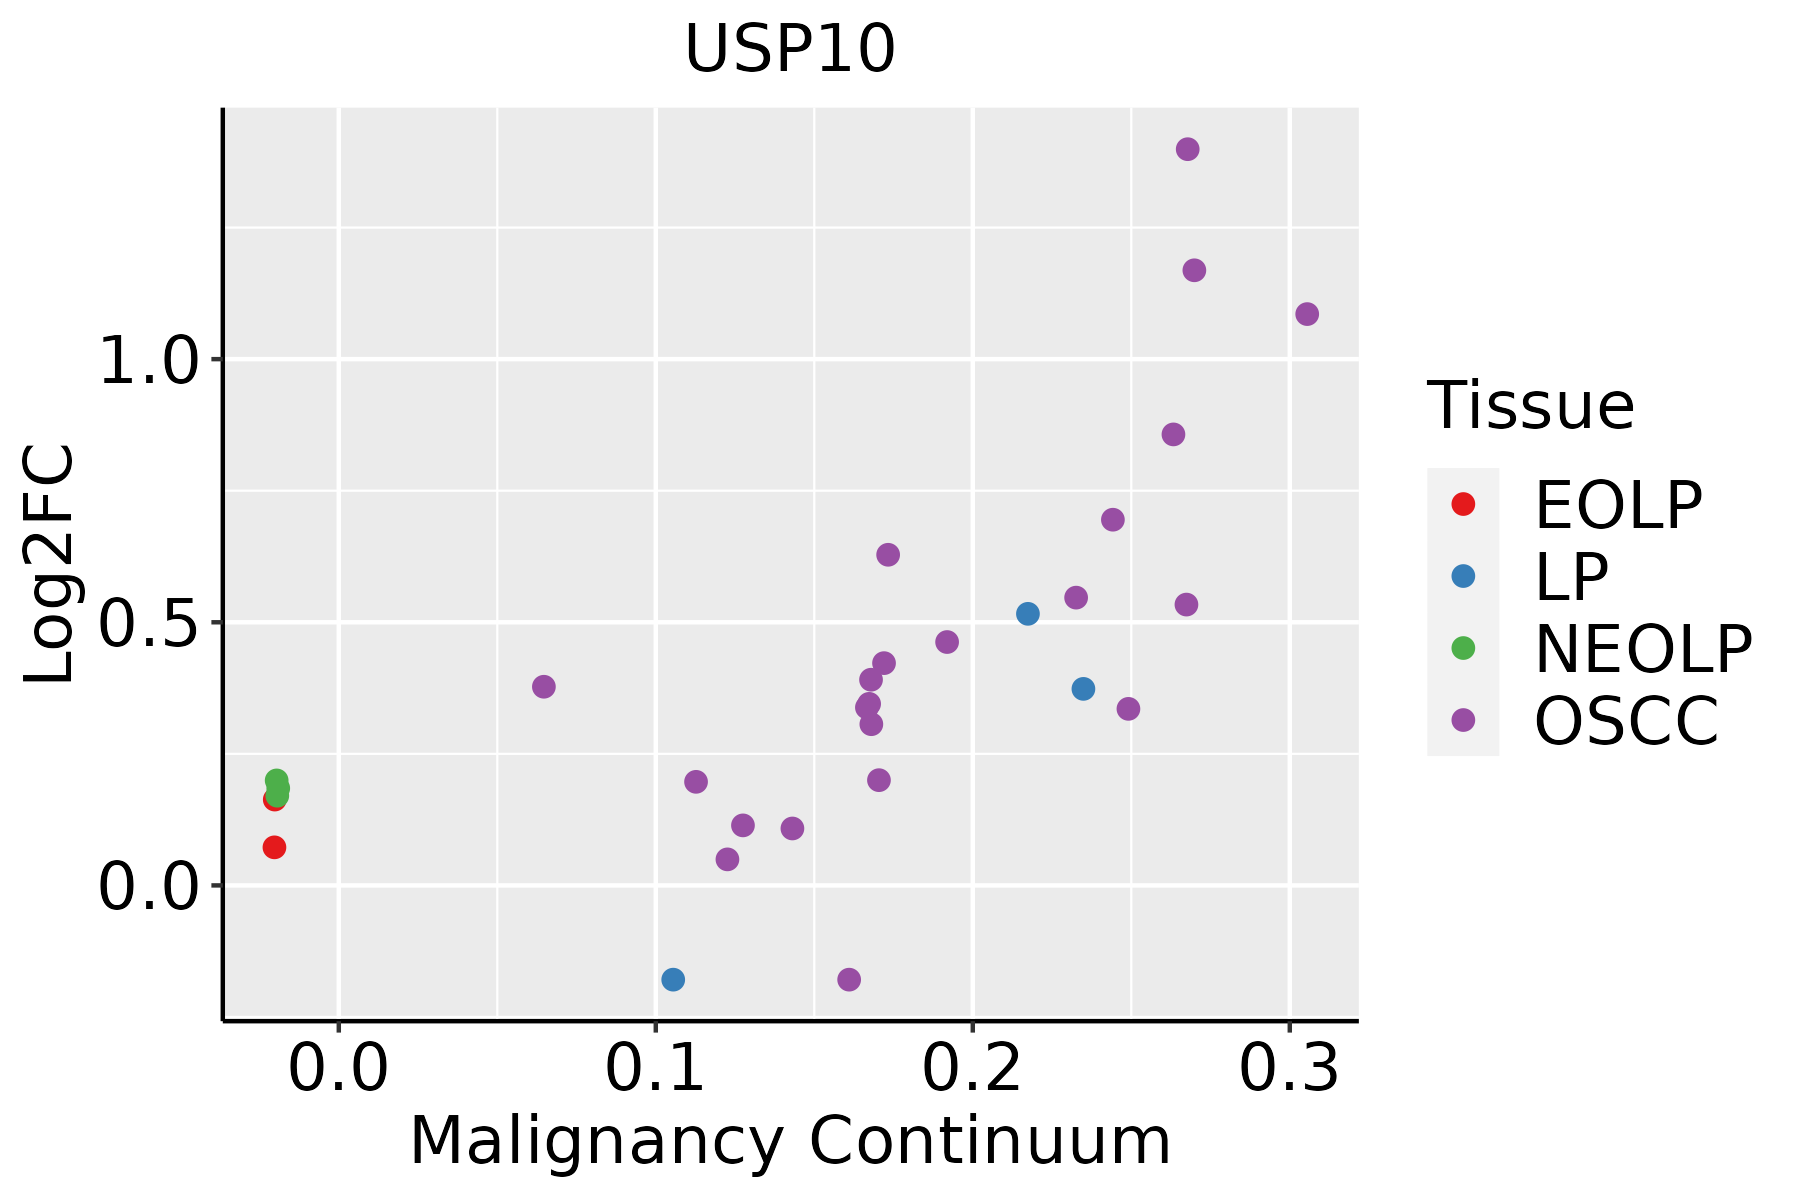
EOLP: Erosive Oral lichen planus
LP: leukoplakia
NEOLP: Non-erosive oral lichen planus
OSCC: Oral squamous cell carcinoma
SkinThe image shows the transcriptomic changes along malignancy continuum.log2FC in expression of this searched gene in stem-like cells from each diseased tissue sample relative to stem-like cells in normal samples in each tissue plotted against the malignancy continuum. Samples are colored based on if they are from different disease stage.
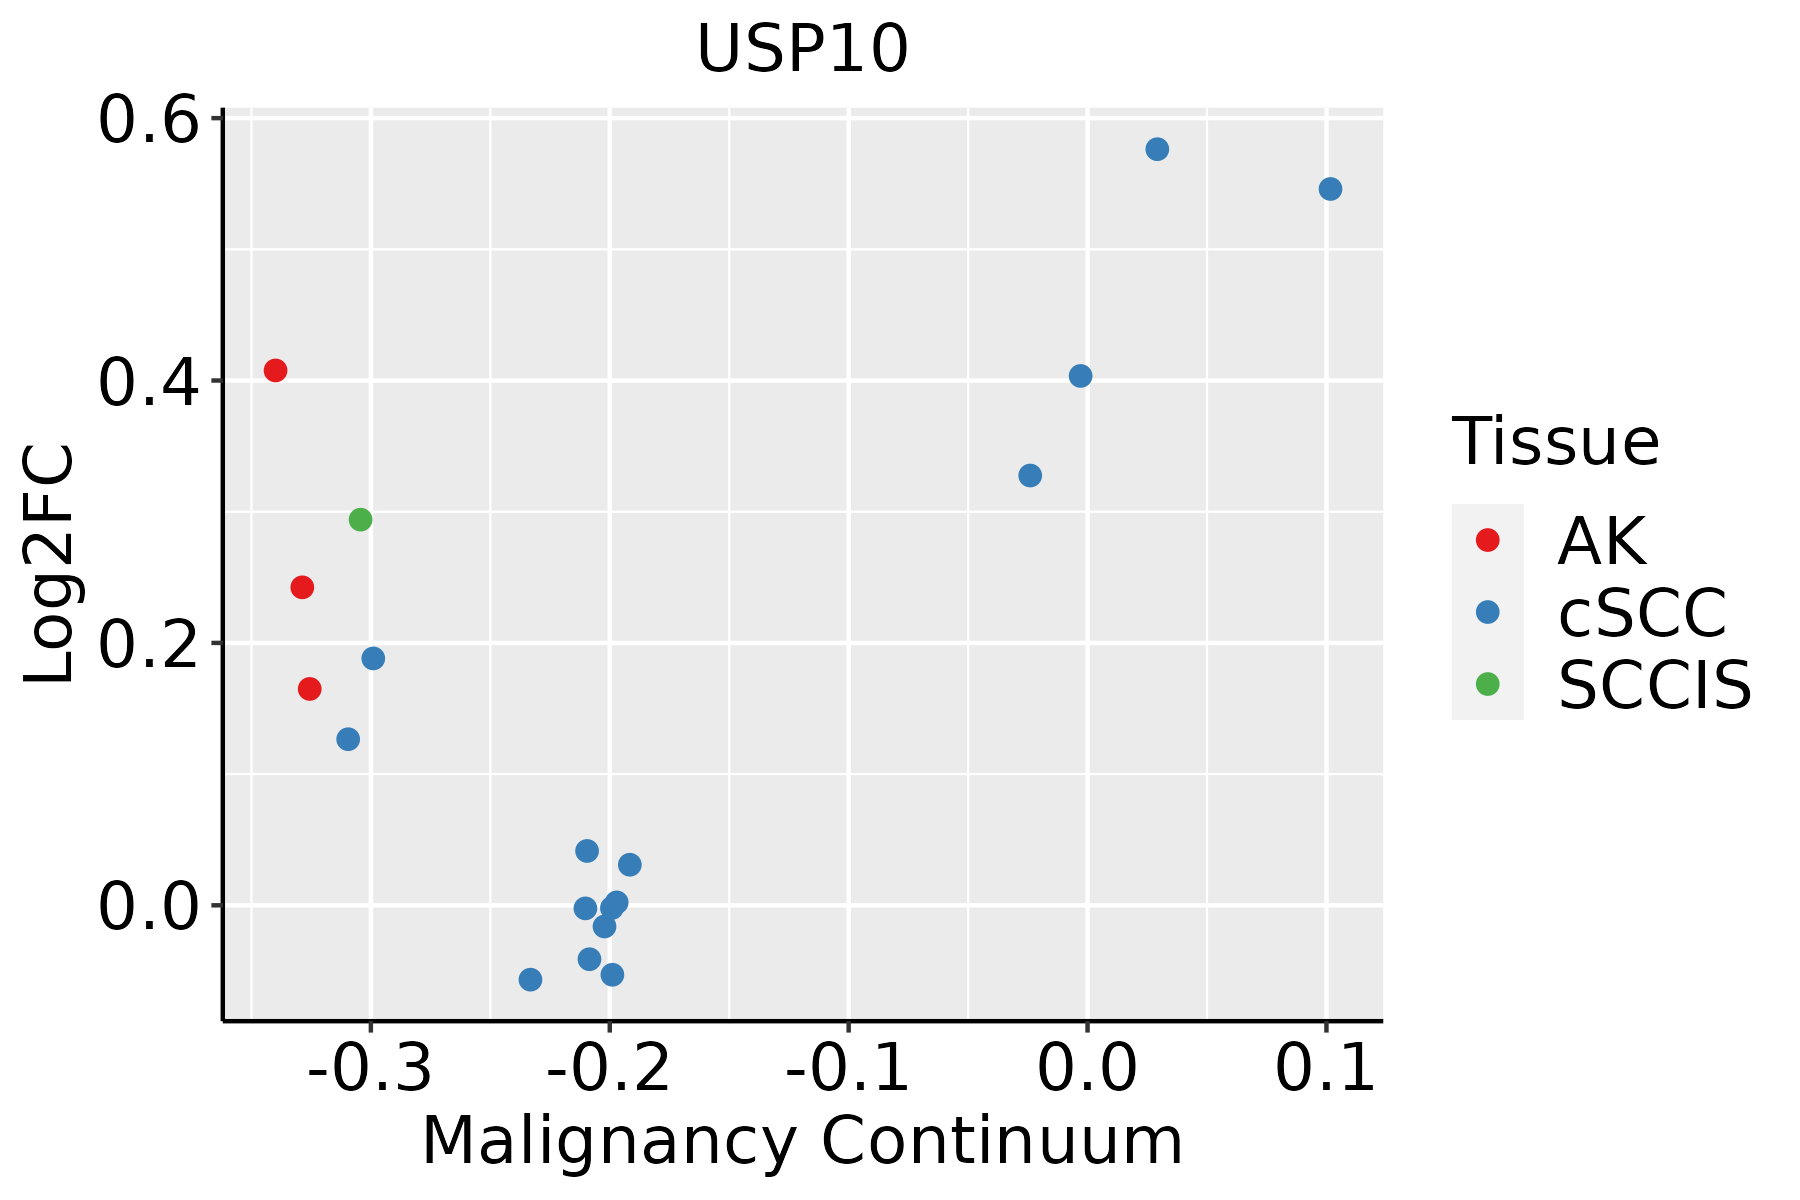
AK: Actinic keratosis
cSCC: Cutaneous squamous cell carcinoma
SCCIS:squamous cell carcinoma in situ
ThyroidThe image shows the transcriptomic changes along malignancy continuum.log2FC in expression of this searched gene in stem-like cells from each diseased tissue sample relative to stem-like cells in normal samples in each tissue plotted against the malignancy continuum. Samples are colored based on if they are from different disease stage.ATC: Anaplastic thyroid cancer
HT: Hashimoto's thyroiditis
PTC: Papillary thyroid cancer
∗log2FC in expression of this searched gene in stem-like cells from each diseased tissue sample relative to stem-like cells in normal samples in each tissue plotted against the malignancy continuum. Samples are colored based on if they are from different disease stage.

Top

Malignant transformation related pathway analysis

check buttonFind out the enriched GO biological processes and KEGG pathways involved in transition from healthy to precancer to cancer
check button Figure of enriched GO biological processes.
TissueDisease StageEnriched GO biological Processes
ColorectumADGO analysis - Figure of enriched GO biological processes: Top 15 enriched GO BP terms are showed in the bar plot of each disease state in each tissue. Each row represents a significant GO biological process which is colored according to the -log10(p.adjust).
ColorectumSERGO analysis - Figure of enriched GO biological processes: Top 15 enriched GO BP terms are showed in the bar plot of each disease state in each tissue. Each row represents a significant GO biological process which is colored according to the -log10(p.adjust).
ColorectumMSSGO analysis - Figure of enriched GO biological processes: Top 15 enriched GO BP terms are showed in the bar plot of each disease state in each tissue. Each row represents a significant GO biological process which is colored according to the -log10(p.adjust).
ColorectumMSI-HGO analysis - Figure of enriched GO biological processes: Top 15 enriched GO BP terms are showed in the bar plot of each disease state in each tissue. Each row represents a significant GO biological process which is colored according to the -log10(p.adjust).
ColorectumFAPGO analysis - Figure of enriched GO biological processes: Top 15 enriched GO BP terms are showed in the bar plot of each disease state in each tissue. Each row represents a significant GO biological process which is colored according to the -log10(p.adjust).
∗Top 15 enriched GO BP terms are showed in the bar plot of each disease state in each tissue. Each row represents a significant GO biological process which is colored according to the -log10(p.adjust).
Page: 1 2 3 4 5 6 7 8 9 

check button Enriched GO biological processes.
GO IDTissueDisease StageDescriptionGene RatioBg Ratiopvaluep.adjustCount
GO:001050617EsophagusESCCregulation of autophagy220/8552317/187236.72e-186.36e-16220
GO:0072331111EsophagusESCCsignal transduction by p53 class mediator121/8552163/187239.61e-144.69e-12121
GO:0010563111EsophagusESCCnegative regulation of phosphorus metabolic process274/8552442/187232.32e-129.41e-11274
GO:0045936111EsophagusESCCnegative regulation of phosphate metabolic process273/8552441/187233.18e-121.25e-10273
GO:0043122110EsophagusESCCregulation of I-kappaB kinase/NF-kappaB signaling167/8552249/187236.11e-122.32e-10167
GO:007189716EsophagusESCCDNA biosynthetic process127/8552180/187231.04e-113.85e-10127
GO:0051348111EsophagusESCCnegative regulation of transferase activity177/8552268/187231.08e-114.00e-10177
GO:007190016EsophagusESCCregulation of protein serine/threonine kinase activity227/8552359/187231.12e-114.10e-10227
GO:000724919EsophagusESCCI-kappaB kinase/NF-kappaB signaling183/8552281/187233.02e-111.01e-09183
GO:0042326111EsophagusESCCnegative regulation of phosphorylation237/8552385/187231.86e-105.33e-09237
GO:0001933111EsophagusESCCnegative regulation of protein phosphorylation213/8552342/187233.54e-109.76e-09213
GO:001631110EsophagusESCCdephosphorylation251/8552417/187231.26e-092.99e-08251
GO:003367319EsophagusESCCnegative regulation of kinase activity154/8552237/187231.38e-093.27e-08154
GO:000646920EsophagusESCCnegative regulation of protein kinase activity140/8552212/187231.53e-093.56e-08140
GO:004277014EsophagusESCCsignal transduction in response to DNA damage117/8552172/187232.38e-095.32e-08117
GO:000647018EsophagusESCCprotein dephosphorylation177/8552281/187233.13e-096.72e-08177
GO:004578527EsophagusESCCpositive regulation of cell adhesion255/8552437/187235.07e-089.11e-07255
GO:003109818EsophagusESCCstress-activated protein kinase signaling cascade154/8552247/187238.53e-081.44e-06154
GO:005140318EsophagusESCCstress-activated MAPK cascade147/8552239/187235.43e-077.18e-06147
GO:0030330110EsophagusESCCDNA damage response, signal transduction by p53 class mediator53/855272/187231.34e-061.63e-0553
Page: 1 2 3 4 5 6 7 8 9 10 11 12 13 14 15 16 17 18 19 20 21 

check button Enriched KEGG pathways.
Pathway IDTissueDisease StageDescriptionGene RatioBg Ratiopvaluep.adjustqvalueCount
Page: 1 

Top

Cell-cell communication analysis

check buttonIdentification of potential cell-cell interactions between two cell types and their ligand-receptor pairs for different disease states
LigandReceptorLRpairPathwayTissueDisease Stage
Page: 1 

Top

Single-cell gene regulatory network inference analysis

check buttonFind out the significant the regulons (TFs) and the target genes of each regulon across cell types for different disease states
TFCell TypeTissueDisease StageTarget GeneRSSRegulon Activity
∗The dot plots of a searched regulon are shown for all cell subpopulations in each disease state of each tissue based on the regulon specific score inferred using pySCENIC and by calculating the average expression.
Page: 1 

Top

Somatic mutation of malignant transformation related genes

check buttonAnnotation of somatic variants for genes involved in malignant transformation
Hugo SymbolVariant ClassVariant ClassificationdbSNP RSHGVScHGVSpHGVSp ShortSWISSPROTBIOTYPESIFTPolyPhenTumor Sample BarcodeTissueHistologySexAgeStageTherapy TypesDrugsOutcome
USP10SNVMissense_Mutationc.225N>Tp.Leu75Phep.L75FQ14694protein_codingtolerated_low_confidence(0.36)possibly_damaging(0.517)TCGA-D8-A1JF-01Breastbreast invasive carcinomaFemale>=65III/IVUnknownUnknownSD
USP10SNVMissense_Mutationrs373590750c.1790G>Ap.Arg597Hisp.R597HQ14694protein_codingdeleterious(0.03)possibly_damaging(0.471)TCGA-D8-A1XQ-01Breastbreast invasive carcinomaFemale>=65I/IIUnknownUnknownSD
USP10insertionIn_Frame_Insnovelc.1844_1844+1insCATp.Arg615delinsSerMetp.R615delinsSMQ14694protein_codingTCGA-A8-A06P-01Breastbreast invasive carcinomaFemale<65III/IVUnspecificSD
USP10insertionNonsense_Mutationnovelc.1542_1543insGTCTTGGTTAGGTCAAGTTCTTGAATACAp.Asn515ValfsTer8p.N515Vfs*8Q14694protein_codingTCGA-AN-A0FW-01Breastbreast invasive carcinomaFemale>=65III/IVUnknownUnknownSD
USP10insertionFrame_Shift_Insnovelc.1114_1115insATGGAp.Ala372AspfsTer27p.A372Dfs*27Q14694protein_codingTCGA-AO-A0JD-01Breastbreast invasive carcinomaFemale<65III/IVChemotherapycyclophosphamideSD
USP10SNVMissense_Mutationc.1934G>Ap.Arg645Hisp.R645HQ14694protein_codingtolerated(0.25)benign(0.038)TCGA-2W-A8YY-01Cervixcervical & endocervical cancerFemale<65I/IIChemotherapycisplatinCR
USP10SNVMissense_Mutationc.629N>Tp.Pro210Leup.P210LQ14694protein_codingdeleterious_low_confidence(0.04)possibly_damaging(0.651)TCGA-DS-A7WF-01Cervixcervical & endocervical cancerFemale<65I/IIChemotherapycisplatinPD
USP10SNVMissense_Mutationrs780433322c.1783G>Ap.Val595Ilep.V595IQ14694protein_codingtolerated(0.51)benign(0.037)TCGA-AA-3510-01Colorectumcolon adenocarcinomaMale>=65I/IIUnknownUnknownSD
USP10SNVMissense_Mutationc.1256G>Ap.Arg419Hisp.R419HQ14694protein_codingdeleterious(0.03)probably_damaging(0.972)TCGA-AA-3852-01Colorectumcolon adenocarcinomaMale>=65I/IIUnknownUnknownPD
USP10SNVMissense_Mutationc.478N>Tp.Pro160Serp.P160SQ14694protein_codingdeleterious_low_confidence(0)probably_damaging(0.978)TCGA-AA-3864-01Colorectumcolon adenocarcinomaMale>=65I/IIUnknownUnknownSD
Page: 1 2 3 4 5 6 7 8 

Top

Related drugs of malignant transformation related genes

check buttonIdentification of chemicals and drugs interact with genes involved in malignant transfromation
(DGIdb 4.0)
Entrez IDSymbolCategoryInteraction TypesDrug Claim NameDrug NamePMIDs
Page: 1