Schematic overview of the cellular and molecular mechanisms involved in the cancer progression, including the proposed cellular and molecular mechanisms in cancer cells trajectory. AT1: alveolar type 1 cells; AT2: alveolar type 2 cells; AAH: atypical adenomatous hyperplasia; AIS: adenocarcinoma in situ; MIA: minimally invasive adenocarcinoma; IA: invasive adenocarcinoma; EMT: epithelial-mesenchymal transition

Home

Download

Statistics

Help

Contact

Center for Computational Systems Medicine
leaf

Gene summary

leaf

Malignant transformation analysis

leaf

Malignant transformation related pathway analysis

leaf

Cell-cell communication analysis

leaf

Single-cell gene regulatory network inference analysis

leaf

Somatic mutation of malignant transformation related genes

leaf

Related drugs of malignant transformation related genes

Gene: USO1

Gene summary for USO1

check button Gene summary.

Gene informationSpeciesHuman
Gene symbol

USO1

Gene ID

8615

Gene nameUSO1 vesicle transport factor
Gene AliasP115
Cytomap4q21.1
Gene Typeprotein-coding
GO ID

GO:0006810

UniProtAcc

O60763


Top

Malignant transformation analysis

check button Identification of the aberrant gene expression in precancerous and cancerous lesions by comparing the gene expression of stem-like cells in diseased tissues with normal stem cells
check button Malignant transformation involving gene list.
Entrez IDSymbolReplicatesSpeciesOrganTissueAdj P-valueLog2FCMalignancy
8615USO1LZE4THumanEsophagusESCC1.93e-103.36e-010.0811
8615USO1LZE5THumanEsophagusESCC2.09e-043.36e-010.0514
8615USO1LZE7THumanEsophagusESCC1.27e-024.57e-010.0667
8615USO1LZE8THumanEsophagusESCC2.73e-093.13e-010.067
8615USO1LZE20THumanEsophagusESCC1.35e-071.68e-010.0662
8615USO1LZE21D1HumanEsophagusHGIN5.04e-031.28e-010.0632
8615USO1LZE24THumanEsophagusESCC2.44e-103.15e-010.0596
8615USO1LZE21THumanEsophagusESCC3.30e-063.07e-010.0655
8615USO1P1T-EHumanEsophagusESCC6.57e-097.64e-010.0875
8615USO1P2T-EHumanEsophagusESCC5.95e-438.64e-010.1177
8615USO1P4T-EHumanEsophagusESCC5.19e-287.63e-010.1323
8615USO1P5T-EHumanEsophagusESCC3.54e-121.95e-010.1327
8615USO1P8T-EHumanEsophagusESCC8.66e-262.58e-010.0889
8615USO1P9T-EHumanEsophagusESCC1.94e-162.93e-010.1131
8615USO1P10T-EHumanEsophagusESCC2.91e-234.31e-010.116
8615USO1P11T-EHumanEsophagusESCC2.29e-108.23e-010.1426
8615USO1P12T-EHumanEsophagusESCC1.07e-284.68e-010.1122
8615USO1P15T-EHumanEsophagusESCC2.36e-164.23e-010.1149
8615USO1P16T-EHumanEsophagusESCC2.23e-296.26e-010.1153
8615USO1P17T-EHumanEsophagusESCC6.05e-105.57e-010.1278
Page: 1 2 3 4 5 6 7 

check button Transcriptomic changes along malignancy continuum.
TissueExpression DynamicsAbbreviation
EsophagusThe image shows the transcriptomic changes along malignancy continuum.log2FC in expression of this searched gene in stem-like cells from each diseased tissue sample relative to stem-like cells in normal samples in each tissue plotted against the malignancy continuum. Samples are colored based on if they are from different disease stage.
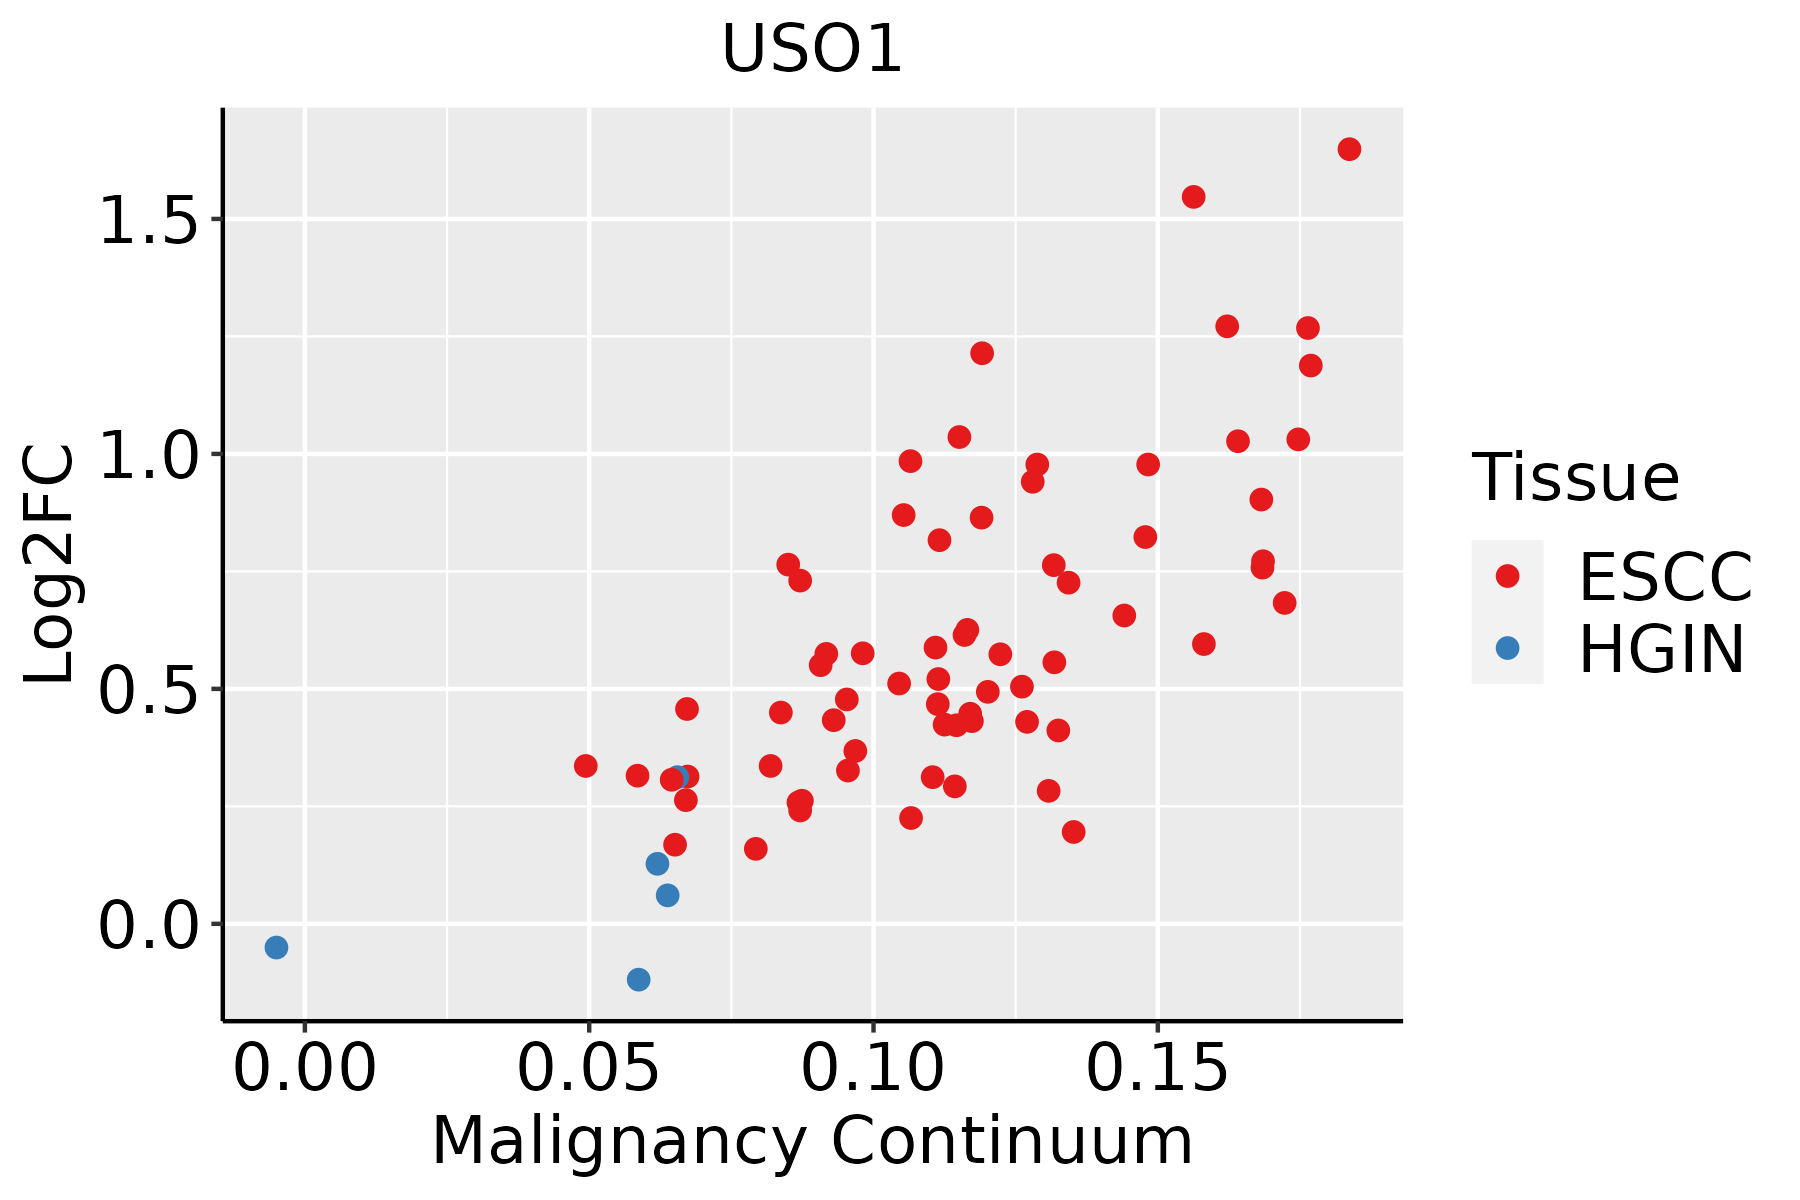
ESCC: Esophageal squamous cell carcinoma
HGIN: High-grade intraepithelial neoplasias
LGIN: Low-grade intraepithelial neoplasias
LiverThe image shows the transcriptomic changes along malignancy continuum.log2FC in expression of this searched gene in stem-like cells from each diseased tissue sample relative to stem-like cells in normal samples in each tissue plotted against the malignancy continuum. Samples are colored based on if they are from different disease stage.
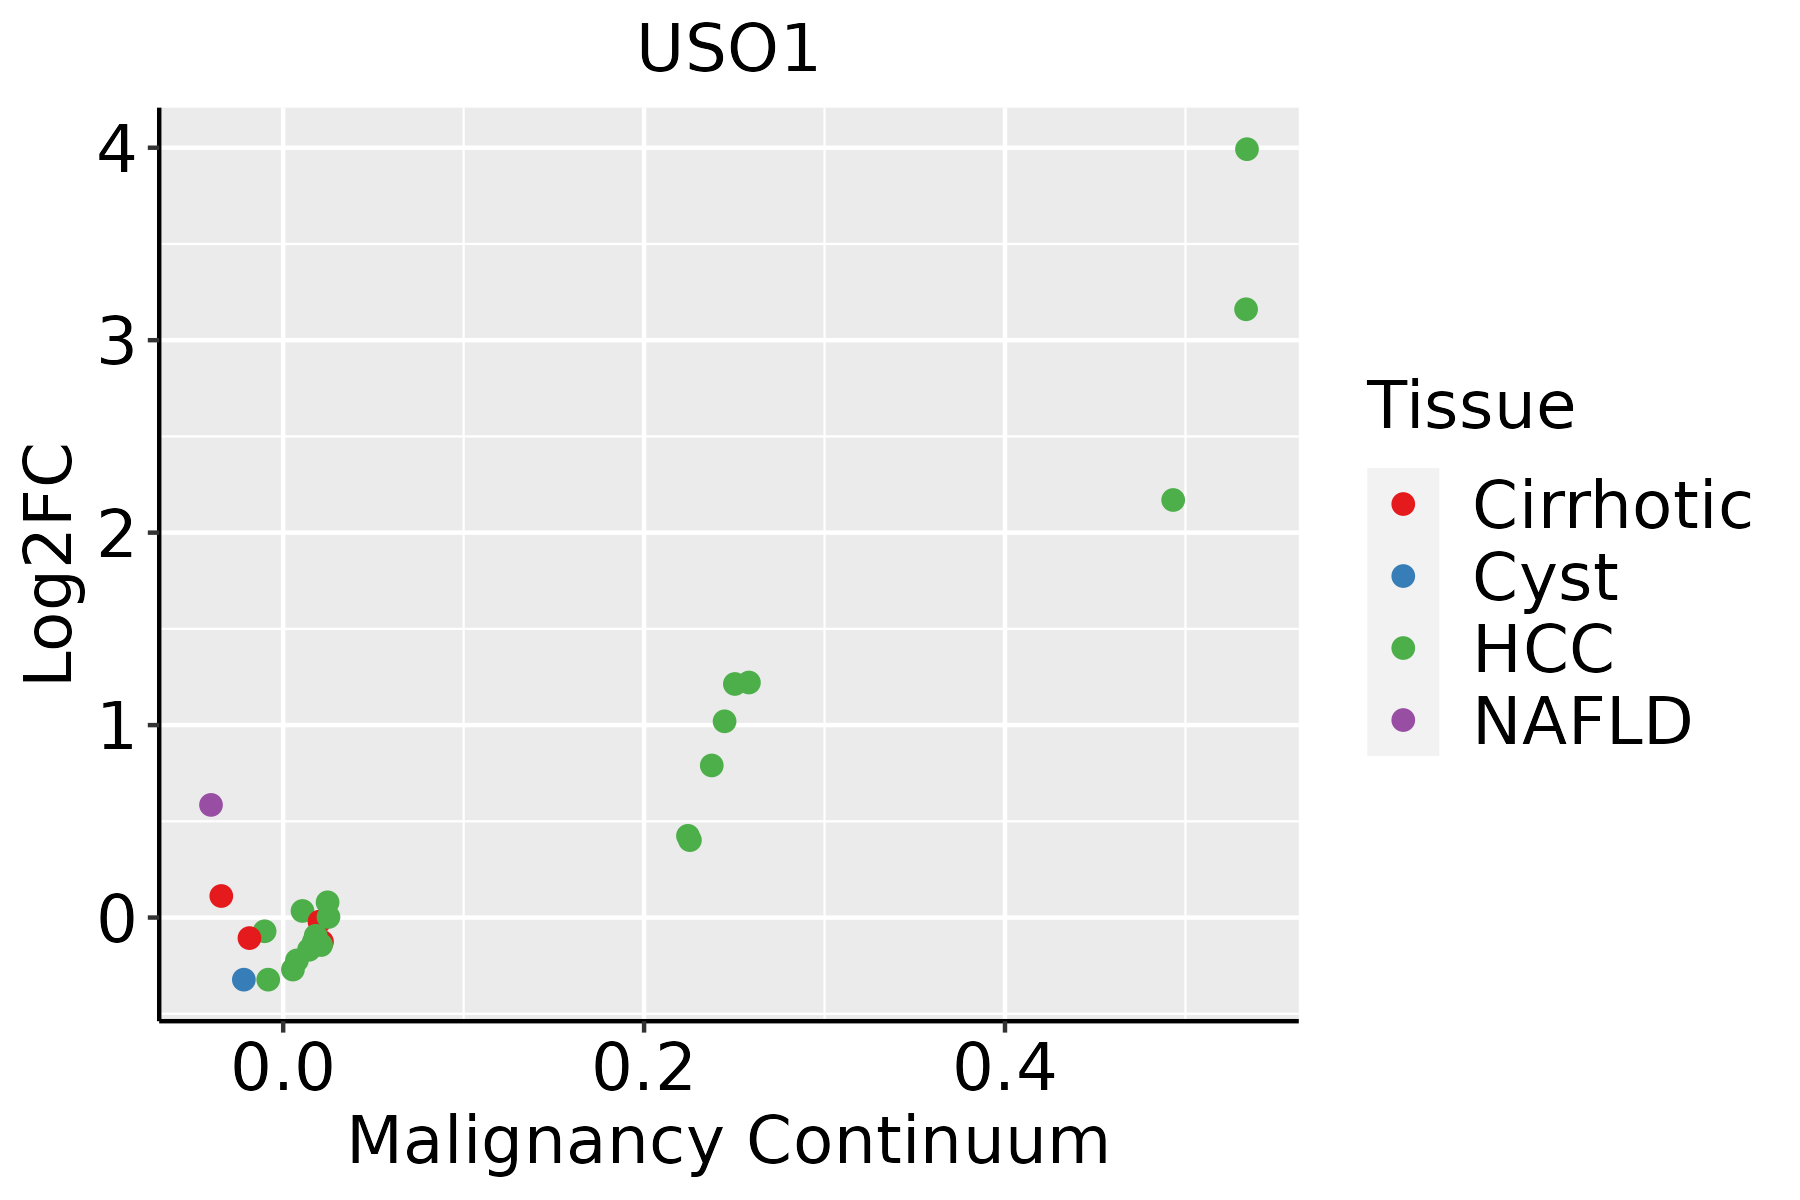
HCC: Hepatocellular carcinoma
NAFLD: Non-alcoholic fatty liver disease
Oral CavityThe image shows the transcriptomic changes along malignancy continuum.log2FC in expression of this searched gene in stem-like cells from each diseased tissue sample relative to stem-like cells in normal samples in each tissue plotted against the malignancy continuum. Samples are colored based on if they are from different disease stage.
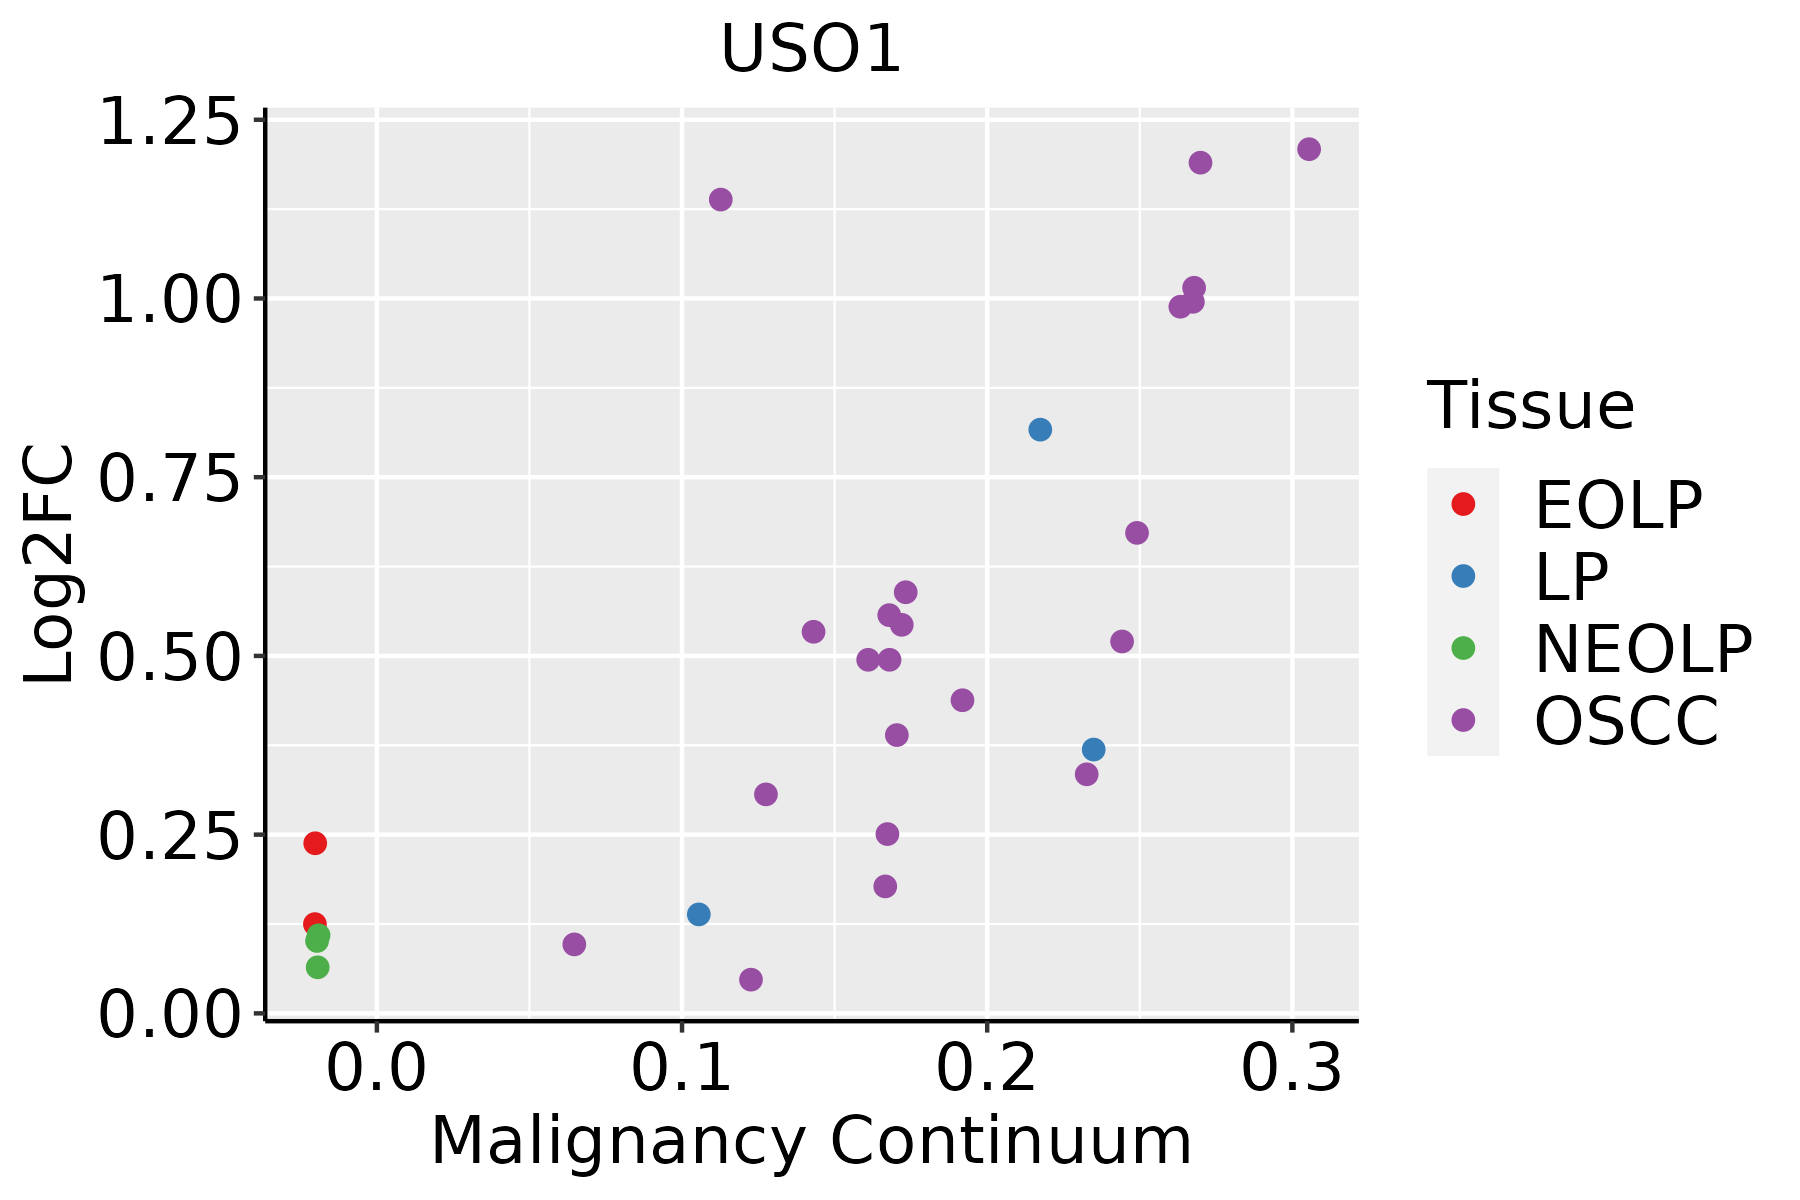
EOLP: Erosive Oral lichen planus
LP: leukoplakia
NEOLP: Non-erosive oral lichen planus
OSCC: Oral squamous cell carcinoma
ProstateThe image shows the transcriptomic changes along malignancy continuum.log2FC in expression of this searched gene in stem-like cells from each diseased tissue sample relative to stem-like cells in normal samples in each tissue plotted against the malignancy continuum. Samples are colored based on if they are from different disease stage.
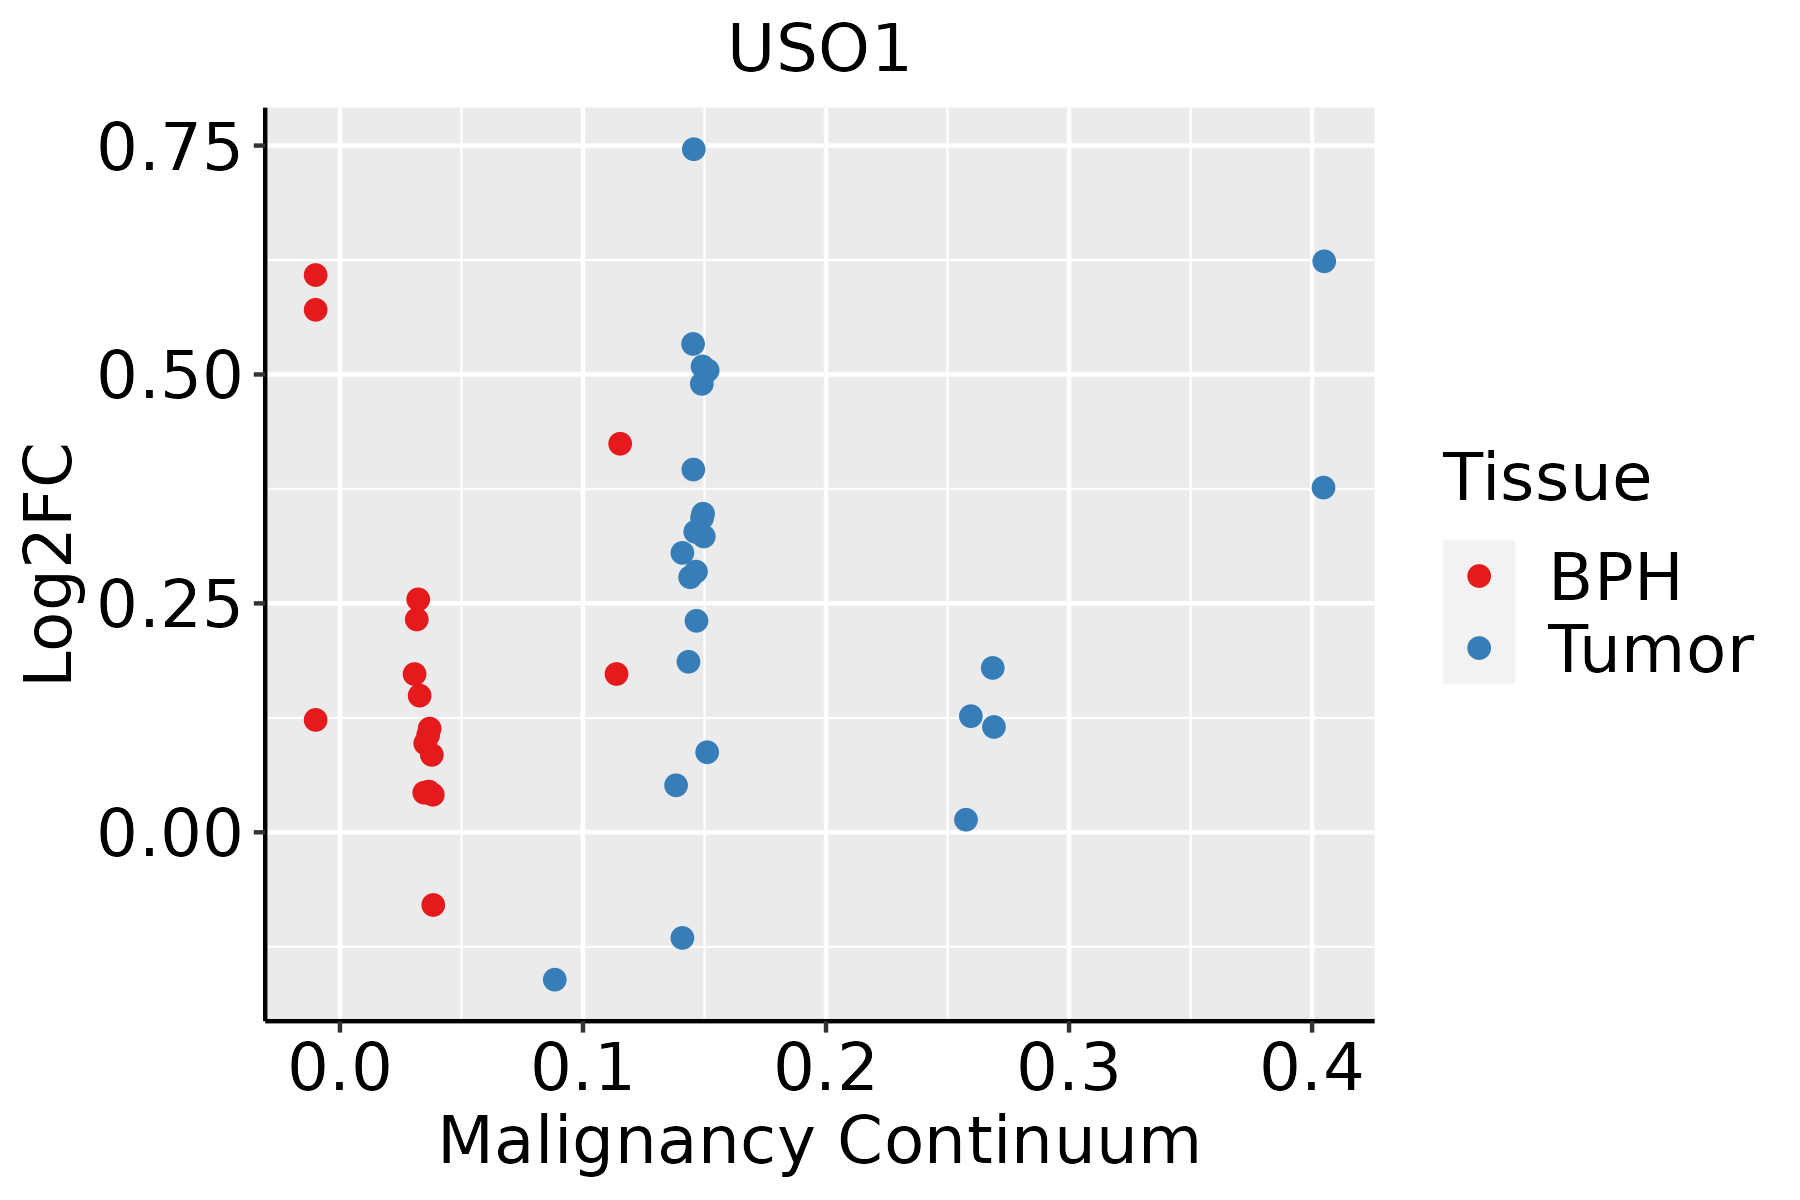
BPH: Benign Prostatic Hyperplasia
SkinThe image shows the transcriptomic changes along malignancy continuum.log2FC in expression of this searched gene in stem-like cells from each diseased tissue sample relative to stem-like cells in normal samples in each tissue plotted against the malignancy continuum. Samples are colored based on if they are from different disease stage.AK: Actinic keratosis
cSCC: Cutaneous squamous cell carcinoma
SCCIS:squamous cell carcinoma in situ
ThyroidThe image shows the transcriptomic changes along malignancy continuum.log2FC in expression of this searched gene in stem-like cells from each diseased tissue sample relative to stem-like cells in normal samples in each tissue plotted against the malignancy continuum. Samples are colored based on if they are from different disease stage.ATC: Anaplastic thyroid cancer
HT: Hashimoto's thyroiditis
PTC: Papillary thyroid cancer
∗log2FC in expression of this searched gene in stem-like cells from each diseased tissue sample relative to stem-like cells in normal samples in each tissue plotted against the malignancy continuum. Samples are colored based on if they are from different disease stage.

Top

Malignant transformation related pathway analysis

check buttonFind out the enriched GO biological processes and KEGG pathways involved in transition from healthy to precancer to cancer
check button Figure of enriched GO biological processes.
TissueDisease StageEnriched GO biological Processes
ColorectumADGO analysis - Figure of enriched GO biological processes: Top 15 enriched GO BP terms are showed in the bar plot of each disease state in each tissue. Each row represents a significant GO biological process which is colored according to the -log10(p.adjust).
ColorectumSERGO analysis - Figure of enriched GO biological processes: Top 15 enriched GO BP terms are showed in the bar plot of each disease state in each tissue. Each row represents a significant GO biological process which is colored according to the -log10(p.adjust).
ColorectumMSSGO analysis - Figure of enriched GO biological processes: Top 15 enriched GO BP terms are showed in the bar plot of each disease state in each tissue. Each row represents a significant GO biological process which is colored according to the -log10(p.adjust).
ColorectumMSI-HGO analysis - Figure of enriched GO biological processes: Top 15 enriched GO BP terms are showed in the bar plot of each disease state in each tissue. Each row represents a significant GO biological process which is colored according to the -log10(p.adjust).
ColorectumFAPGO analysis - Figure of enriched GO biological processes: Top 15 enriched GO BP terms are showed in the bar plot of each disease state in each tissue. Each row represents a significant GO biological process which is colored according to the -log10(p.adjust).
∗Top 15 enriched GO BP terms are showed in the bar plot of each disease state in each tissue. Each row represents a significant GO biological process which is colored according to the -log10(p.adjust).
Page: 1 2 3 4 5 6 7 8 9 

check button Enriched GO biological processes.
GO IDTissueDisease StageDescriptionGene RatioBg Ratiopvaluep.adjustCount
GO:004819317EsophagusHGINGolgi vesicle transport83/2587296/187238.59e-118.89e-0983
GO:00068889EsophagusHGINendoplasmic reticulum to Golgi vesicle-mediated transport40/2587130/187234.67e-072.07e-0540
GO:00160509EsophagusHGINvesicle organization65/2587300/187231.24e-042.54e-0365
GO:004343420EsophagusHGINresponse to peptide hormone79/2587414/187231.60e-031.79e-0279
GO:190165318EsophagusHGINcellular response to peptide68/2587359/187233.88e-033.54e-0268
GO:005164810EsophagusHGINvesicle localization37/2587177/187236.03e-034.87e-0237
GO:004819318EsophagusESCCGolgi vesicle transport231/8552296/187231.82e-309.63e-28231
GO:001605014EsophagusESCCvesicle organization211/8552300/187232.85e-182.87e-16211
GO:000688815EsophagusESCCendoplasmic reticulum to Golgi vesicle-mediated transport102/8552130/187231.73e-149.22e-13102
GO:005164815EsophagusESCCvesicle localization119/8552177/187235.16e-091.08e-07119
GO:00482844EsophagusESCCorganelle fusion94/8552141/187233.72e-075.16e-0694
GO:00224069EsophagusESCCmembrane docking62/855286/187235.93e-077.79e-0662
GO:190165319EsophagusESCCcellular response to peptide208/8552359/187231.68e-062.01e-05208
GO:00070308EsophagusESCCGolgi organization101/8552157/187231.78e-062.10e-05101
GO:0043434111EsophagusESCCresponse to peptide hormone234/8552414/187234.93e-065.21e-05234
GO:003286918EsophagusESCCcellular response to insulin stimulus124/8552203/187236.63e-066.75e-05124
GO:003286818EsophagusESCCresponse to insulin156/8552264/187237.21e-067.20e-05156
GO:00901743EsophagusESCCorganelle membrane fusion73/8552110/187239.29e-068.88e-0573
GO:00069063EsophagusESCCvesicle fusion70/8552106/187231.82e-051.60e-0470
GO:01400567EsophagusESCCorganelle localization by membrane tethering53/855277/187233.33e-052.74e-0453
Page: 1 2 3 4 5 6 7 8 9 10 

check button Enriched KEGG pathways.
Pathway IDTissueDisease StageDescriptionGene RatioBg Ratiopvaluep.adjustqvalueCount
Page: 1 

Top

Cell-cell communication analysis

check buttonIdentification of potential cell-cell interactions between two cell types and their ligand-receptor pairs for different disease states
LigandReceptorLRpairPathwayTissueDisease Stage
Page: 1 

Top

Single-cell gene regulatory network inference analysis

check buttonFind out the significant the regulons (TFs) and the target genes of each regulon across cell types for different disease states
TFCell TypeTissueDisease StageTarget GeneRSSRegulon Activity
∗The dot plots of a searched regulon are shown for all cell subpopulations in each disease state of each tissue based on the regulon specific score inferred using pySCENIC and by calculating the average expression.
Page: 1 

Top

Somatic mutation of malignant transformation related genes

check buttonAnnotation of somatic variants for genes involved in malignant transformation
Hugo SymbolVariant ClassVariant ClassificationdbSNP RSHGVScHGVSpHGVSp ShortSWISSPROTBIOTYPESIFTPolyPhenTumor Sample BarcodeTissueHistologySexAgeStageTherapy TypesDrugsOutcome
USO1SNVMissense_Mutationnovelc.1216N>Cp.Glu406Glnp.E406QO60763protein_codingtolerated(0.92)benign(0.171)TCGA-5L-AAT1-01Breastbreast invasive carcinomaFemale<65III/IVHormone TherapyletrozolSD
USO1SNVMissense_Mutationnovelc.1424N>Tp.Pro475Leup.P475LO60763protein_codingdeleterious(0)probably_damaging(0.994)TCGA-A2-A0EO-01Breastbreast invasive carcinomaFemale<65I/IIHormone TherapytamoxiphenSD
USO1SNVMissense_Mutationc.789N>Ap.Met263Ilep.M263IO60763protein_codingtolerated(0.18)benign(0.054)TCGA-A8-A06U-01Breastbreast invasive carcinomaFemale>=65I/IIUnknownUnknownSD
USO1SNVMissense_Mutationc.2558N>Gp.Lys853Argp.K853RO60763protein_codingtolerated(0.18)benign(0.003)TCGA-A8-A08F-01Breastbreast invasive carcinomaFemale<65III/IVChemotherapy5-fluorouracilCR
USO1SNVMissense_Mutationc.2254N>Cp.Glu752Glnp.E752QO60763protein_codingtolerated(0.13)possibly_damaging(0.572)TCGA-AC-A23H-01Breastbreast invasive carcinomaFemale>=65I/IIUnknownUnknownPD
USO1SNVMissense_Mutationc.2012N>Cp.Arg671Prop.R671PO60763protein_codingdeleterious(0)probably_damaging(1)TCGA-BH-A18T-01Breastbreast invasive carcinomaFemale>=65I/IIUnknownUnknownPD
USO1SNVMissense_Mutationc.893C>Tp.Thr298Ilep.T298IO60763protein_codingtolerated(0.09)benign(0.125)TCGA-E9-A22G-01Breastbreast invasive carcinomaFemale<65I/IIChemotherapydoxorubicinSD
USO1SNVMissense_Mutationrs781622240c.2918T>Cp.Ile973Thrp.I973TO60763protein_codingdeleterious_low_confidence(0)benign(0.025)TCGA-E9-A22G-01Breastbreast invasive carcinomaFemale<65I/IIChemotherapydoxorubicinSD
USO1SNVMissense_Mutationc.2012N>Cp.Arg671Prop.R671PO60763protein_codingdeleterious(0)probably_damaging(1)TCGA-EW-A1PB-01Breastbreast invasive carcinomaFemale>=65III/IVUnknownUnknownSD
USO1insertionFrame_Shift_Insnovelc.2882_2883insAAGAAACp.Asp961GlufsTer4p.D961Efs*4O60763protein_codingTCGA-BH-A0B4-01Breastbreast invasive carcinomaMale>=65III/IVHormone TherapytamoxiphenSD
Page: 1 2 3 4 5 6 7 

Top

Related drugs of malignant transformation related genes

check buttonIdentification of chemicals and drugs interact with genes involved in malignant transfromation
(DGIdb 4.0)
Entrez IDSymbolCategoryInteraction TypesDrug Claim NameDrug NamePMIDs
Page: 1