
|
|||||
|
 | |
| |
| |
| |
| |
| |
|
Gene: USH1C |
Gene summary for USH1C |
| Gene information | Species | Human | Gene symbol | USH1C | Gene ID | 10083 |
| Gene name | USH1 protein network component harmonin | |
| Gene Alias | AIE-75 | |
| Cytomap | 11p15.1 | |
| Gene Type | protein-coding | GO ID | GO:0000086 | UniProtAcc | A0A0S2Z4V1 |
Top |
Malignant transformation analysis |
| Identification of the aberrant gene expression in precancerous and cancerous lesions by comparing the gene expression of stem-like cells in diseased tissues with normal stem cells |
| Entrez ID | Symbol | Replicates | Species | Organ | Tissue | Adj P-value | Log2FC | Malignancy |
| 10083 | USH1C | HTA11_3410_2000001011 | Human | Colorectum | AD | 2.79e-04 | 3.11e-02 | 0.0155 |
| 10083 | USH1C | HTA11_2487_2000001011 | Human | Colorectum | SER | 3.81e-09 | 6.05e-01 | -0.1808 |
| 10083 | USH1C | HTA11_1938_2000001011 | Human | Colorectum | AD | 2.98e-05 | 5.65e-01 | -0.0811 |
| 10083 | USH1C | HTA11_78_2000001011 | Human | Colorectum | AD | 1.35e-02 | 4.11e-01 | -0.1088 |
| 10083 | USH1C | HTA11_347_2000001011 | Human | Colorectum | AD | 5.53e-15 | 6.44e-01 | -0.1954 |
| 10083 | USH1C | HTA11_411_2000001011 | Human | Colorectum | SER | 8.09e-10 | 1.28e+00 | -0.2602 |
| 10083 | USH1C | HTA11_696_2000001011 | Human | Colorectum | AD | 4.65e-15 | 6.13e-01 | -0.1464 |
| 10083 | USH1C | HTA11_1391_2000001011 | Human | Colorectum | AD | 6.54e-10 | 7.45e-01 | -0.059 |
| 10083 | USH1C | HTA11_866_3004761011 | Human | Colorectum | AD | 6.04e-05 | 4.68e-01 | 0.096 |
| 10083 | USH1C | HTA11_8622_2000001021 | Human | Colorectum | SER | 2.07e-02 | 5.90e-01 | 0.0528 |
| 10083 | USH1C | HTA11_7696_3000711011 | Human | Colorectum | AD | 4.63e-02 | 2.88e-01 | 0.0674 |
| 10083 | USH1C | HTA11_99999965104_69814 | Human | Colorectum | MSS | 4.98e-02 | 3.24e-01 | 0.281 |
| 10083 | USH1C | HTA11_99999971662_82457 | Human | Colorectum | MSS | 4.80e-14 | 8.56e-01 | 0.3859 |
| 10083 | USH1C | HTA11_99999973899_84307 | Human | Colorectum | MSS | 3.69e-04 | 6.18e-01 | 0.2585 |
| 10083 | USH1C | HTA11_99999974143_84620 | Human | Colorectum | MSS | 3.99e-16 | 6.40e-01 | 0.3005 |
| 10083 | USH1C | A015-C-203 | Human | Colorectum | FAP | 6.06e-18 | -3.14e-01 | -0.1294 |
| 10083 | USH1C | A002-C-201 | Human | Colorectum | FAP | 1.94e-03 | -1.68e-01 | 0.0324 |
| 10083 | USH1C | A001-C-119 | Human | Colorectum | FAP | 3.17e-02 | -2.57e-01 | -0.1557 |
| 10083 | USH1C | A001-C-108 | Human | Colorectum | FAP | 4.87e-08 | -1.48e-01 | -0.0272 |
| 10083 | USH1C | A002-C-205 | Human | Colorectum | FAP | 4.69e-10 | -2.50e-01 | -0.1236 |
| Page: 1 2 3 4 |
| Tissue | Expression Dynamics | Abbreviation |
| Colorectum (GSE201348) |  | FAP: Familial adenomatous polyposis |
| CRC: Colorectal cancer | ||
| Colorectum (HTA11) | 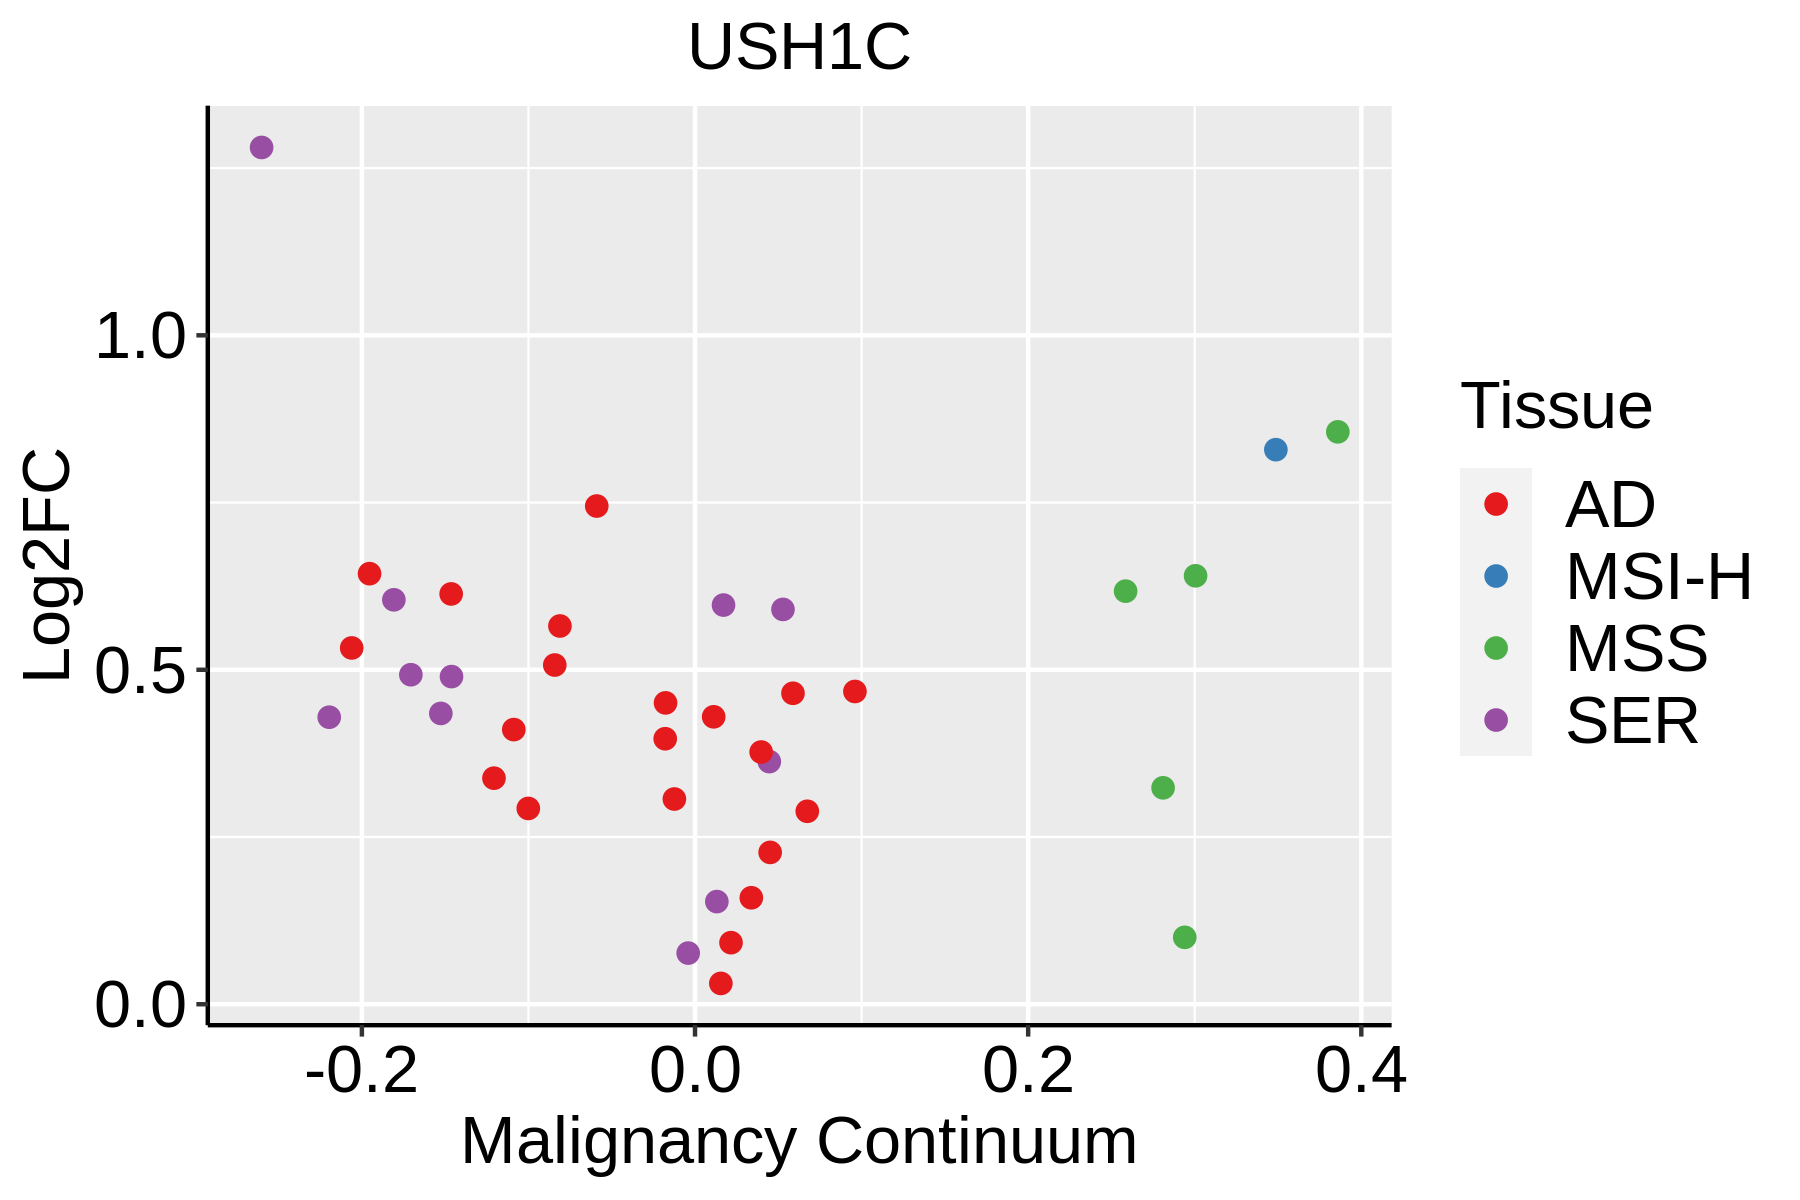 | AD: Adenomas |
| SER: Sessile serrated lesions | ||
| MSI-H: Microsatellite-high colorectal cancer | ||
| MSS: Microsatellite stable colorectal cancer | ||
| GC |  | CAG: Chronic atrophic gastritis |
| CAG with IM: Chronic atrophic gastritis with intestinal metaplasia | ||
| CSG: Chronic superficial gastritis | ||
| GC: Gastric cancer | ||
| SIM: Severe intestinal metaplasia | ||
| WIM: Wild intestinal metaplasia | ||
| Liver | 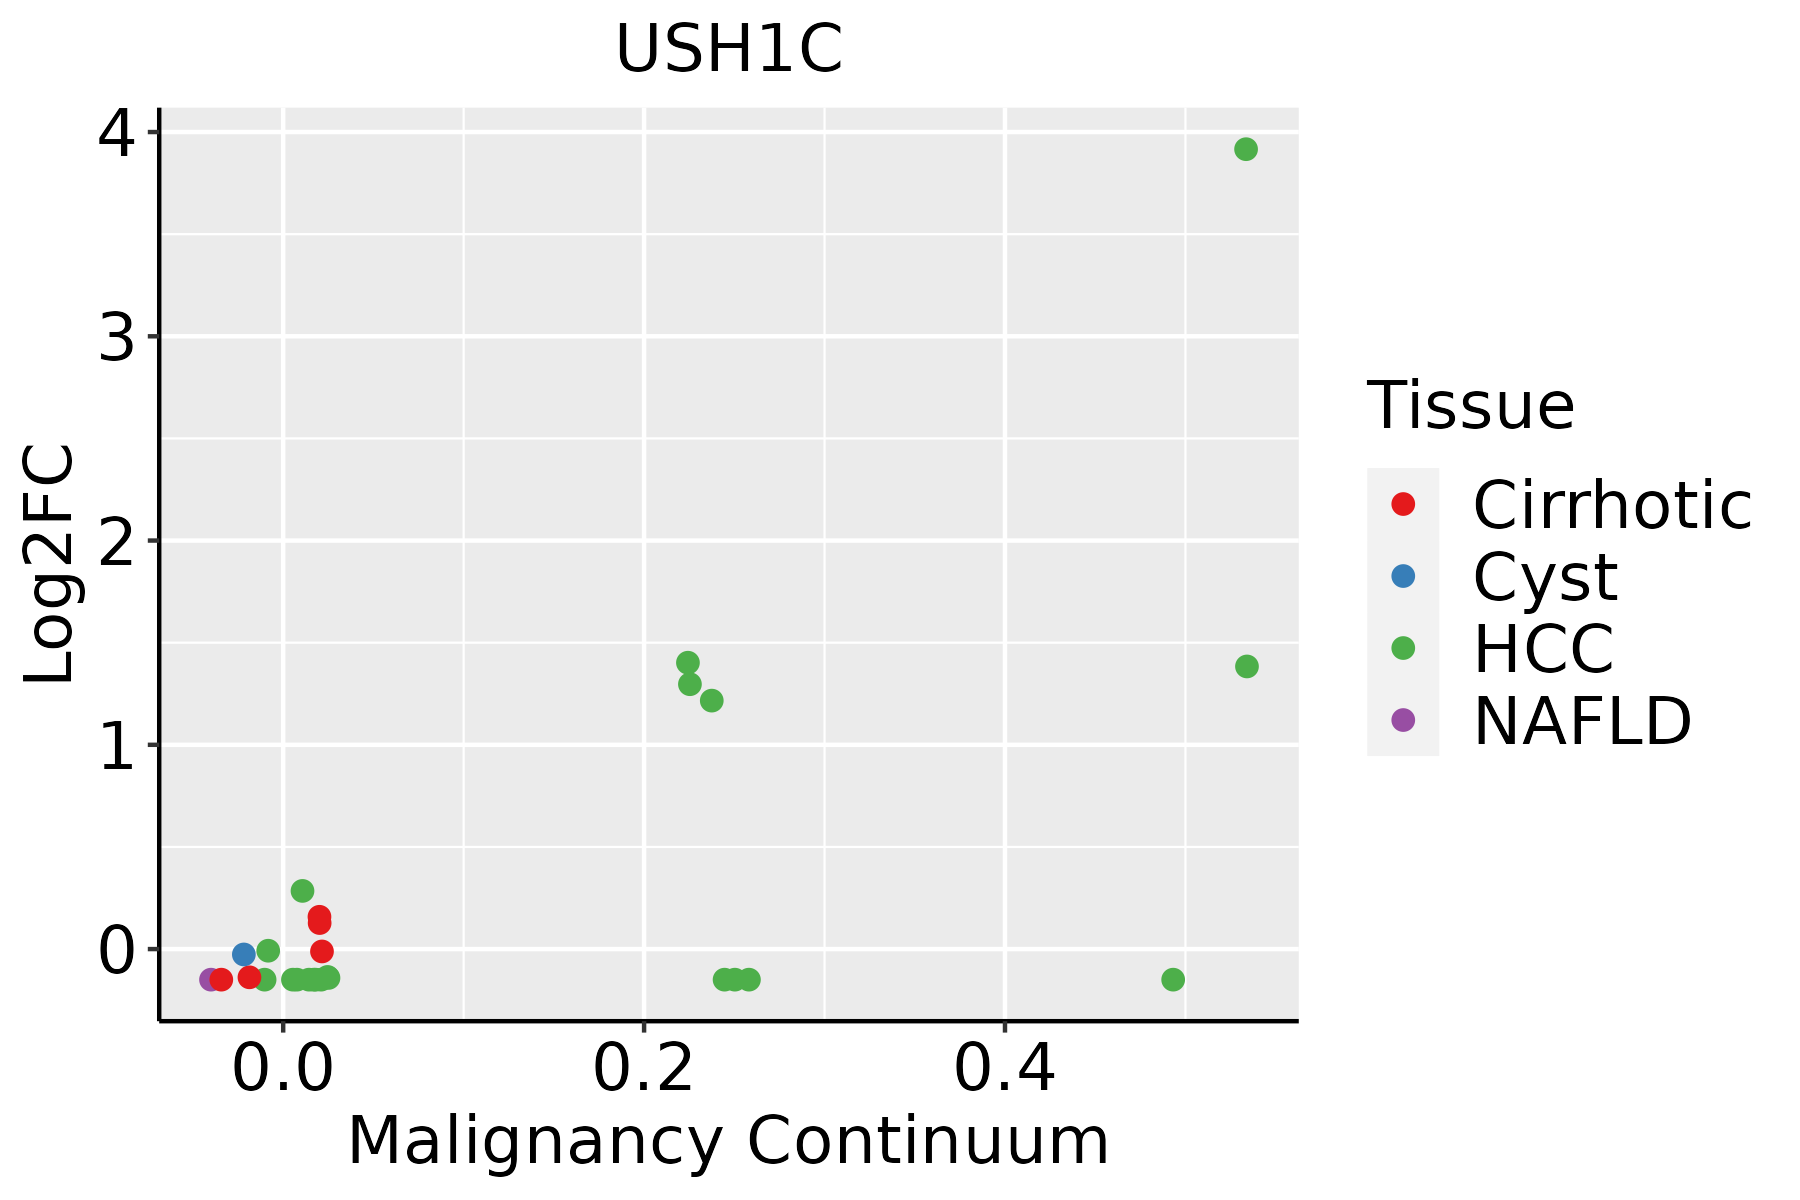 | HCC: Hepatocellular carcinoma |
| NAFLD: Non-alcoholic fatty liver disease |
| ∗log2FC in expression of this searched gene in stem-like cells from each diseased tissue sample relative to stem-like cells in normal samples in each tissue plotted against the malignancy continuum. Samples are colored based on if they are from different disease stage. |
Top |
Malignant transformation related pathway analysis |
| Find out the enriched GO biological processes and KEGG pathways involved in transition from healthy to precancer to cancer |
| Tissue | Disease Stage | Enriched GO biological Processes |
| Colorectum | AD |  |
| Colorectum | SER |  |
| Colorectum | MSS |  |
| Colorectum | MSI-H |  |
| Colorectum | FAP |  |
| ∗Top 15 enriched GO BP terms are showed in the bar plot of each disease state in each tissue. Each row represents a significant GO biological process which is colored according to the -log10(p.adjust). |
| Page: 1 2 3 4 5 6 7 8 9 |
| GO ID | Tissue | Disease Stage | Description | Gene Ratio | Bg Ratio | pvalue | p.adjust | Count |
| GO:0007015 | Colorectum | AD | actin filament organization | 167/3918 | 442/18723 | 1.65e-16 | 7.94e-14 | 167 |
| GO:0032535 | Colorectum | AD | regulation of cellular component size | 142/3918 | 383/18723 | 1.74e-13 | 3.41e-11 | 142 |
| GO:0061572 | Colorectum | AD | actin filament bundle organization | 60/3918 | 161/18723 | 1.33e-06 | 4.23e-05 | 60 |
| GO:0051017 | Colorectum | AD | actin filament bundle assembly | 58/3918 | 157/18723 | 2.74e-06 | 7.89e-05 | 58 |
| GO:0032530 | Colorectum | AD | regulation of microvillus organization | 10/3918 | 13/18723 | 2.43e-05 | 4.69e-04 | 10 |
| GO:0032528 | Colorectum | AD | microvillus organization | 14/3918 | 24/18723 | 6.90e-05 | 1.11e-03 | 14 |
| GO:0060249 | Colorectum | AD | anatomical structure homeostasis | 94/3918 | 314/18723 | 9.37e-05 | 1.42e-03 | 94 |
| GO:0001894 | Colorectum | AD | tissue homeostasis | 81/3918 | 268/18723 | 1.96e-04 | 2.62e-03 | 81 |
| GO:0035315 | Colorectum | AD | hair cell differentiation | 21/3918 | 47/18723 | 2.14e-04 | 2.82e-03 | 21 |
| GO:0042491 | Colorectum | AD | inner ear auditory receptor cell differentiation | 17/3918 | 38/18723 | 8.26e-04 | 8.13e-03 | 17 |
| GO:0042490 | Colorectum | AD | mechanoreceptor differentiation | 24/3918 | 67/18723 | 3.48e-03 | 2.52e-02 | 24 |
| GO:0048568 | Colorectum | AD | embryonic organ development | 112/3918 | 427/18723 | 4.60e-03 | 3.14e-02 | 112 |
| GO:0009913 | Colorectum | AD | epidermal cell differentiation | 58/3918 | 202/18723 | 5.16e-03 | 3.42e-02 | 58 |
| GO:0008544 | Colorectum | AD | epidermis development | 87/3918 | 324/18723 | 5.99e-03 | 3.76e-02 | 87 |
| GO:0060119 | Colorectum | AD | inner ear receptor cell development | 17/3918 | 45/18723 | 7.10e-03 | 4.33e-02 | 17 |
| GO:00070151 | Colorectum | SER | actin filament organization | 134/2897 | 442/18723 | 1.39e-15 | 5.70e-13 | 134 |
| GO:00325351 | Colorectum | SER | regulation of cellular component size | 115/2897 | 383/18723 | 3.04e-13 | 1.10e-10 | 115 |
| GO:00325301 | Colorectum | SER | regulation of microvillus organization | 10/2897 | 13/18723 | 1.41e-06 | 6.46e-05 | 10 |
| GO:00325281 | Colorectum | SER | microvillus organization | 14/2897 | 24/18723 | 1.83e-06 | 7.80e-05 | 14 |
| GO:00615721 | Colorectum | SER | actin filament bundle organization | 48/2897 | 161/18723 | 2.97e-06 | 1.19e-04 | 48 |
| Page: 1 2 3 4 5 6 7 |
| Pathway ID | Tissue | Disease Stage | Description | Gene Ratio | Bg Ratio | pvalue | p.adjust | qvalue | Count |
| Page: 1 |
Top |
Cell-cell communication analysis |
| Identification of potential cell-cell interactions between two cell types and their ligand-receptor pairs for different disease states |
| Ligand | Receptor | LRpair | Pathway | Tissue | Disease Stage |
| Page: 1 |
Top |
Single-cell gene regulatory network inference analysis |
| Find out the significant the regulons (TFs) and the target genes of each regulon across cell types for different disease states |
| TF | Cell Type | Tissue | Disease Stage | Target Gene | RSS | Regulon Activity |
| ∗The dot plots of a searched regulon are shown for all cell subpopulations in each disease state of each tissue based on the regulon specific score inferred using pySCENIC and by calculating the average expression. |
| Page: 1 |
Top |
Somatic mutation of malignant transformation related genes |
| Annotation of somatic variants for genes involved in malignant transformation |
| Hugo Symbol | Variant Class | Variant Classification | dbSNP RS | HGVSc | HGVSp | HGVSp Short | SWISSPROT | BIOTYPE | SIFT | PolyPhen | Tumor Sample Barcode | Tissue | Histology | Sex | Age | Stage | Therapy Types | Drugs | Outcome |
| USH1C | SNV | Missense_Mutation | c.502N>A | p.Gly168Ser | p.G168S | Q9Y6N9 | protein_coding | deleterious(0) | probably_damaging(0.971) | TCGA-A1-A0SH-01 | Breast | breast invasive carcinoma | Female | <65 | I/II | Chemotherapy | tc | SD | |
| USH1C | SNV | Missense_Mutation | novel | c.1149N>C | p.Gln383His | p.Q383H | Q9Y6N9 | protein_coding | tolerated_low_confidence(0.13) | possibly_damaging(0.679) | TCGA-A8-A08H-01 | Breast | breast invasive carcinoma | Female | >=65 | I/II | Unknown | Unknown | SD |
| USH1C | SNV | Missense_Mutation | c.370G>A | p.Asp124Asn | p.D124N | Q9Y6N9 | protein_coding | deleterious(0.02) | possibly_damaging(0.813) | TCGA-AC-A23H-01 | Breast | breast invasive carcinoma | Female | >=65 | I/II | Unknown | Unknown | PD | |
| USH1C | SNV | Missense_Mutation | rs201644053 | c.2500N>A | p.Asp834Asn | p.D834N | Q9Y6N9 | protein_coding | deleterious_low_confidence(0) | possibly_damaging(0.514) | TCGA-AN-A046-01 | Breast | breast invasive carcinoma | Female | >=65 | I/II | Unknown | Unknown | SD |
| USH1C | SNV | Missense_Mutation | novel | c.1455N>T | p.Lys485Asn | p.K485N | Q9Y6N9 | protein_coding | deleterious_low_confidence(0) | probably_damaging(0.994) | TCGA-AN-A046-01 | Breast | breast invasive carcinoma | Female | >=65 | I/II | Unknown | Unknown | SD |
| USH1C | SNV | Missense_Mutation | rs774988386 | c.1754N>T | p.Ser585Phe | p.S585F | Q9Y6N9 | protein_coding | deleterious_low_confidence(0.01) | benign(0.084) | TCGA-AR-A0TX-01 | Breast | breast invasive carcinoma | Female | <65 | I/II | Unknown | Unknown | SD |
| USH1C | SNV | Missense_Mutation | c.1954N>T | p.His652Tyr | p.H652Y | Q9Y6N9 | protein_coding | tolerated_low_confidence(0.38) | benign(0) | TCGA-BH-A0HF-01 | Breast | breast invasive carcinoma | Female | >=65 | I/II | Hormone Therapy | arimidex | SD | |
| USH1C | SNV | Missense_Mutation | rs397517883 | c.587G>A | p.Arg196Gln | p.R196Q | Q9Y6N9 | protein_coding | tolerated(0.11) | benign(0.32) | TCGA-E2-A56Z-01 | Breast | breast invasive carcinoma | Female | >=65 | I/II | Hormone Therapy | arimidex | SD |
| USH1C | SNV | Missense_Mutation | c.2281N>C | p.Glu761Gln | p.E761Q | Q9Y6N9 | protein_coding | deleterious_low_confidence(0.01) | probably_damaging(0.991) | TCGA-EW-A1J5-01 | Breast | breast invasive carcinoma | Female | <65 | I/II | Chemotherapy | adriamycin | SD | |
| USH1C | SNV | Missense_Mutation | c.2498N>G | p.Ile833Ser | p.I833S | Q9Y6N9 | protein_coding | deleterious_low_confidence(0) | probably_damaging(0.996) | TCGA-EW-A1P5-01 | Breast | breast invasive carcinoma | Female | >=65 | I/II | Hormone Therapy | anastrozole | SD |
| Page: 1 2 3 4 5 6 7 8 9 10 11 12 13 14 |
Top |
Related drugs of malignant transformation related genes |
| Identification of chemicals and drugs interact with genes involved in malignant transfromation |
| (DGIdb 4.0) |
| Entrez ID | Symbol | Category | Interaction Types | Drug Claim Name | Drug Name | PMIDs |
| Page: 1 |

Copyright 2023-Present -The University of Texas Health Science Center at Houston |