
|
|||||
|
 | |
| |
| |
| |
| |
| |
|
Gene: USF3 |
Gene summary for USF3 |
| Gene information | Species | Human | Gene symbol | USF3 | Gene ID | 205717 |
| Gene name | upstream transcription factor family member 3 | |
| Gene Alias | KIAA2018 | |
| Cytomap | 3q13.2 | |
| Gene Type | protein-coding | GO ID | GO:0001837 | UniProtAcc | NA |
Top |
Malignant transformation analysis |
| Identification of the aberrant gene expression in precancerous and cancerous lesions by comparing the gene expression of stem-like cells in diseased tissues with normal stem cells |
| Entrez ID | Symbol | Replicates | Species | Organ | Tissue | Adj P-value | Log2FC | Malignancy |
| 205717 | USF3 | LZE24T | Human | Esophagus | ESCC | 7.38e-04 | 2.06e-01 | 0.0596 |
| 205717 | USF3 | P1T-E | Human | Esophagus | ESCC | 7.25e-05 | 2.88e-01 | 0.0875 |
| 205717 | USF3 | P2T-E | Human | Esophagus | ESCC | 8.15e-12 | 1.71e-01 | 0.1177 |
| 205717 | USF3 | P4T-E | Human | Esophagus | ESCC | 1.36e-05 | 1.04e-01 | 0.1323 |
| 205717 | USF3 | P5T-E | Human | Esophagus | ESCC | 1.89e-08 | 4.73e-02 | 0.1327 |
| 205717 | USF3 | P8T-E | Human | Esophagus | ESCC | 1.67e-14 | 2.44e-01 | 0.0889 |
| 205717 | USF3 | P10T-E | Human | Esophagus | ESCC | 1.26e-15 | 2.99e-01 | 0.116 |
| 205717 | USF3 | P11T-E | Human | Esophagus | ESCC | 1.08e-02 | 1.77e-01 | 0.1426 |
| 205717 | USF3 | P12T-E | Human | Esophagus | ESCC | 1.45e-03 | 3.06e-02 | 0.1122 |
| 205717 | USF3 | P15T-E | Human | Esophagus | ESCC | 7.98e-03 | 8.66e-02 | 0.1149 |
| 205717 | USF3 | P16T-E | Human | Esophagus | ESCC | 1.15e-14 | 1.70e-01 | 0.1153 |
| 205717 | USF3 | P20T-E | Human | Esophagus | ESCC | 7.24e-06 | 2.25e-01 | 0.1124 |
| 205717 | USF3 | P21T-E | Human | Esophagus | ESCC | 1.24e-09 | 1.23e-01 | 0.1617 |
| 205717 | USF3 | P22T-E | Human | Esophagus | ESCC | 1.31e-08 | 1.14e-01 | 0.1236 |
| 205717 | USF3 | P23T-E | Human | Esophagus | ESCC | 1.30e-14 | 2.84e-01 | 0.108 |
| 205717 | USF3 | P24T-E | Human | Esophagus | ESCC | 1.39e-07 | 9.64e-02 | 0.1287 |
| 205717 | USF3 | P26T-E | Human | Esophagus | ESCC | 2.58e-13 | 1.18e-01 | 0.1276 |
| 205717 | USF3 | P27T-E | Human | Esophagus | ESCC | 2.24e-15 | 1.83e-01 | 0.1055 |
| 205717 | USF3 | P28T-E | Human | Esophagus | ESCC | 1.92e-16 | 1.19e-01 | 0.1149 |
| 205717 | USF3 | P30T-E | Human | Esophagus | ESCC | 8.81e-14 | 5.20e-01 | 0.137 |
| Page: 1 2 3 4 |
| Tissue | Expression Dynamics | Abbreviation |
| Esophagus |  | ESCC: Esophageal squamous cell carcinoma |
| HGIN: High-grade intraepithelial neoplasias | ||
| LGIN: Low-grade intraepithelial neoplasias | ||
| Liver |  | HCC: Hepatocellular carcinoma |
| NAFLD: Non-alcoholic fatty liver disease | ||
| Oral Cavity | 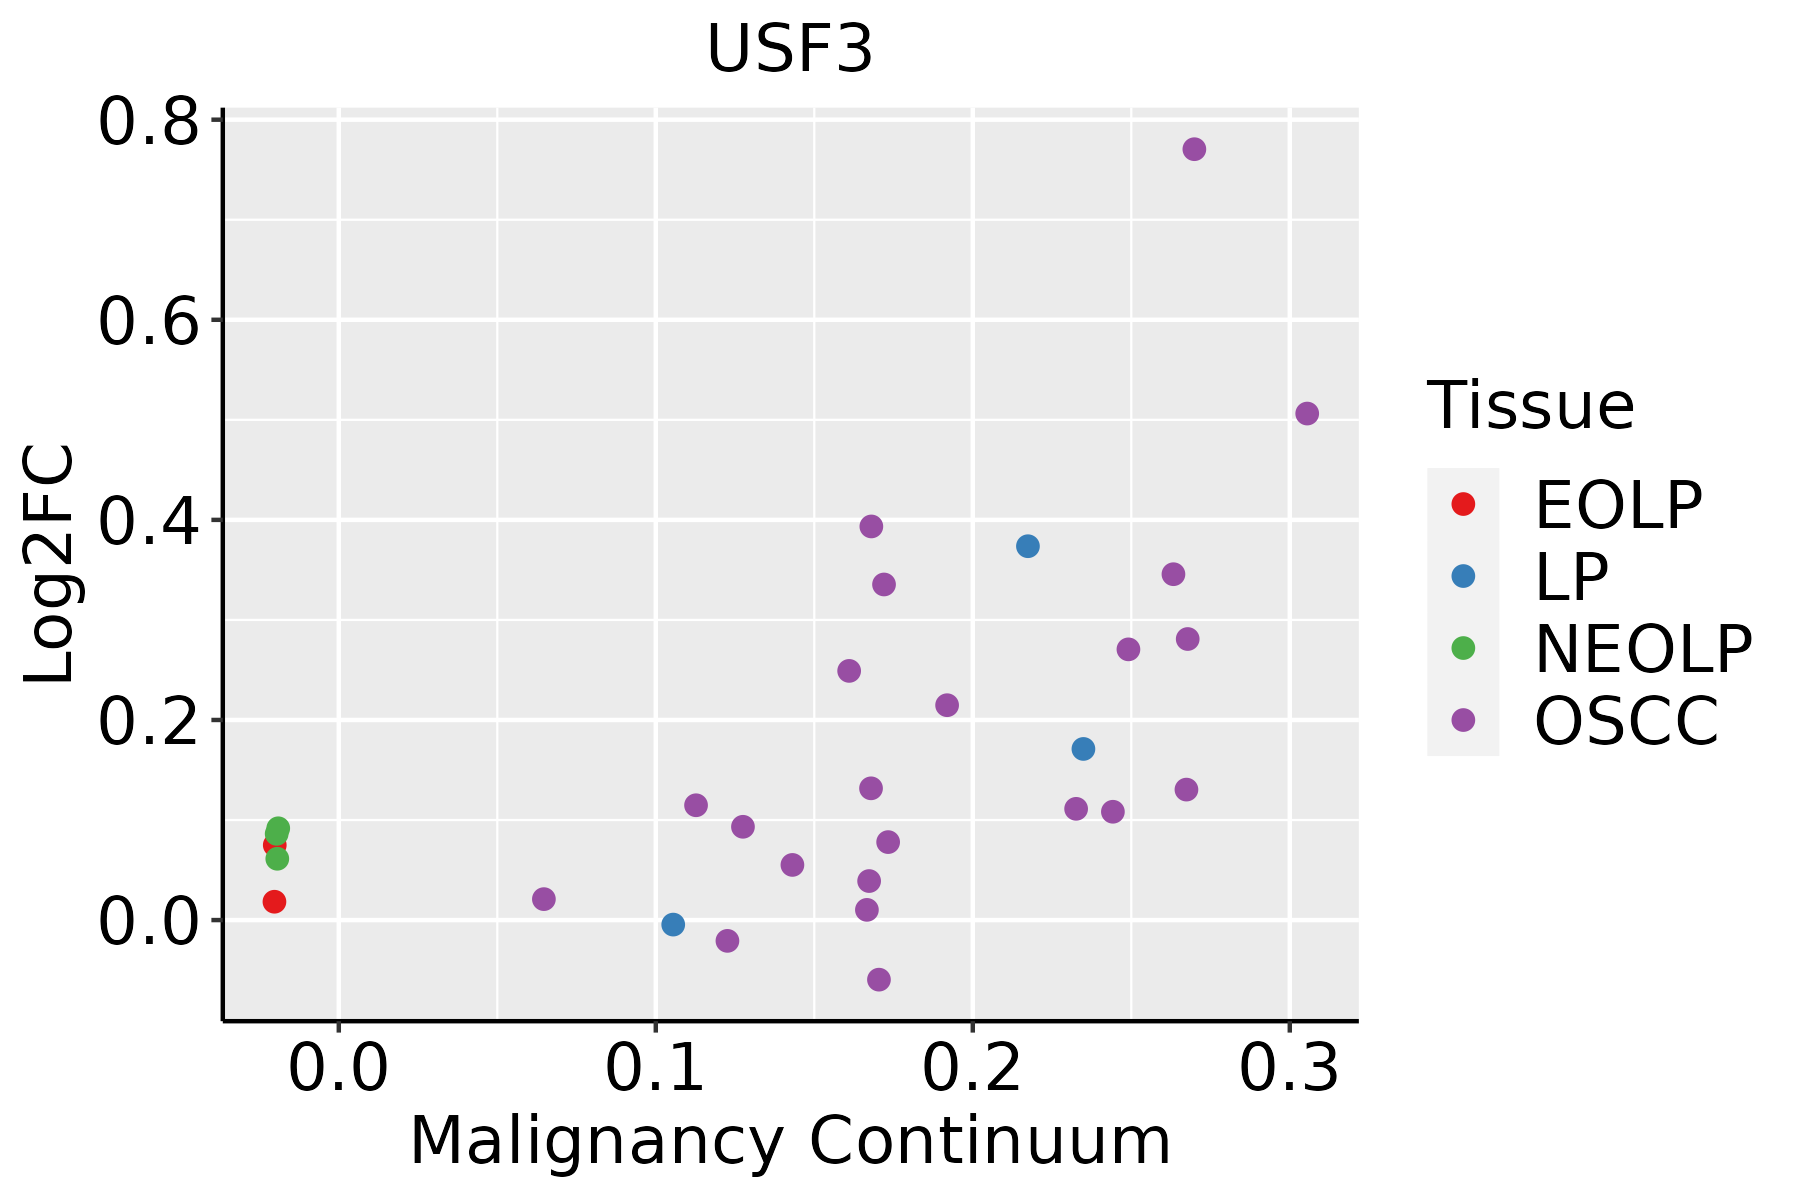 | EOLP: Erosive Oral lichen planus |
| LP: leukoplakia | ||
| NEOLP: Non-erosive oral lichen planus | ||
| OSCC: Oral squamous cell carcinoma |
| ∗log2FC in expression of this searched gene in stem-like cells from each diseased tissue sample relative to stem-like cells in normal samples in each tissue plotted against the malignancy continuum. Samples are colored based on if they are from different disease stage. |
Top |
Malignant transformation related pathway analysis |
| Find out the enriched GO biological processes and KEGG pathways involved in transition from healthy to precancer to cancer |
| Tissue | Disease Stage | Enriched GO biological Processes |
| Colorectum | AD |  |
| Colorectum | SER |  |
| Colorectum | MSS |  |
| Colorectum | MSI-H |  |
| Colorectum | FAP |  |
| ∗Top 15 enriched GO BP terms are showed in the bar plot of each disease state in each tissue. Each row represents a significant GO biological process which is colored according to the -log10(p.adjust). |
| Page: 1 2 3 4 5 6 7 8 9 |
| GO ID | Tissue | Disease Stage | Description | Gene Ratio | Bg Ratio | pvalue | p.adjust | Count |
| GO:00018378 | Esophagus | ESCC | epithelial to mesenchymal transition | 95/8552 | 157/18723 | 1.25e-04 | 8.56e-04 | 95 |
| GO:00487628 | Esophagus | ESCC | mesenchymal cell differentiation | 133/8552 | 236/18723 | 5.94e-04 | 3.22e-03 | 133 |
| GO:00107174 | Esophagus | ESCC | regulation of epithelial to mesenchymal transition | 61/8552 | 99/18723 | 1.01e-03 | 5.09e-03 | 61 |
| GO:00604856 | Esophagus | ESCC | mesenchyme development | 156/8552 | 291/18723 | 3.76e-03 | 1.53e-02 | 156 |
| GO:00018377 | Oral cavity | OSCC | epithelial to mesenchymal transition | 82/7305 | 157/18723 | 5.09e-04 | 2.98e-03 | 82 |
| GO:00107173 | Oral cavity | OSCC | regulation of epithelial to mesenchymal transition | 54/7305 | 99/18723 | 1.21e-03 | 6.10e-03 | 54 |
| GO:00487627 | Oral cavity | OSCC | mesenchymal cell differentiation | 109/7305 | 236/18723 | 1.43e-02 | 4.69e-02 | 109 |
| Page: 1 |
| Pathway ID | Tissue | Disease Stage | Description | Gene Ratio | Bg Ratio | pvalue | p.adjust | qvalue | Count |
| Page: 1 |
Top |
Cell-cell communication analysis |
| Identification of potential cell-cell interactions between two cell types and their ligand-receptor pairs for different disease states |
| Ligand | Receptor | LRpair | Pathway | Tissue | Disease Stage |
| Page: 1 |
Top |
Single-cell gene regulatory network inference analysis |
| Find out the significant the regulons (TFs) and the target genes of each regulon across cell types for different disease states |
| TF | Cell Type | Tissue | Disease Stage | Target Gene | RSS | Regulon Activity |
| ∗The dot plots of a searched regulon are shown for all cell subpopulations in each disease state of each tissue based on the regulon specific score inferred using pySCENIC and by calculating the average expression. |
| Page: 1 |
Top |
Somatic mutation of malignant transformation related genes |
| Annotation of somatic variants for genes involved in malignant transformation |
| Hugo Symbol | Variant Class | Variant Classification | dbSNP RS | HGVSc | HGVSp | HGVSp Short | SWISSPROT | BIOTYPE | SIFT | PolyPhen | Tumor Sample Barcode | Tissue | Histology | Sex | Age | Stage | Therapy Types | Drugs | Outcome |
| USF3 | SNV | Missense_Mutation | rs760900951 | c.2642N>T | p.Ser881Leu | p.S881L | Q68DE3 | protein_coding | deleterious_low_confidence(0.01) | benign(0.007) | TCGA-AN-A046-01 | Breast | breast invasive carcinoma | Female | >=65 | I/II | Unknown | Unknown | SD |
| USF3 | SNV | Missense_Mutation | c.1139N>C | p.Gly380Ala | p.G380A | Q68DE3 | protein_coding | tolerated_low_confidence(0.74) | benign(0.007) | TCGA-AN-A0XO-01 | Breast | breast invasive carcinoma | Female | <65 | III/IV | Unknown | Unknown | SD | |
| USF3 | SNV | Missense_Mutation | rs371204248 | c.6155N>T | p.Ser2052Leu | p.S2052L | Q68DE3 | protein_coding | tolerated(0.17) | benign(0.35) | TCGA-AN-A0XR-01 | Breast | breast invasive carcinoma | Female | <65 | III/IV | Unknown | Unknown | SD |
| USF3 | SNV | Missense_Mutation | rs372085417 | c.1808G>A | p.Arg603Gln | p.R603Q | Q68DE3 | protein_coding | tolerated(0.13) | probably_damaging(0.999) | TCGA-AQ-A7U7-01 | Breast | breast invasive carcinoma | Female | <65 | III/IV | Targeted Molecular therapy | rituximab | CR |
| USF3 | SNV | Missense_Mutation | novel | c.6127N>C | p.Asp2043His | p.D2043H | Q68DE3 | protein_coding | deleterious(0) | probably_damaging(0.951) | TCGA-B6-A0I1-01 | Breast | breast invasive carcinoma | Female | >=65 | I/II | Unknown | Unknown | PD |
| USF3 | SNV | Missense_Mutation | c.2731N>T | p.Asp911Tyr | p.D911Y | Q68DE3 | protein_coding | deleterious_low_confidence(0.01) | probably_damaging(0.947) | TCGA-B6-A0WW-01 | Breast | breast invasive carcinoma | Female | <65 | I/II | Unknown | Unknown | PD | |
| USF3 | SNV | Missense_Mutation | c.3466N>A | p.Asp1156Asn | p.D1156N | Q68DE3 | protein_coding | tolerated(0.31) | benign(0.031) | TCGA-D8-A1JA-01 | Breast | breast invasive carcinoma | Female | <65 | III/IV | Chemotherapy | adriamycin | PD | |
| USF3 | SNV | Missense_Mutation | rs201006777 | c.5363N>A | p.Arg1788His | p.R1788H | Q68DE3 | protein_coding | deleterious(0.01) | probably_damaging(0.999) | TCGA-D8-A1JC-01 | Breast | breast invasive carcinoma | Female | <65 | III/IV | Chemotherapy | adriamycin | SD |
| USF3 | SNV | Missense_Mutation | rs751610573 | c.6421N>A | p.Glu2141Lys | p.E2141K | Q68DE3 | protein_coding | deleterious(0.01) | probably_damaging(0.998) | TCGA-EW-A1IW-01 | Breast | breast invasive carcinoma | Female | >=65 | I/II | Hormone Therapy | aromasin | SD |
| USF3 | SNV | Missense_Mutation | c.613G>C | p.Glu205Gln | p.E205Q | Q68DE3 | protein_coding | deleterious_low_confidence(0.01) | probably_damaging(0.999) | TCGA-EW-A1PB-01 | Breast | breast invasive carcinoma | Female | >=65 | III/IV | Unknown | Unknown | SD |
| Page: 1 2 3 4 5 6 7 8 9 10 11 12 13 14 15 16 17 18 19 20 21 22 23 24 |
Top |
Related drugs of malignant transformation related genes |
| Identification of chemicals and drugs interact with genes involved in malignant transfromation |
| (DGIdb 4.0) |
| Entrez ID | Symbol | Category | Interaction Types | Drug Claim Name | Drug Name | PMIDs |
| Page: 1 |

Copyright 2023-Present -The University of Texas Health Science Center at Houston |