
|
|||||
|
 | |
| |
| |
| |
| |
| |
|
Gene: USF2 |
Gene summary for USF2 |
| Gene information | Species | Human | Gene symbol | USF2 | Gene ID | 7392 |
| Gene name | upstream transcription factor 2, c-fos interacting | |
| Gene Alias | FIP | |
| Cytomap | 19q13.12 | |
| Gene Type | protein-coding | GO ID | GO:0000429 | UniProtAcc | Q15853 |
Top |
Malignant transformation analysis |
| Identification of the aberrant gene expression in precancerous and cancerous lesions by comparing the gene expression of stem-like cells in diseased tissues with normal stem cells |
| Entrez ID | Symbol | Replicates | Species | Organ | Tissue | Adj P-value | Log2FC | Malignancy |
| 7392 | USF2 | HTA11_2487_2000001011 | Human | Colorectum | SER | 2.43e-02 | 3.17e-01 | -0.1808 |
| 7392 | USF2 | HTA11_1938_2000001011 | Human | Colorectum | AD | 1.33e-04 | 3.09e-01 | -0.0811 |
| 7392 | USF2 | HTA11_78_2000001011 | Human | Colorectum | AD | 1.22e-03 | 3.01e-01 | -0.1088 |
| 7392 | USF2 | HTA11_347_2000001011 | Human | Colorectum | AD | 7.35e-08 | 3.11e-01 | -0.1954 |
| 7392 | USF2 | HTA11_696_2000001011 | Human | Colorectum | AD | 6.73e-09 | 3.54e-01 | -0.1464 |
| 7392 | USF2 | HTA11_866_2000001011 | Human | Colorectum | AD | 5.19e-06 | 2.50e-01 | -0.1001 |
| 7392 | USF2 | HTA11_1391_2000001011 | Human | Colorectum | AD | 3.21e-08 | 4.55e-01 | -0.059 |
| 7392 | USF2 | HTA11_2992_2000001011 | Human | Colorectum | SER | 4.86e-04 | 4.43e-01 | -0.1706 |
| 7392 | USF2 | HTA11_866_3004761011 | Human | Colorectum | AD | 9.61e-06 | 2.87e-01 | 0.096 |
| 7392 | USF2 | HTA11_10711_2000001011 | Human | Colorectum | AD | 3.44e-04 | 2.65e-01 | 0.0338 |
| 7392 | USF2 | HTA11_7696_3000711011 | Human | Colorectum | AD | 1.34e-21 | 5.88e-01 | 0.0674 |
| 7392 | USF2 | HTA11_6818_2000001021 | Human | Colorectum | AD | 7.28e-03 | 3.26e-01 | 0.0588 |
| 7392 | USF2 | HTA11_99999970781_79442 | Human | Colorectum | MSS | 1.73e-08 | 3.52e-01 | 0.294 |
| 7392 | USF2 | HTA11_99999971662_82457 | Human | Colorectum | MSS | 3.86e-30 | 6.44e-01 | 0.3859 |
| 7392 | USF2 | HTA11_99999973899_84307 | Human | Colorectum | MSS | 4.94e-03 | 4.51e-01 | 0.2585 |
| 7392 | USF2 | HTA11_99999974143_84620 | Human | Colorectum | MSS | 1.33e-08 | 2.66e-01 | 0.3005 |
| 7392 | USF2 | LZE4T | Human | Esophagus | ESCC | 5.98e-06 | 2.62e-02 | 0.0811 |
| 7392 | USF2 | LZE5T | Human | Esophagus | ESCC | 4.14e-03 | 2.59e-01 | 0.0514 |
| 7392 | USF2 | LZE7T | Human | Esophagus | ESCC | 3.84e-10 | 2.74e-01 | 0.0667 |
| 7392 | USF2 | LZE20T | Human | Esophagus | ESCC | 3.98e-08 | 7.31e-02 | 0.0662 |
| Page: 1 2 3 4 5 6 7 |
| Tissue | Expression Dynamics | Abbreviation |
| Colorectum (GSE201348) | 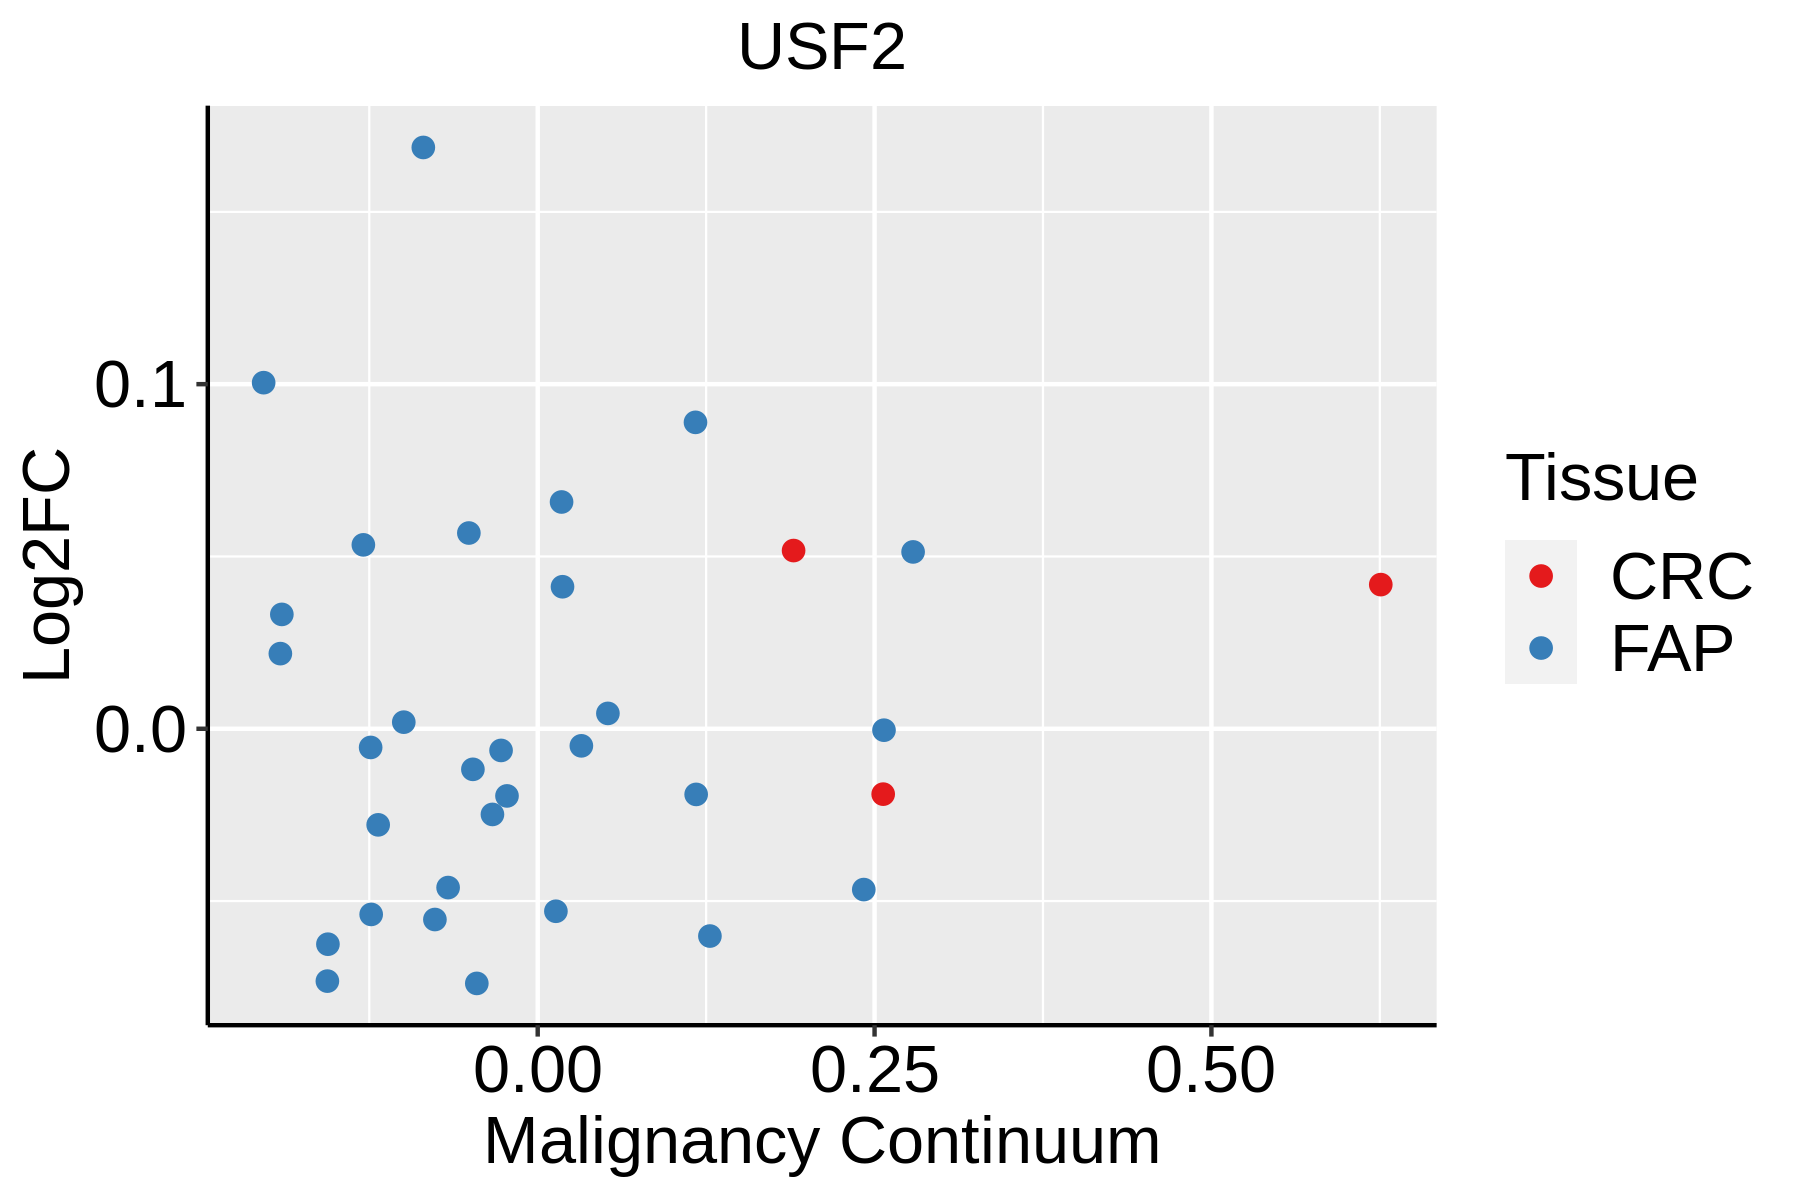 | FAP: Familial adenomatous polyposis |
| CRC: Colorectal cancer | ||
| Colorectum (HTA11) |  | AD: Adenomas |
| SER: Sessile serrated lesions | ||
| MSI-H: Microsatellite-high colorectal cancer | ||
| MSS: Microsatellite stable colorectal cancer | ||
| Esophagus | 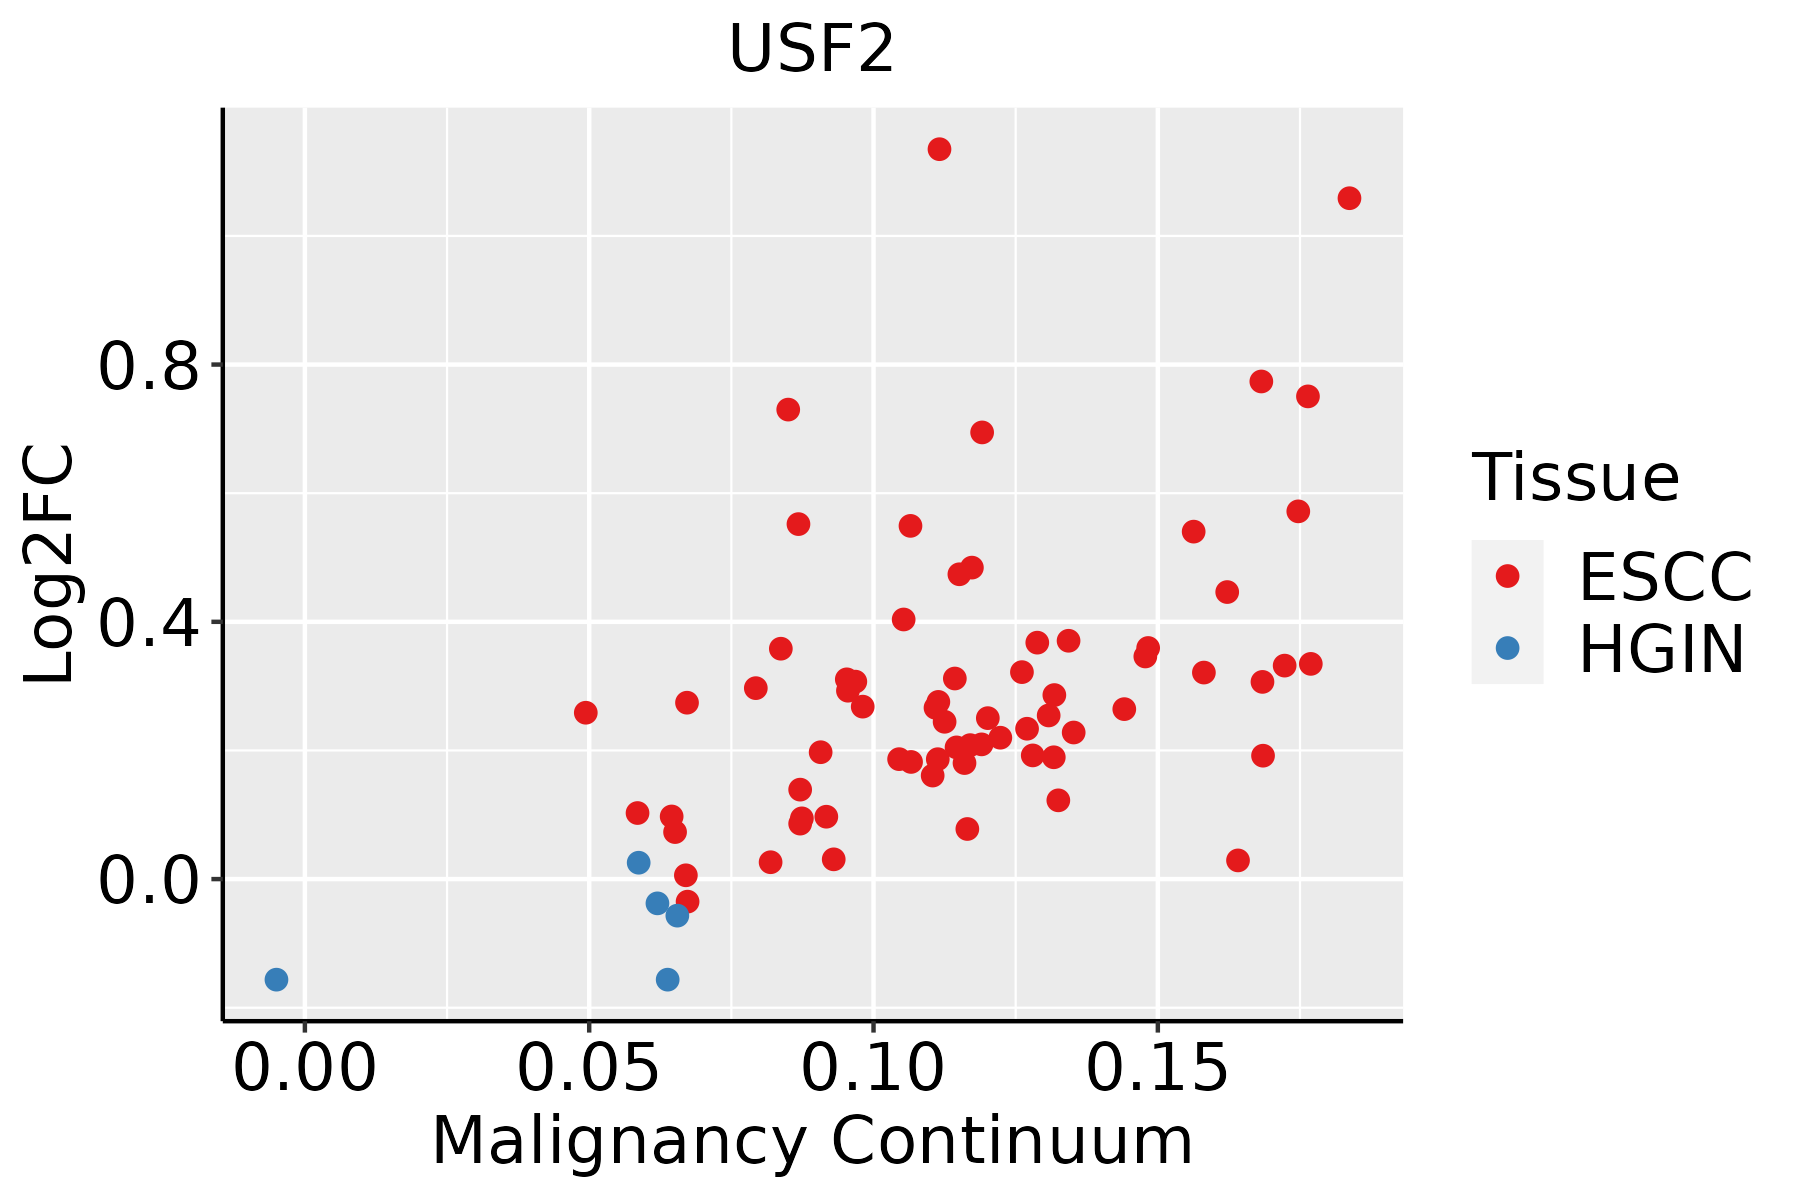 | ESCC: Esophageal squamous cell carcinoma |
| HGIN: High-grade intraepithelial neoplasias | ||
| LGIN: Low-grade intraepithelial neoplasias | ||
| Liver | 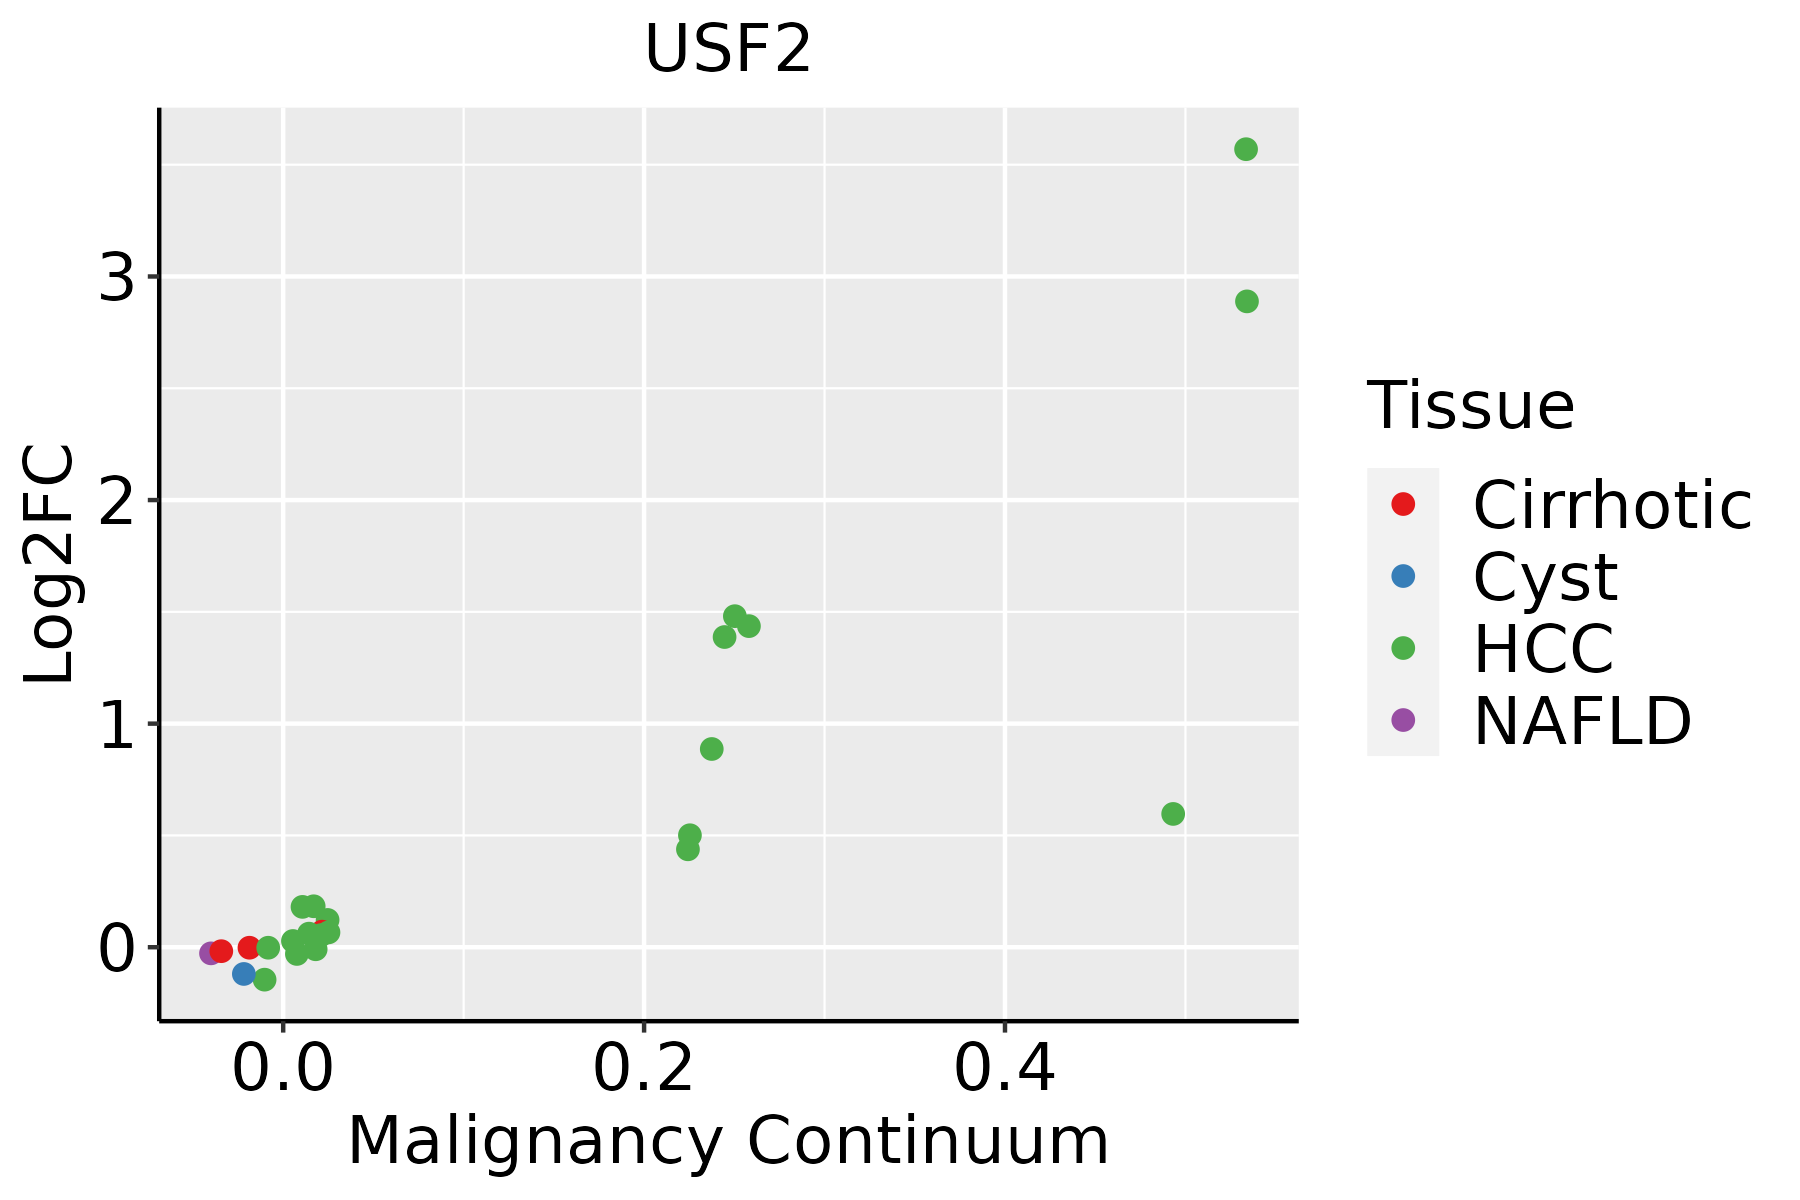 | HCC: Hepatocellular carcinoma |
| NAFLD: Non-alcoholic fatty liver disease | ||
| Oral Cavity | 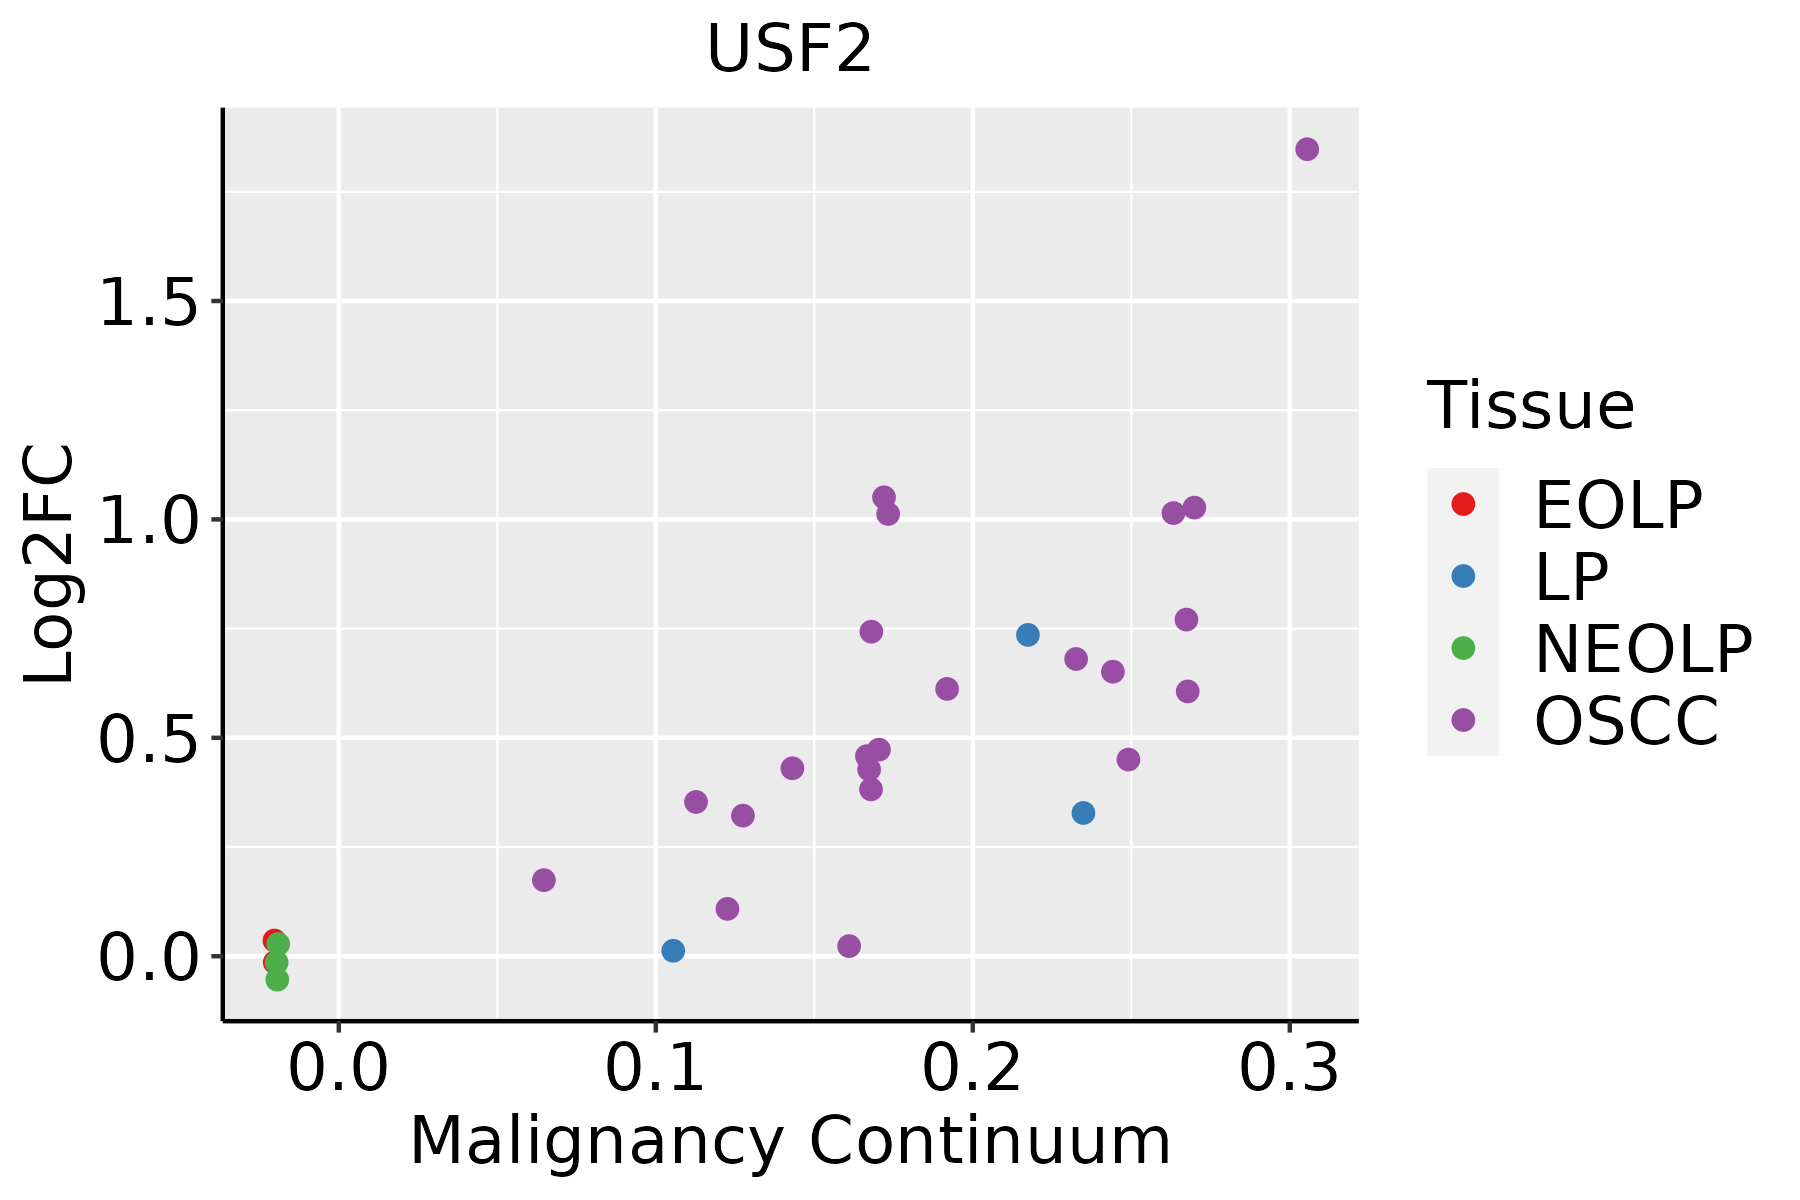 | EOLP: Erosive Oral lichen planus |
| LP: leukoplakia | ||
| NEOLP: Non-erosive oral lichen planus | ||
| OSCC: Oral squamous cell carcinoma | ||
| Skin | 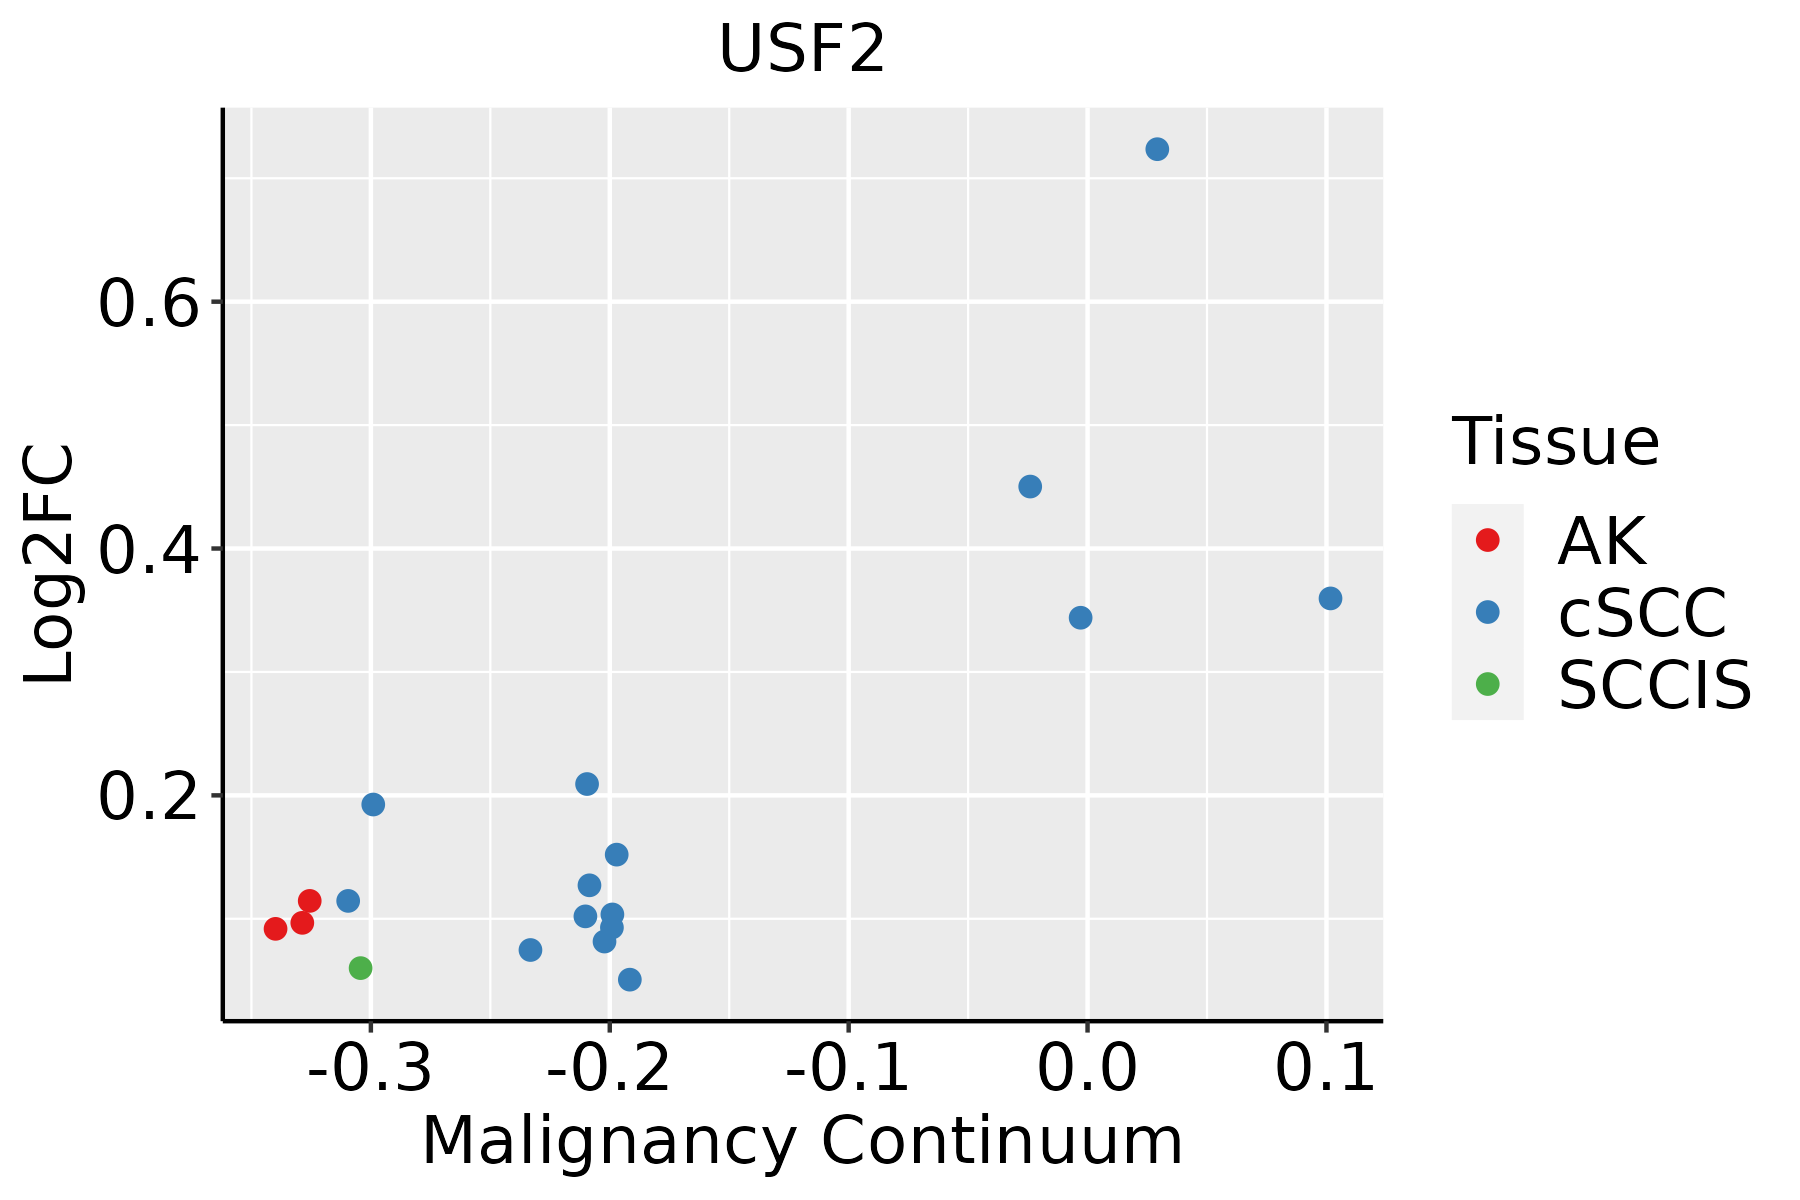 | AK: Actinic keratosis |
| cSCC: Cutaneous squamous cell carcinoma | ||
| SCCIS:squamous cell carcinoma in situ | ||
| Thyroid | 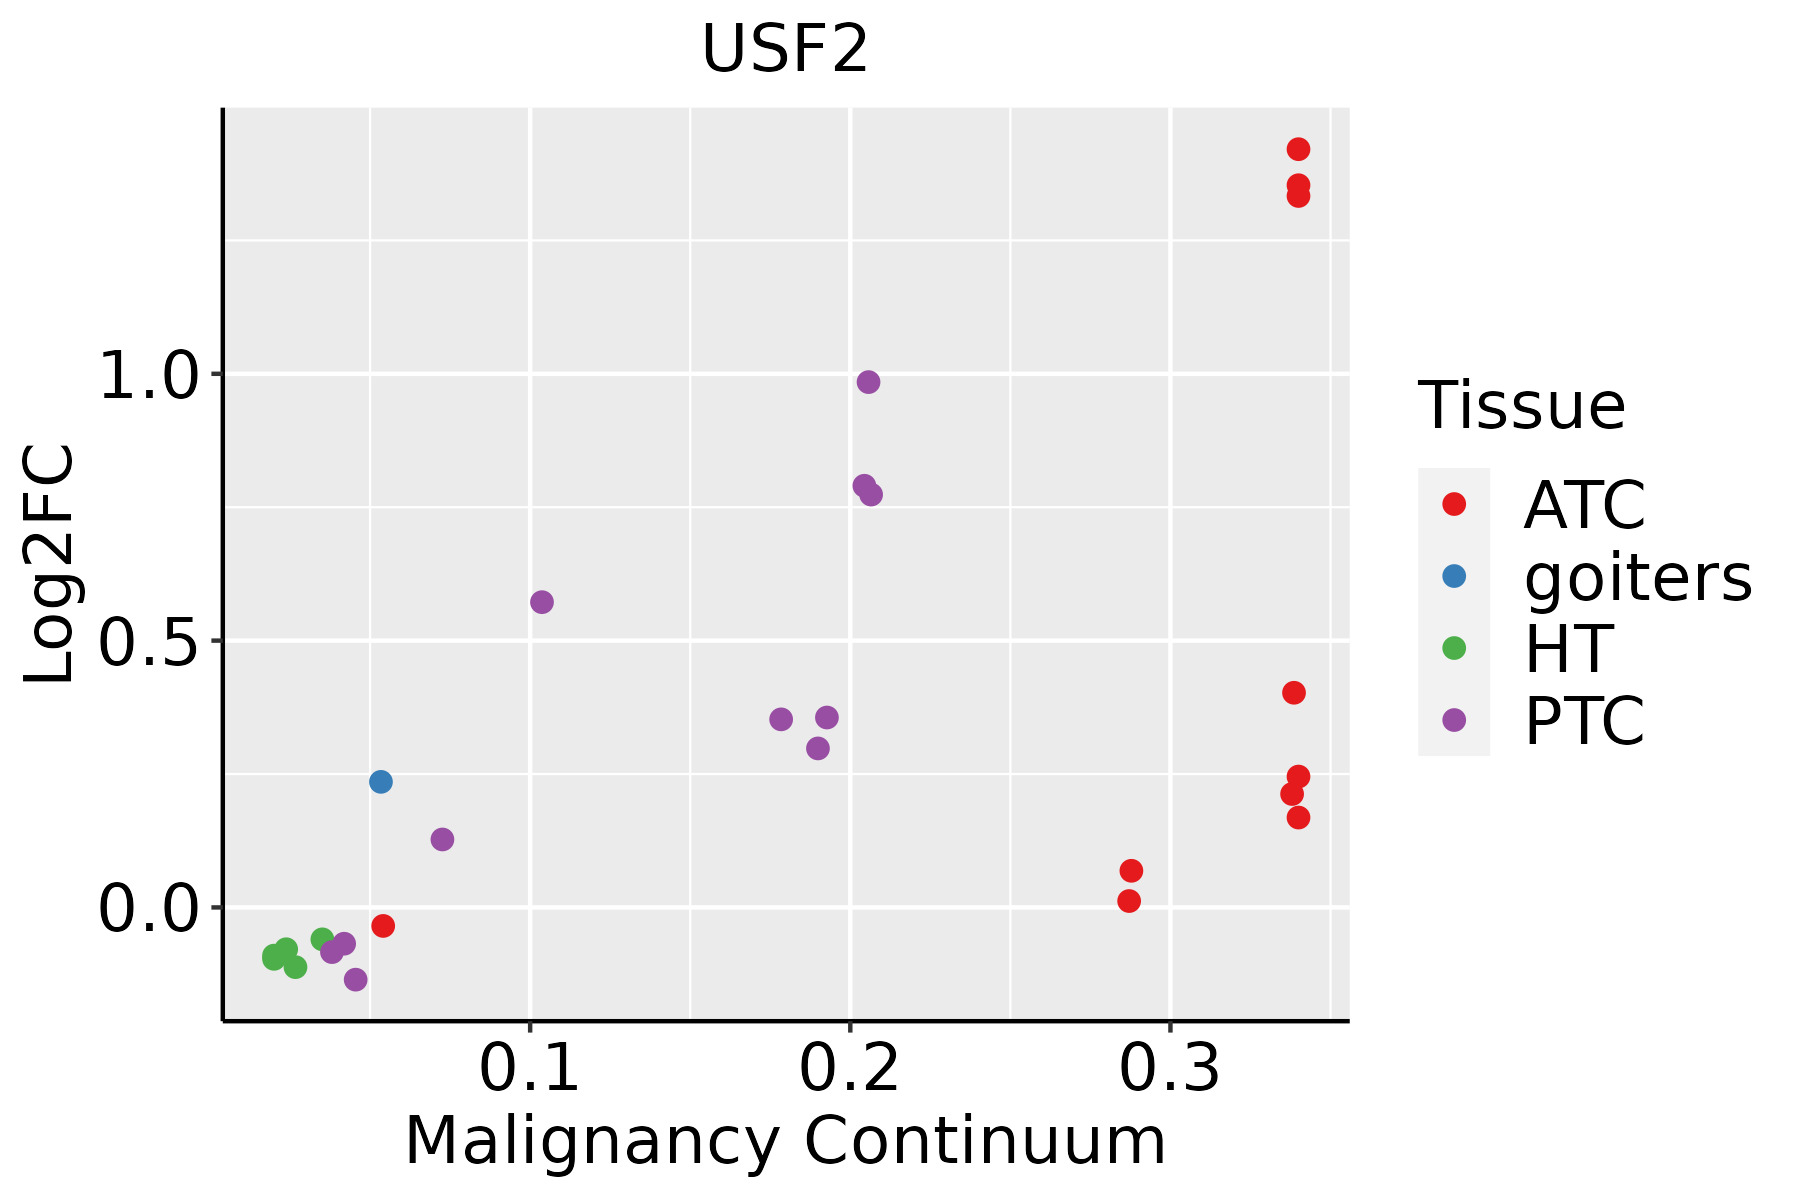 | ATC: Anaplastic thyroid cancer |
| HT: Hashimoto's thyroiditis | ||
| PTC: Papillary thyroid cancer |
| ∗log2FC in expression of this searched gene in stem-like cells from each diseased tissue sample relative to stem-like cells in normal samples in each tissue plotted against the malignancy continuum. Samples are colored based on if they are from different disease stage. |
Top |
Malignant transformation related pathway analysis |
| Find out the enriched GO biological processes and KEGG pathways involved in transition from healthy to precancer to cancer |
| Tissue | Disease Stage | Enriched GO biological Processes |
| Colorectum | AD |  |
| Colorectum | SER |  |
| Colorectum | MSS |  |
| Colorectum | MSI-H |  |
| Colorectum | FAP |  |
| ∗Top 15 enriched GO BP terms are showed in the bar plot of each disease state in each tissue. Each row represents a significant GO biological process which is colored according to the -log10(p.adjust). |
| Page: 1 2 3 4 5 6 7 8 9 |
| GO ID | Tissue | Disease Stage | Description | Gene Ratio | Bg Ratio | pvalue | p.adjust | Count |
| GO:0016032 | Colorectum | AD | viral process | 168/3918 | 415/18723 | 4.67e-20 | 3.66e-17 | 168 |
| GO:0048732 | Colorectum | AD | gland development | 149/3918 | 436/18723 | 6.07e-11 | 6.33e-09 | 149 |
| GO:0019080 | Colorectum | AD | viral gene expression | 42/3918 | 94/18723 | 1.90e-07 | 8.02e-06 | 42 |
| GO:0030879 | Colorectum | AD | mammary gland development | 53/3918 | 137/18723 | 1.46e-06 | 4.58e-05 | 53 |
| GO:0031667 | Colorectum | AD | response to nutrient levels | 138/3918 | 474/18723 | 1.22e-05 | 2.68e-04 | 138 |
| GO:0071496 | Colorectum | AD | cellular response to external stimulus | 94/3918 | 320/18723 | 1.98e-04 | 2.64e-03 | 94 |
| GO:0050878 | Colorectum | AD | regulation of body fluid levels | 108/3918 | 379/18723 | 2.54e-04 | 3.20e-03 | 108 |
| GO:0007589 | Colorectum | AD | body fluid secretion | 33/3918 | 93/18723 | 8.26e-04 | 8.13e-03 | 33 |
| GO:0031668 | Colorectum | AD | cellular response to extracellular stimulus | 71/3918 | 246/18723 | 1.86e-03 | 1.52e-02 | 71 |
| GO:0031669 | Colorectum | AD | cellular response to nutrient levels | 63/3918 | 215/18723 | 2.19e-03 | 1.73e-02 | 63 |
| GO:0007595 | Colorectum | AD | lactation | 18/3918 | 47/18723 | 4.81e-03 | 3.25e-02 | 18 |
| GO:00160321 | Colorectum | SER | viral process | 118/2897 | 415/18723 | 8.36e-12 | 1.65e-09 | 118 |
| GO:00487321 | Colorectum | SER | gland development | 112/2897 | 436/18723 | 1.75e-08 | 1.28e-06 | 112 |
| GO:00316671 | Colorectum | SER | response to nutrient levels | 106/2897 | 474/18723 | 3.94e-05 | 1.00e-03 | 106 |
| GO:00190801 | Colorectum | SER | viral gene expression | 29/2897 | 94/18723 | 1.32e-04 | 2.66e-03 | 29 |
| GO:00308791 | Colorectum | SER | mammary gland development | 37/2897 | 137/18723 | 3.61e-04 | 5.61e-03 | 37 |
| GO:00508781 | Colorectum | SER | regulation of body fluid levels | 81/2897 | 379/18723 | 1.28e-03 | 1.43e-02 | 81 |
| GO:00714961 | Colorectum | SER | cellular response to external stimulus | 70/2897 | 320/18723 | 1.40e-03 | 1.53e-02 | 70 |
| GO:00075891 | Colorectum | SER | body fluid secretion | 26/2897 | 93/18723 | 1.49e-03 | 1.60e-02 | 26 |
| GO:00316681 | Colorectum | SER | cellular response to extracellular stimulus | 54/2897 | 246/18723 | 4.26e-03 | 3.45e-02 | 54 |
| Page: 1 2 3 4 5 6 |
| Pathway ID | Tissue | Disease Stage | Description | Gene Ratio | Bg Ratio | pvalue | p.adjust | qvalue | Count |
| Page: 1 |
Top |
Cell-cell communication analysis |
| Identification of potential cell-cell interactions between two cell types and their ligand-receptor pairs for different disease states |
| Ligand | Receptor | LRpair | Pathway | Tissue | Disease Stage |
| Page: 1 |
Top |
Single-cell gene regulatory network inference analysis |
| Find out the significant the regulons (TFs) and the target genes of each regulon across cell types for different disease states |
| TF | Cell Type | Tissue | Disease Stage | Target Gene | RSS | Regulon Activity |
| USF2 | FIB | Breast | DCIS | BCL7C,ADIRF,NPC2, etc. | 7.45e-01 |  |
| USF2 | ASC | Colorectum | MSS | CXCL14,BATF2,TNFRSF6B, etc. | 4.17e-01 |  |
| USF2 | SEC | Liver | Healthy | FTL,BRI3,C1QB, etc. | 6.93e-01 |  |
| USF2 | ALVMAC | Lung | ADJ | RRAD,OTOA,LINC01684, etc. | 1.26e-01 |  |
| USF2 | MSC.ADIPO | Lung | AAH | PLA2G7,BRI3,LGALS3, etc. | 5.80e-01 |  |
| USF2 | MSC.ADIPO | Lung | ADJ | PLA2G7,BRI3,LGALS3, etc. | 5.15e-01 | |
| USF2 | MSC.ADIPO | Lung | AIS | PLA2G7,BRI3,LGALS3, etc. | 4.34e-01 |  |
| USF2 | ICAF | Lung | Healthy | PLA2G7,BRI3,LGALS3, etc. | 3.43e-01 |  |
| USF2 | MSC.ADIPO | Lung | MIAC | PLA2G7,BRI3,LGALS3, etc. | 2.70e-01 |  |
| USF2 | MSC | Prostate | Tumor | NRK,CNTN1,TRAK2, etc. | 1.33e-02 |  |
| ∗The dot plots of a searched regulon are shown for all cell subpopulations in each disease state of each tissue based on the regulon specific score inferred using pySCENIC and by calculating the average expression. |
| Page: 1 |
Top |
Somatic mutation of malignant transformation related genes |
| Annotation of somatic variants for genes involved in malignant transformation |
| Hugo Symbol | Variant Class | Variant Classification | dbSNP RS | HGVSc | HGVSp | HGVSp Short | SWISSPROT | BIOTYPE | SIFT | PolyPhen | Tumor Sample Barcode | Tissue | Histology | Sex | Age | Stage | Therapy Types | Drugs | Outcome |
| USF2 | SNV | Missense_Mutation | c.813N>T | p.Lys271Asn | p.K271N | Q15853 | protein_coding | deleterious(0) | possibly_damaging(0.875) | TCGA-A2-A0YJ-01 | Breast | breast invasive carcinoma | Female | <65 | III/IV | Chemotherapy | cytoxan | PD | |
| USF2 | SNV | Missense_Mutation | c.747N>A | p.Asp249Glu | p.D249E | Q15853 | protein_coding | deleterious(0) | probably_damaging(0.985) | TCGA-AA-3715-01 | Colorectum | colon adenocarcinoma | Male | >=65 | I/II | Unknown | Unknown | PD | |
| USF2 | SNV | Missense_Mutation | c.815N>T | p.Thr272Met | p.T272M | Q15853 | protein_coding | deleterious(0) | possibly_damaging(0.691) | TCGA-NH-A5IV-01 | Colorectum | colon adenocarcinoma | Female | >=65 | I/II | Unknown | Unknown | SD | |
| USF2 | SNV | Missense_Mutation | rs865961504 | c.943A>G | p.Arg315Gly | p.R315G | Q15853 | protein_coding | deleterious(0) | possibly_damaging(0.71) | TCGA-B5-A3FA-01 | Endometrium | uterine corpus endometrioid carcinoma | Female | >=65 | I/II | Unknown | Unknown | SD |
| USF2 | SNV | Missense_Mutation | c.862N>T | p.Arg288Trp | p.R288W | Q15853 | protein_coding | tolerated(0.07) | probably_damaging(0.97) | TCGA-BG-A0M3-01 | Endometrium | uterine corpus endometrioid carcinoma | Female | >=65 | I/II | Unknown | Unknown | SD | |
| USF2 | SNV | Missense_Mutation | rs770157891 | c.205N>T | p.Arg69Cys | p.R69C | Q15853 | protein_coding | deleterious(0) | probably_damaging(0.996) | TCGA-D1-A163-01 | Endometrium | uterine corpus endometrioid carcinoma | Female | <65 | III/IV | Chemotherapy | taxol | SD |
| USF2 | SNV | Missense_Mutation | novel | c.206N>A | p.Arg69His | p.R69H | Q15853 | protein_coding | deleterious(0.04) | probably_damaging(0.991) | TCGA-D1-A167-01 | Endometrium | uterine corpus endometrioid carcinoma | Female | >=65 | I/II | Unknown | Unknown | SD |
| USF2 | SNV | Missense_Mutation | novel | c.485G>A | p.Ser162Asn | p.S162N | Q15853 | protein_coding | tolerated(0.23) | benign(0.01) | TCGA-EC-A24G-01 | Endometrium | uterine corpus endometrioid carcinoma | Female | <65 | I/II | Chemotherapy | doxorubicin | SD |
| USF2 | SNV | Missense_Mutation | rs368595372 | c.799N>A | p.Ala267Thr | p.A267T | Q15853 | protein_coding | tolerated(0.46) | benign(0.007) | TCGA-EO-A22T-01 | Endometrium | uterine corpus endometrioid carcinoma | Female | <65 | I/II | Unknown | Unknown | SD |
| USF2 | SNV | Missense_Mutation | c.515N>T | p.Ala172Val | p.A172V | Q15853 | protein_coding | deleterious(0.02) | probably_damaging(0.95) | TCGA-FI-A2D0-01 | Endometrium | uterine corpus endometrioid carcinoma | Female | <65 | I/II | Unknown | Unknown | SD |
| Page: 1 2 3 |
Top |
Related drugs of malignant transformation related genes |
| Identification of chemicals and drugs interact with genes involved in malignant transfromation |
| (DGIdb 4.0) |
| Entrez ID | Symbol | Category | Interaction Types | Drug Claim Name | Drug Name | PMIDs |
| Page: 1 |

Copyright 2023-Present -The University of Texas Health Science Center at Houston |