
|
|||||
|
 | |
| |
| |
| |
| |
| |
|
Gene: USF1 |
Gene summary for USF1 |
| Gene information | Species | Human | Gene symbol | USF1 | Gene ID | 7391 |
| Gene name | upstream transcription factor 1 | |
| Gene Alias | FCHL | |
| Cytomap | 1q23.3 | |
| Gene Type | protein-coding | GO ID | GO:0000429 | UniProtAcc | A0A0S2Z4U5 |
Top |
Malignant transformation analysis |
| Identification of the aberrant gene expression in precancerous and cancerous lesions by comparing the gene expression of stem-like cells in diseased tissues with normal stem cells |
| Entrez ID | Symbol | Replicates | Species | Organ | Tissue | Adj P-value | Log2FC | Malignancy |
| 7391 | USF1 | LZE4T | Human | Esophagus | ESCC | 1.40e-05 | 1.87e-01 | 0.0811 |
| 7391 | USF1 | LZE7T | Human | Esophagus | ESCC | 9.66e-03 | 1.69e-01 | 0.0667 |
| 7391 | USF1 | LZE24T | Human | Esophagus | ESCC | 1.48e-06 | 2.85e-01 | 0.0596 |
| 7391 | USF1 | P1T-E | Human | Esophagus | ESCC | 7.96e-05 | 2.15e-01 | 0.0875 |
| 7391 | USF1 | P2T-E | Human | Esophagus | ESCC | 4.48e-14 | 2.24e-01 | 0.1177 |
| 7391 | USF1 | P4T-E | Human | Esophagus | ESCC | 1.14e-11 | 2.96e-01 | 0.1323 |
| 7391 | USF1 | P5T-E | Human | Esophagus | ESCC | 2.22e-08 | 9.42e-02 | 0.1327 |
| 7391 | USF1 | P8T-E | Human | Esophagus | ESCC | 5.10e-10 | 1.81e-01 | 0.0889 |
| 7391 | USF1 | P9T-E | Human | Esophagus | ESCC | 1.01e-05 | 1.76e-01 | 0.1131 |
| 7391 | USF1 | P10T-E | Human | Esophagus | ESCC | 1.81e-10 | 1.91e-01 | 0.116 |
| 7391 | USF1 | P11T-E | Human | Esophagus | ESCC | 2.37e-04 | 2.54e-01 | 0.1426 |
| 7391 | USF1 | P12T-E | Human | Esophagus | ESCC | 4.81e-08 | 1.54e-01 | 0.1122 |
| 7391 | USF1 | P15T-E | Human | Esophagus | ESCC | 1.36e-14 | 3.40e-01 | 0.1149 |
| 7391 | USF1 | P16T-E | Human | Esophagus | ESCC | 1.13e-05 | 1.42e-01 | 0.1153 |
| 7391 | USF1 | P20T-E | Human | Esophagus | ESCC | 2.27e-09 | 2.99e-01 | 0.1124 |
| 7391 | USF1 | P21T-E | Human | Esophagus | ESCC | 6.62e-39 | 7.24e-01 | 0.1617 |
| 7391 | USF1 | P22T-E | Human | Esophagus | ESCC | 3.07e-11 | 2.23e-01 | 0.1236 |
| 7391 | USF1 | P23T-E | Human | Esophagus | ESCC | 3.69e-14 | 3.30e-01 | 0.108 |
| 7391 | USF1 | P24T-E | Human | Esophagus | ESCC | 1.66e-03 | 1.24e-01 | 0.1287 |
| 7391 | USF1 | P26T-E | Human | Esophagus | ESCC | 9.51e-12 | 2.23e-01 | 0.1276 |
| Page: 1 2 3 |
| Tissue | Expression Dynamics | Abbreviation |
| Esophagus | 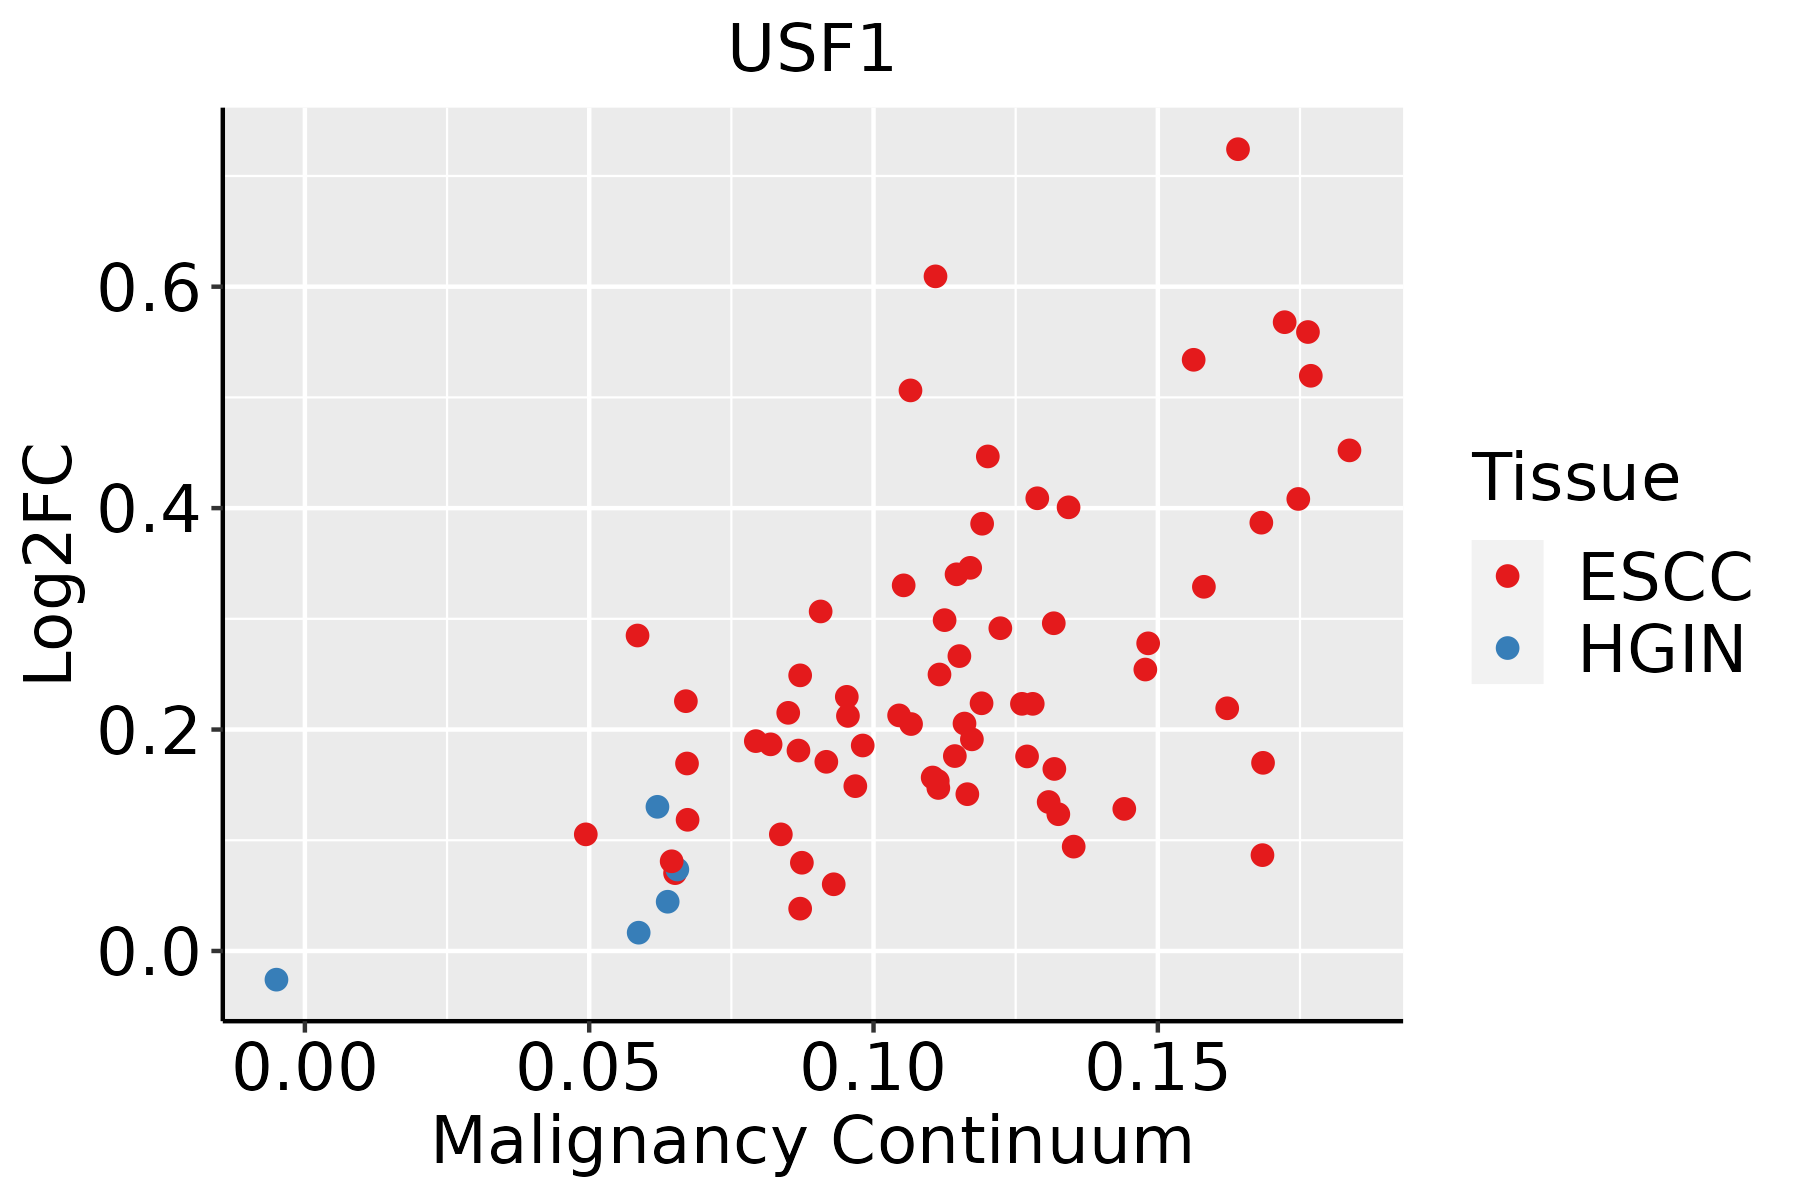 | ESCC: Esophageal squamous cell carcinoma |
| HGIN: High-grade intraepithelial neoplasias | ||
| LGIN: Low-grade intraepithelial neoplasias |
| ∗log2FC in expression of this searched gene in stem-like cells from each diseased tissue sample relative to stem-like cells in normal samples in each tissue plotted against the malignancy continuum. Samples are colored based on if they are from different disease stage. |
Top |
Malignant transformation related pathway analysis |
| Find out the enriched GO biological processes and KEGG pathways involved in transition from healthy to precancer to cancer |
| Tissue | Disease Stage | Enriched GO biological Processes |
| Colorectum | AD |  |
| Colorectum | SER |  |
| Colorectum | MSS |  |
| Colorectum | MSI-H |  |
| Colorectum | FAP |  |
| ∗Top 15 enriched GO BP terms are showed in the bar plot of each disease state in each tissue. Each row represents a significant GO biological process which is colored according to the -log10(p.adjust). |
| Page: 1 2 3 4 5 6 7 8 9 |
| GO ID | Tissue | Disease Stage | Description | Gene Ratio | Bg Ratio | pvalue | p.adjust | Count |
| GO:0016032111 | Esophagus | ESCC | viral process | 301/8552 | 415/18723 | 3.34e-29 | 1.32e-26 | 301 |
| GO:001908017 | Esophagus | ESCC | viral gene expression | 80/8552 | 94/18723 | 2.04e-15 | 1.28e-13 | 80 |
| GO:000941113 | Esophagus | ESCC | response to UV | 115/8552 | 149/18723 | 3.29e-15 | 1.93e-13 | 115 |
| GO:0071496111 | Esophagus | ESCC | cellular response to external stimulus | 215/8552 | 320/18723 | 4.29e-15 | 2.43e-13 | 215 |
| GO:0031668111 | Esophagus | ESCC | cellular response to extracellular stimulus | 168/8552 | 246/18723 | 4.93e-13 | 2.23e-11 | 168 |
| GO:0031669110 | Esophagus | ESCC | cellular response to nutrient levels | 148/8552 | 215/18723 | 4.58e-12 | 1.76e-10 | 148 |
| GO:0031667111 | Esophagus | ESCC | response to nutrient levels | 289/8552 | 474/18723 | 9.25e-12 | 3.47e-10 | 289 |
| GO:000931419 | Esophagus | ESCC | response to radiation | 277/8552 | 456/18723 | 4.42e-11 | 1.43e-09 | 277 |
| GO:0070482111 | Esophagus | ESCC | response to oxygen levels | 218/8552 | 347/18723 | 6.91e-11 | 2.17e-09 | 218 |
| GO:0036293111 | Esophagus | ESCC | response to decreased oxygen levels | 201/8552 | 322/18723 | 8.37e-10 | 2.04e-08 | 201 |
| GO:0001666111 | Esophagus | ESCC | response to hypoxia | 192/8552 | 307/18723 | 1.59e-09 | 3.69e-08 | 192 |
| GO:000758410 | Esophagus | ESCC | response to nutrient | 114/8552 | 174/18723 | 9.43e-08 | 1.56e-06 | 114 |
| GO:00059969 | Esophagus | ESCC | monosaccharide metabolic process | 159/8552 | 257/18723 | 1.11e-07 | 1.81e-06 | 159 |
| GO:001908312 | Esophagus | ESCC | viral transcription | 41/8552 | 50/18723 | 1.35e-07 | 2.17e-06 | 41 |
| GO:00193189 | Esophagus | ESCC | hexose metabolic process | 147/8552 | 237/18723 | 2.63e-07 | 3.94e-06 | 147 |
| GO:004206027 | Esophagus | ESCC | wound healing | 243/8552 | 422/18723 | 4.62e-07 | 6.25e-06 | 243 |
| GO:190165319 | Esophagus | ESCC | cellular response to peptide | 208/8552 | 359/18723 | 1.68e-06 | 2.01e-05 | 208 |
| GO:0043434111 | Esophagus | ESCC | response to peptide hormone | 234/8552 | 414/18723 | 4.93e-06 | 5.21e-05 | 234 |
| GO:003286918 | Esophagus | ESCC | cellular response to insulin stimulus | 124/8552 | 203/18723 | 6.63e-06 | 6.75e-05 | 124 |
| GO:003286818 | Esophagus | ESCC | response to insulin | 156/8552 | 264/18723 | 7.21e-06 | 7.20e-05 | 156 |
| Page: 1 2 |
| Pathway ID | Tissue | Disease Stage | Description | Gene Ratio | Bg Ratio | pvalue | p.adjust | qvalue | Count |
| Page: 1 |
Top |
Cell-cell communication analysis |
| Identification of potential cell-cell interactions between two cell types and their ligand-receptor pairs for different disease states |
| Ligand | Receptor | LRpair | Pathway | Tissue | Disease Stage |
| Page: 1 |
Top |
Single-cell gene regulatory network inference analysis |
| Find out the significant the regulons (TFs) and the target genes of each regulon across cell types for different disease states |
| TF | Cell Type | Tissue | Disease Stage | Target Gene | RSS | Regulon Activity |
| USF1 | NK | Oral cavity | ADJ | CCL8,HLA-DQB2,ZSWIM5, etc. | 4.54e-02 |  |
| USF1 | CD8TEXP | Oral cavity | ADJ | CCL8,HLA-DQB2,ZSWIM5, etc. | 3.07e-02 | |
| USF1 | M1MAC | Oral cavity | NEOLP | CCL8,HLA-DQB2,ZSWIM5, etc. | 8.67e-02 |  |
| ∗The dot plots of a searched regulon are shown for all cell subpopulations in each disease state of each tissue based on the regulon specific score inferred using pySCENIC and by calculating the average expression. |
| Page: 1 |
Top |
Somatic mutation of malignant transformation related genes |
| Annotation of somatic variants for genes involved in malignant transformation |
| Hugo Symbol | Variant Class | Variant Classification | dbSNP RS | HGVSc | HGVSp | HGVSp Short | SWISSPROT | BIOTYPE | SIFT | PolyPhen | Tumor Sample Barcode | Tissue | Histology | Sex | Age | Stage | Therapy Types | Drugs | Outcome |
| USF1 | SNV | Missense_Mutation | c.629N>A | p.Arg210His | p.R210H | P22415 | protein_coding | deleterious(0.03) | probably_damaging(0.987) | TCGA-AA-A010-01 | Colorectum | colon adenocarcinoma | Female | <65 | I/II | Chemotherapy | folinic | CR | |
| USF1 | SNV | Missense_Mutation | c.409N>T | p.Ala137Ser | p.A137S | P22415 | protein_coding | tolerated(0.24) | benign(0.039) | TCGA-AA-A010-01 | Colorectum | colon adenocarcinoma | Female | <65 | I/II | Chemotherapy | folinic | CR | |
| USF1 | deletion | Frame_Shift_Del | c.389delN | p.Gly130ValfsTer33 | p.G130Vfs*33 | P22415 | protein_coding | TCGA-AA-3672-01 | Colorectum | colon adenocarcinoma | Female | >=65 | III/IV | Unknown | Unknown | SD | |||
| USF1 | deletion | Frame_Shift_Del | c.389delN | p.Gly130ValfsTer33 | p.G130Vfs*33 | P22415 | protein_coding | TCGA-AA-3947-01 | Colorectum | colon adenocarcinoma | Female | <65 | I/II | Unknown | Unknown | SD | |||
| USF1 | deletion | Frame_Shift_Del | c.389delG | p.Gly130ValfsTer33 | p.G130Vfs*33 | P22415 | protein_coding | TCGA-AD-5900-01 | Colorectum | colon adenocarcinoma | Male | >=65 | I/II | Unknown | Unknown | SD | |||
| USF1 | SNV | Missense_Mutation | novel | c.329N>T | p.Thr110Ile | p.T110I | P22415 | protein_coding | tolerated(0.22) | benign(0.045) | TCGA-A5-A0G2-01 | Endometrium | uterine corpus endometrioid carcinoma | Female | <65 | III/IV | Unknown | Unknown | SD |
| USF1 | SNV | Missense_Mutation | c.11N>C | p.Gln4Pro | p.Q4P | P22415 | protein_coding | deleterious_low_confidence(0.01) | benign(0.019) | TCGA-A5-A0GP-01 | Endometrium | uterine corpus endometrioid carcinoma | Female | <65 | I/II | Unknown | Unknown | SD | |
| USF1 | SNV | Missense_Mutation | rs142286568 | c.116C>T | p.Ala39Val | p.A39V | P22415 | protein_coding | deleterious(0) | possibly_damaging(0.86) | TCGA-AP-A051-01 | Endometrium | uterine corpus endometrioid carcinoma | Female | >=65 | I/II | Unknown | Unknown | SD |
| USF1 | SNV | Missense_Mutation | c.155G>A | p.Arg52Gln | p.R52Q | P22415 | protein_coding | deleterious(0) | probably_damaging(0.932) | TCGA-AP-A056-01 | Endometrium | uterine corpus endometrioid carcinoma | Female | <65 | I/II | Unknown | Unknown | SD | |
| USF1 | SNV | Missense_Mutation | rs780697534 | c.898N>A | p.Gly300Arg | p.G300R | P22415 | protein_coding | deleterious(0) | probably_damaging(0.986) | TCGA-AP-A0LM-01 | Endometrium | uterine corpus endometrioid carcinoma | Female | <65 | III/IV | Chemotherapy | cisplatin | SD |
| Page: 1 2 3 4 |
Top |
Related drugs of malignant transformation related genes |
| Identification of chemicals and drugs interact with genes involved in malignant transfromation |
| (DGIdb 4.0) |
| Entrez ID | Symbol | Category | Interaction Types | Drug Claim Name | Drug Name | PMIDs |
| Page: 1 |

Copyright 2023-Present -The University of Texas Health Science Center at Houston |