
|
|||||
|
 | |
| |
| |
| |
| |
| |
|
Gene: USB1 |
Gene summary for USB1 |
| Gene information | Species | Human | Gene symbol | USB1 | Gene ID | 79650 |
| Gene name | U6 snRNA biogenesis phosphodiesterase 1 | |
| Gene Alias | C16orf57 | |
| Cytomap | 16q21 | |
| Gene Type | protein-coding | GO ID | GO:0006139 | UniProtAcc | Q9BQ65 |
Top |
Malignant transformation analysis |
| Identification of the aberrant gene expression in precancerous and cancerous lesions by comparing the gene expression of stem-like cells in diseased tissues with normal stem cells |
| Entrez ID | Symbol | Replicates | Species | Organ | Tissue | Adj P-value | Log2FC | Malignancy |
| 79650 | USB1 | HTA11_2487_2000001011 | Human | Colorectum | SER | 1.04e-08 | 3.50e-01 | -0.1808 |
| 79650 | USB1 | HTA11_1938_2000001011 | Human | Colorectum | AD | 1.16e-02 | 2.24e-01 | -0.0811 |
| 79650 | USB1 | HTA11_347_2000001011 | Human | Colorectum | AD | 1.14e-03 | 1.93e-01 | -0.1954 |
| 79650 | USB1 | HTA11_2112_2000001011 | Human | Colorectum | SER | 1.49e-03 | 5.30e-01 | -0.2196 |
| 79650 | USB1 | HTA11_3361_2000001011 | Human | Colorectum | AD | 1.43e-03 | 3.10e-01 | -0.1207 |
| 79650 | USB1 | HTA11_696_2000001011 | Human | Colorectum | AD | 1.73e-08 | 3.18e-01 | -0.1464 |
| 79650 | USB1 | HTA11_1391_2000001011 | Human | Colorectum | AD | 1.04e-09 | 3.64e-01 | -0.059 |
| 79650 | USB1 | HTA11_7696_3000711011 | Human | Colorectum | AD | 3.66e-03 | 2.01e-01 | 0.0674 |
| 79650 | USB1 | HTA11_99999970781_79442 | Human | Colorectum | MSS | 1.45e-02 | 2.13e-01 | 0.294 |
| 79650 | USB1 | HTA11_99999971662_82457 | Human | Colorectum | MSS | 4.53e-12 | 3.55e-01 | 0.3859 |
| 79650 | USB1 | HTA11_99999974143_84620 | Human | Colorectum | MSS | 2.88e-03 | 2.26e-01 | 0.3005 |
| 79650 | USB1 | LZE4T | Human | Esophagus | ESCC | 9.40e-12 | 4.14e-01 | 0.0811 |
| 79650 | USB1 | LZE7T | Human | Esophagus | ESCC | 7.75e-08 | 5.78e-01 | 0.0667 |
| 79650 | USB1 | LZE8T | Human | Esophagus | ESCC | 2.58e-07 | 4.57e-01 | 0.067 |
| 79650 | USB1 | LZE20T | Human | Esophagus | ESCC | 1.23e-02 | 1.29e-01 | 0.0662 |
| 79650 | USB1 | LZE22D1 | Human | Esophagus | HGIN | 3.23e-02 | 1.14e-01 | 0.0595 |
| 79650 | USB1 | LZE22T | Human | Esophagus | ESCC | 2.42e-05 | 5.62e-01 | 0.068 |
| 79650 | USB1 | LZE24T | Human | Esophagus | ESCC | 2.77e-14 | 3.82e-01 | 0.0596 |
| 79650 | USB1 | LZE6T | Human | Esophagus | ESCC | 4.78e-06 | 4.74e-01 | 0.0845 |
| 79650 | USB1 | P2T-E | Human | Esophagus | ESCC | 1.47e-13 | 2.19e-01 | 0.1177 |
| Page: 1 2 3 4 5 6 |
| Tissue | Expression Dynamics | Abbreviation |
| Colorectum (GSE201348) |  | FAP: Familial adenomatous polyposis |
| CRC: Colorectal cancer | ||
| Colorectum (HTA11) |  | AD: Adenomas |
| SER: Sessile serrated lesions | ||
| MSI-H: Microsatellite-high colorectal cancer | ||
| MSS: Microsatellite stable colorectal cancer | ||
| Esophagus |  | ESCC: Esophageal squamous cell carcinoma |
| HGIN: High-grade intraepithelial neoplasias | ||
| LGIN: Low-grade intraepithelial neoplasias | ||
| Liver | 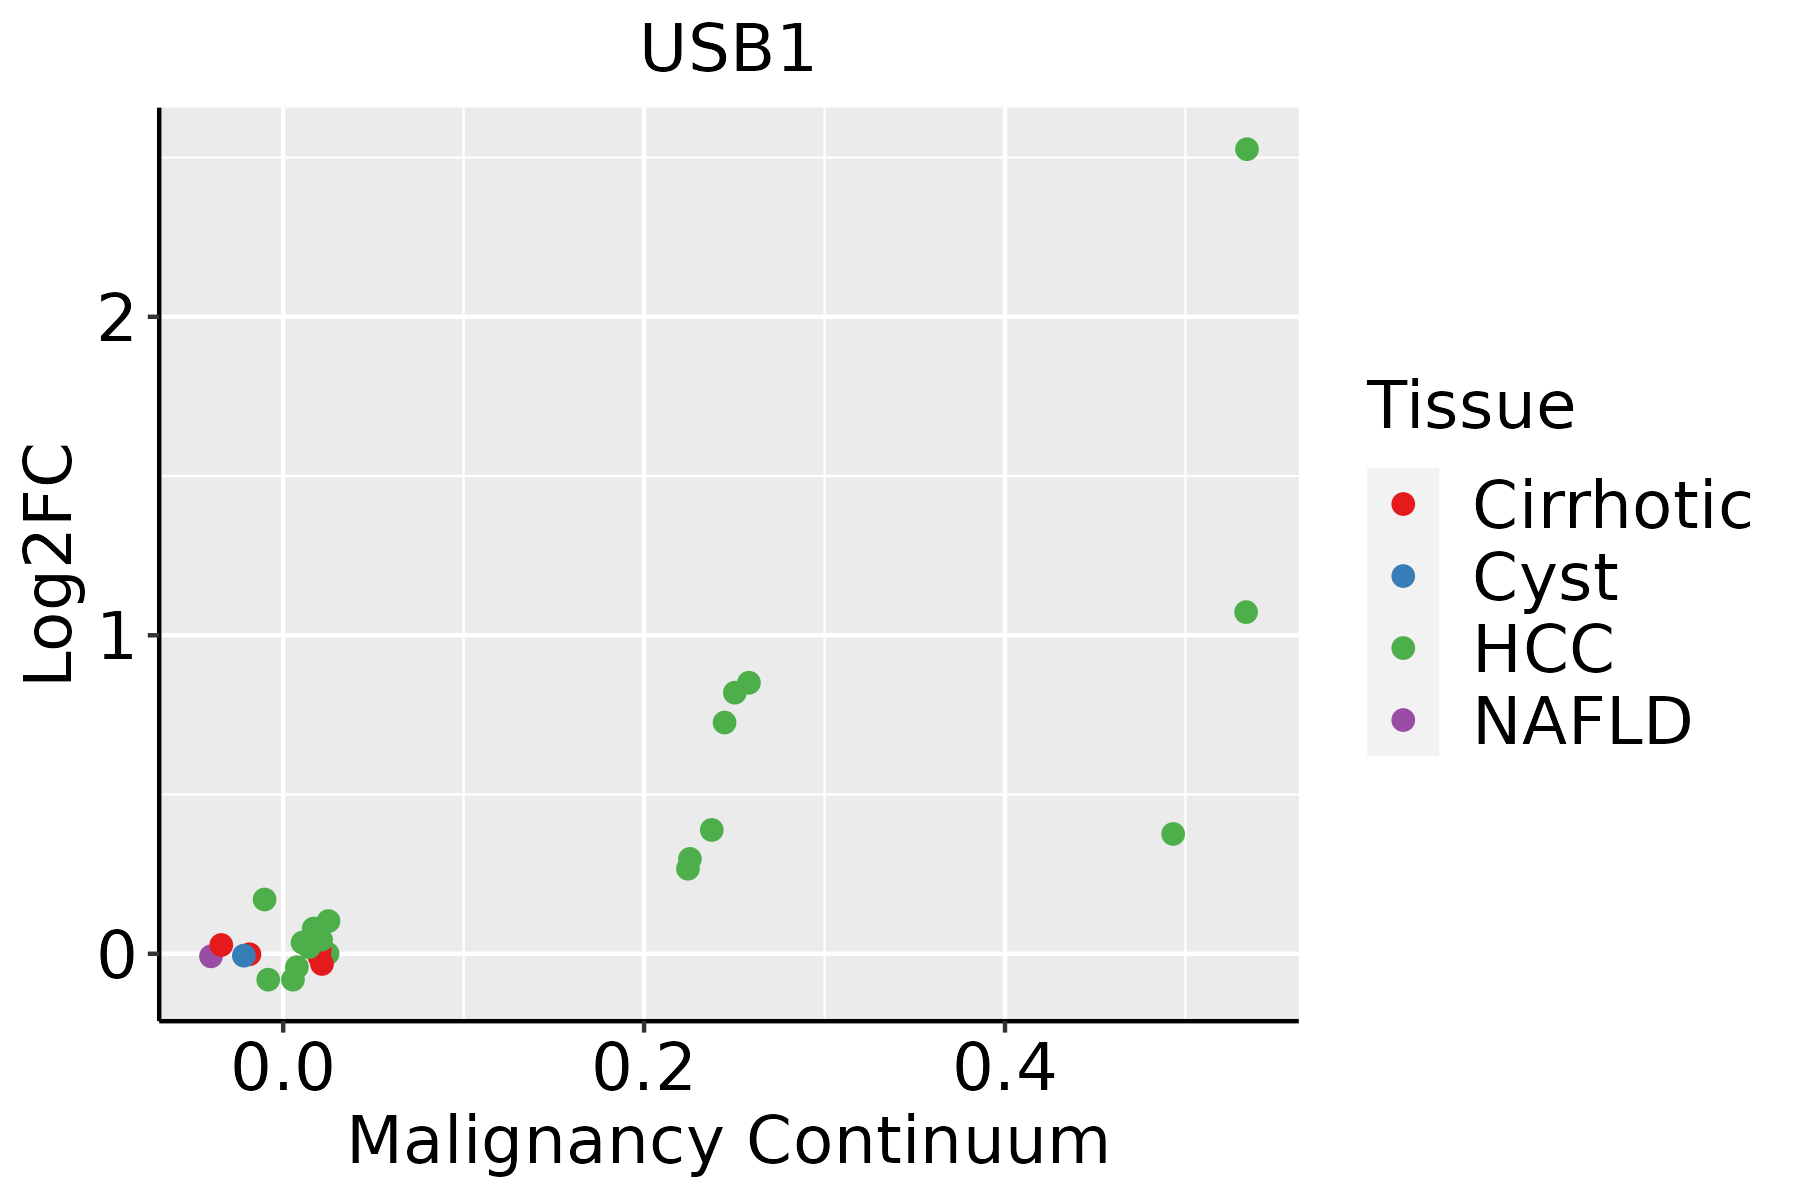 | HCC: Hepatocellular carcinoma |
| NAFLD: Non-alcoholic fatty liver disease | ||
| Oral Cavity |  | EOLP: Erosive Oral lichen planus |
| LP: leukoplakia | ||
| NEOLP: Non-erosive oral lichen planus | ||
| OSCC: Oral squamous cell carcinoma | ||
| Skin | 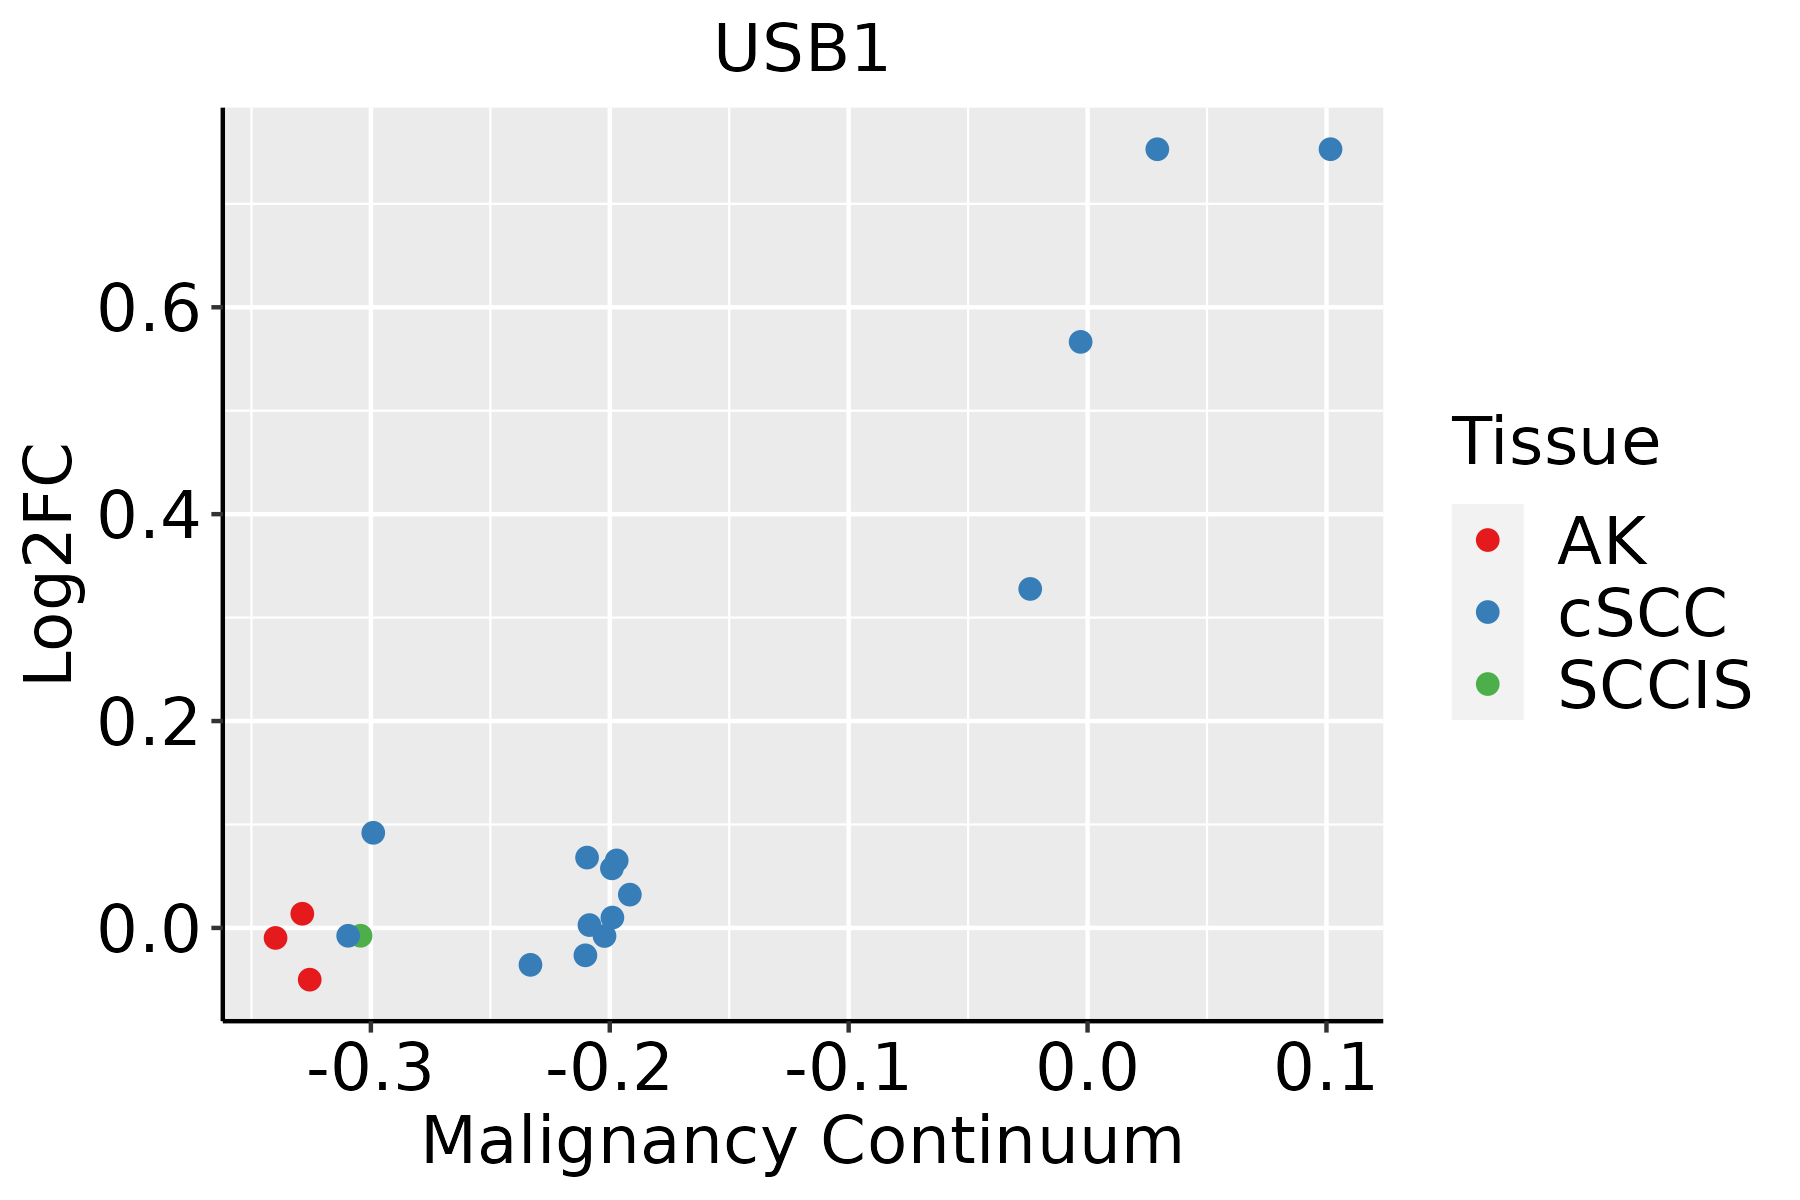 | AK: Actinic keratosis |
| cSCC: Cutaneous squamous cell carcinoma | ||
| SCCIS:squamous cell carcinoma in situ | ||
| Thyroid | 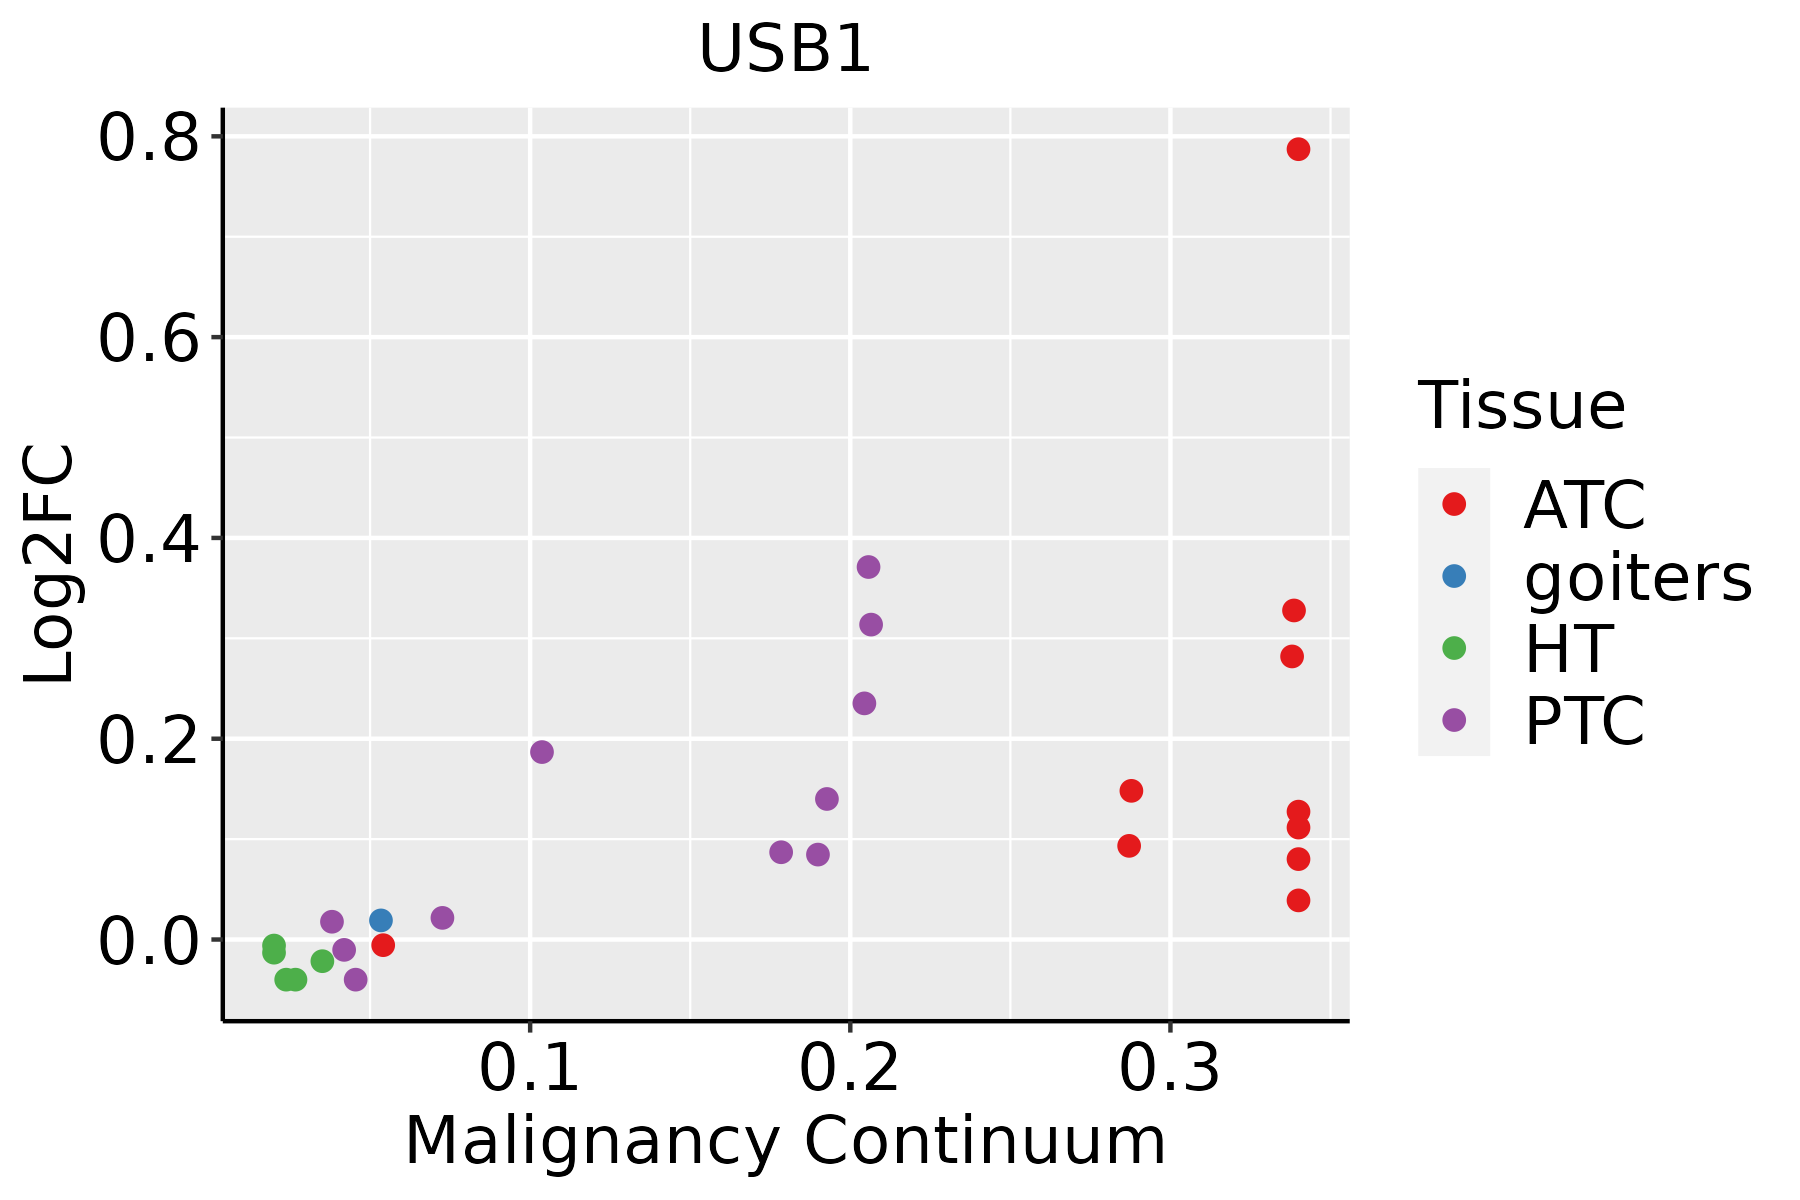 | ATC: Anaplastic thyroid cancer |
| HT: Hashimoto's thyroiditis | ||
| PTC: Papillary thyroid cancer |
| ∗log2FC in expression of this searched gene in stem-like cells from each diseased tissue sample relative to stem-like cells in normal samples in each tissue plotted against the malignancy continuum. Samples are colored based on if they are from different disease stage. |
Top |
Malignant transformation related pathway analysis |
| Find out the enriched GO biological processes and KEGG pathways involved in transition from healthy to precancer to cancer |
| Tissue | Disease Stage | Enriched GO biological Processes |
| Colorectum | AD |  |
| Colorectum | SER |  |
| Colorectum | MSS |  |
| Colorectum | MSI-H |  |
| Colorectum | FAP |  |
| ∗Top 15 enriched GO BP terms are showed in the bar plot of each disease state in each tissue. Each row represents a significant GO biological process which is colored according to the -log10(p.adjust). |
| Page: 1 2 3 4 5 6 7 8 9 |
| GO ID | Tissue | Disease Stage | Description | Gene Ratio | Bg Ratio | pvalue | p.adjust | Count |
| GO:0008380 | Colorectum | AD | RNA splicing | 169/3918 | 434/18723 | 3.59e-18 | 2.04e-15 | 169 |
| GO:00083801 | Colorectum | SER | RNA splicing | 123/2897 | 434/18723 | 3.84e-12 | 8.41e-10 | 123 |
| GO:00083802 | Colorectum | MSS | RNA splicing | 159/3467 | 434/18723 | 1.75e-19 | 1.22e-16 | 159 |
| GO:000838026 | Esophagus | HGIN | RNA splicing | 160/2587 | 434/18723 | 3.74e-34 | 1.12e-30 | 160 |
| GO:003447010 | Esophagus | HGIN | ncRNA processing | 97/2587 | 395/18723 | 5.92e-09 | 3.90e-07 | 97 |
| GO:00346606 | Esophagus | HGIN | ncRNA metabolic process | 104/2587 | 485/18723 | 2.26e-06 | 8.23e-05 | 104 |
| GO:0008380111 | Esophagus | ESCC | RNA splicing | 336/8552 | 434/18723 | 1.74e-42 | 3.67e-39 | 336 |
| GO:003447015 | Esophagus | ESCC | ncRNA processing | 300/8552 | 395/18723 | 3.09e-35 | 3.26e-32 | 300 |
| GO:003466012 | Esophagus | ESCC | ncRNA metabolic process | 346/8552 | 485/18723 | 4.35e-31 | 2.51e-28 | 346 |
| GO:00905013 | Esophagus | ESCC | RNA phosphodiester bond hydrolysis | 110/8552 | 152/18723 | 1.95e-11 | 6.81e-10 | 110 |
| GO:00903053 | Esophagus | ESCC | nucleic acid phosphodiester bond hydrolysis | 163/8552 | 261/18723 | 3.07e-08 | 5.73e-07 | 163 |
| GO:00905033 | Esophagus | ESCC | RNA phosphodiester bond hydrolysis, exonucleolytic | 35/8552 | 42/18723 | 5.35e-07 | 7.11e-06 | 35 |
| GO:00311233 | Esophagus | ESCC | RNA 3'-end processing | 76/8552 | 116/18723 | 1.25e-05 | 1.15e-04 | 76 |
| GO:00344702 | Liver | HCC | ncRNA processing | 293/7958 | 395/18723 | 4.26e-38 | 6.76e-35 | 293 |
| GO:000838022 | Liver | HCC | RNA splicing | 313/7958 | 434/18723 | 1.36e-36 | 1.73e-33 | 313 |
| GO:00346601 | Liver | HCC | ncRNA metabolic process | 332/7958 | 485/18723 | 1.48e-31 | 7.80e-29 | 332 |
| GO:00905011 | Liver | HCC | RNA phosphodiester bond hydrolysis | 101/7958 | 152/18723 | 1.99e-09 | 5.63e-08 | 101 |
| GO:00311231 | Liver | HCC | RNA 3'-end processing | 81/7958 | 116/18723 | 2.27e-09 | 6.32e-08 | 81 |
| GO:0090305 | Liver | HCC | nucleic acid phosphodiester bond hydrolysis | 152/7958 | 261/18723 | 1.90e-07 | 3.46e-06 | 152 |
| GO:00905031 | Liver | HCC | RNA phosphodiester bond hydrolysis, exonucleolytic | 29/7958 | 42/18723 | 4.57e-04 | 3.04e-03 | 29 |
| Page: 1 2 3 |
| Pathway ID | Tissue | Disease Stage | Description | Gene Ratio | Bg Ratio | pvalue | p.adjust | qvalue | Count |
| Page: 1 |
Top |
Cell-cell communication analysis |
| Identification of potential cell-cell interactions between two cell types and their ligand-receptor pairs for different disease states |
| Ligand | Receptor | LRpair | Pathway | Tissue | Disease Stage |
| Page: 1 |
Top |
Single-cell gene regulatory network inference analysis |
| Find out the significant the regulons (TFs) and the target genes of each regulon across cell types for different disease states |
| TF | Cell Type | Tissue | Disease Stage | Target Gene | RSS | Regulon Activity |
| ∗The dot plots of a searched regulon are shown for all cell subpopulations in each disease state of each tissue based on the regulon specific score inferred using pySCENIC and by calculating the average expression. |
| Page: 1 |
Top |
Somatic mutation of malignant transformation related genes |
| Annotation of somatic variants for genes involved in malignant transformation |
| Hugo Symbol | Variant Class | Variant Classification | dbSNP RS | HGVSc | HGVSp | HGVSp Short | SWISSPROT | BIOTYPE | SIFT | PolyPhen | Tumor Sample Barcode | Tissue | Histology | Sex | Age | Stage | Therapy Types | Drugs | Outcome |
| USB1 | SNV | Missense_Mutation | rs146419360 | c.754C>T | p.Arg252Cys | p.R252C | Q9BQ65 | protein_coding | deleterious(0) | probably_damaging(0.98) | TCGA-AA-3950-01 | Colorectum | colon adenocarcinoma | Female | >=65 | I/II | Unknown | Unknown | SD |
| USB1 | SNV | Missense_Mutation | rs199886884 | c.389N>A | p.Arg130His | p.R130H | Q9BQ65 | protein_coding | deleterious(0.01) | probably_damaging(0.991) | TCGA-AA-A01R-01 | Colorectum | colon adenocarcinoma | Male | <65 | III/IV | Chemotherapy | 5-fluorouracil | PD |
| USB1 | SNV | Missense_Mutation | rs769898628 | c.388N>T | p.Arg130Cys | p.R130C | Q9BQ65 | protein_coding | deleterious(0) | probably_damaging(0.991) | TCGA-AD-6889-01 | Colorectum | colon adenocarcinoma | Male | >=65 | I/II | Chemotherapy | xeloda | PD |
| USB1 | SNV | Missense_Mutation | rs774644058 | c.430C>T | p.Arg144Cys | p.R144C | Q9BQ65 | protein_coding | tolerated(0.12) | benign(0.019) | TCGA-AZ-6601-01 | Colorectum | colon adenocarcinoma | Male | >=65 | I/II | Unknown | Unknown | PD |
| USB1 | SNV | Missense_Mutation | c.449N>T | p.Arg150Ile | p.R150I | Q9BQ65 | protein_coding | deleterious(0) | probably_damaging(0.972) | TCGA-F4-6570-01 | Colorectum | colon adenocarcinoma | Female | >=65 | I/II | Unknown | Unknown | SD | |
| USB1 | insertion | Frame_Shift_Ins | novel | c.460_461insCTGC | p.Asn156CysfsTer20 | p.N156Cfs*20 | Q9BQ65 | protein_coding | TCGA-F5-6813-01 | Colorectum | rectum adenocarcinoma | Male | >=65 | III/IV | Unknown | Unknown | PD | ||
| USB1 | SNV | Missense_Mutation | novel | c.184N>T | p.Asp62Tyr | p.D62Y | Q9BQ65 | protein_coding | deleterious(0) | probably_damaging(0.995) | TCGA-A5-A0G2-01 | Endometrium | uterine corpus endometrioid carcinoma | Female | <65 | III/IV | Unknown | Unknown | SD |
| USB1 | SNV | Missense_Mutation | c.467N>G | p.Asn156Ser | p.N156S | Q9BQ65 | protein_coding | tolerated(0.23) | benign(0.055) | TCGA-AP-A059-01 | Endometrium | uterine corpus endometrioid carcinoma | Female | >=65 | I/II | Unknown | Unknown | SD | |
| USB1 | SNV | Missense_Mutation | novel | c.418G>A | p.Ala140Thr | p.A140T | Q9BQ65 | protein_coding | tolerated(0.19) | benign(0.033) | TCGA-AP-A1DK-01 | Endometrium | uterine corpus endometrioid carcinoma | Female | <65 | I/II | Unknown | Unknown | SD |
| USB1 | SNV | Missense_Mutation | rs769067404 | c.412N>A | p.Val138Met | p.V138M | Q9BQ65 | protein_coding | tolerated(0.13) | benign(0.164) | TCGA-AX-A1CE-01 | Endometrium | uterine corpus endometrioid carcinoma | Female | <65 | I/II | Unspecific | Paclitaxel | SD |
| Page: 1 2 3 |
Top |
Related drugs of malignant transformation related genes |
| Identification of chemicals and drugs interact with genes involved in malignant transfromation |
| (DGIdb 4.0) |
| Entrez ID | Symbol | Category | Interaction Types | Drug Claim Name | Drug Name | PMIDs |
| Page: 1 |

Copyright 2023-Present -The University of Texas Health Science Center at Houston |