
|
|||||
|
 | |
| |
| |
| |
| |
| |
|
Gene: URM1 |
Gene summary for URM1 |
| Gene information | Species | Human | Gene symbol | URM1 | Gene ID | 81605 |
| Gene name | ubiquitin related modifier 1 | |
| Gene Alias | C9orf74 | |
| Cytomap | 9q34.11 | |
| Gene Type | protein-coding | GO ID | GO:0002097 | UniProtAcc | Q9BTM9 |
Top |
Malignant transformation analysis |
| Identification of the aberrant gene expression in precancerous and cancerous lesions by comparing the gene expression of stem-like cells in diseased tissues with normal stem cells |
| Entrez ID | Symbol | Replicates | Species | Organ | Tissue | Adj P-value | Log2FC | Malignancy |
| 81605 | URM1 | HTA11_2487_2000001011 | Human | Colorectum | SER | 2.37e-05 | 3.40e-01 | -0.1808 |
| 81605 | URM1 | HTA11_1938_2000001011 | Human | Colorectum | AD | 2.22e-06 | 4.13e-01 | -0.0811 |
| 81605 | URM1 | HTA11_347_2000001011 | Human | Colorectum | AD | 4.79e-05 | 2.62e-01 | -0.1954 |
| 81605 | URM1 | HTA11_696_2000001011 | Human | Colorectum | AD | 3.90e-09 | 3.51e-01 | -0.1464 |
| 81605 | URM1 | HTA11_1391_2000001011 | Human | Colorectum | AD | 5.68e-08 | 4.65e-01 | -0.059 |
| 81605 | URM1 | HTA11_546_2000001011 | Human | Colorectum | AD | 9.71e-05 | 4.69e-01 | -0.0842 |
| 81605 | URM1 | HTA11_10623_2000001011 | Human | Colorectum | AD | 1.23e-04 | 4.85e-01 | -0.0177 |
| 81605 | URM1 | HTA11_7696_3000711011 | Human | Colorectum | AD | 3.29e-13 | 4.71e-01 | 0.0674 |
| 81605 | URM1 | HTA11_6818_2000001021 | Human | Colorectum | AD | 9.89e-03 | 3.06e-01 | 0.0588 |
| 81605 | URM1 | HTA11_99999970781_79442 | Human | Colorectum | MSS | 2.47e-03 | 2.89e-01 | 0.294 |
| 81605 | URM1 | HTA11_99999965104_69814 | Human | Colorectum | MSS | 3.50e-09 | 6.57e-01 | 0.281 |
| 81605 | URM1 | HTA11_99999971662_82457 | Human | Colorectum | MSS | 1.31e-09 | 5.21e-01 | 0.3859 |
| 81605 | URM1 | HTA11_99999974143_84620 | Human | Colorectum | MSS | 4.21e-05 | 3.24e-01 | 0.3005 |
| 81605 | URM1 | LZE2T | Human | Esophagus | ESCC | 9.98e-06 | 4.85e-01 | 0.082 |
| 81605 | URM1 | LZE4T | Human | Esophagus | ESCC | 1.31e-12 | 4.16e-01 | 0.0811 |
| 81605 | URM1 | LZE5T | Human | Esophagus | ESCC | 5.13e-04 | 2.40e-01 | 0.0514 |
| 81605 | URM1 | LZE7T | Human | Esophagus | ESCC | 6.34e-11 | 4.69e-01 | 0.0667 |
| 81605 | URM1 | LZE8T | Human | Esophagus | ESCC | 9.62e-15 | 3.39e-01 | 0.067 |
| 81605 | URM1 | LZE20T | Human | Esophagus | ESCC | 1.95e-17 | 5.58e-01 | 0.0662 |
| 81605 | URM1 | LZE22D1 | Human | Esophagus | HGIN | 4.63e-03 | 1.33e-01 | 0.0595 |
| Page: 1 2 3 4 5 6 |
| Tissue | Expression Dynamics | Abbreviation |
| Colorectum (GSE201348) |  | FAP: Familial adenomatous polyposis |
| CRC: Colorectal cancer | ||
| Colorectum (HTA11) |  | AD: Adenomas |
| SER: Sessile serrated lesions | ||
| MSI-H: Microsatellite-high colorectal cancer | ||
| MSS: Microsatellite stable colorectal cancer | ||
| Esophagus | 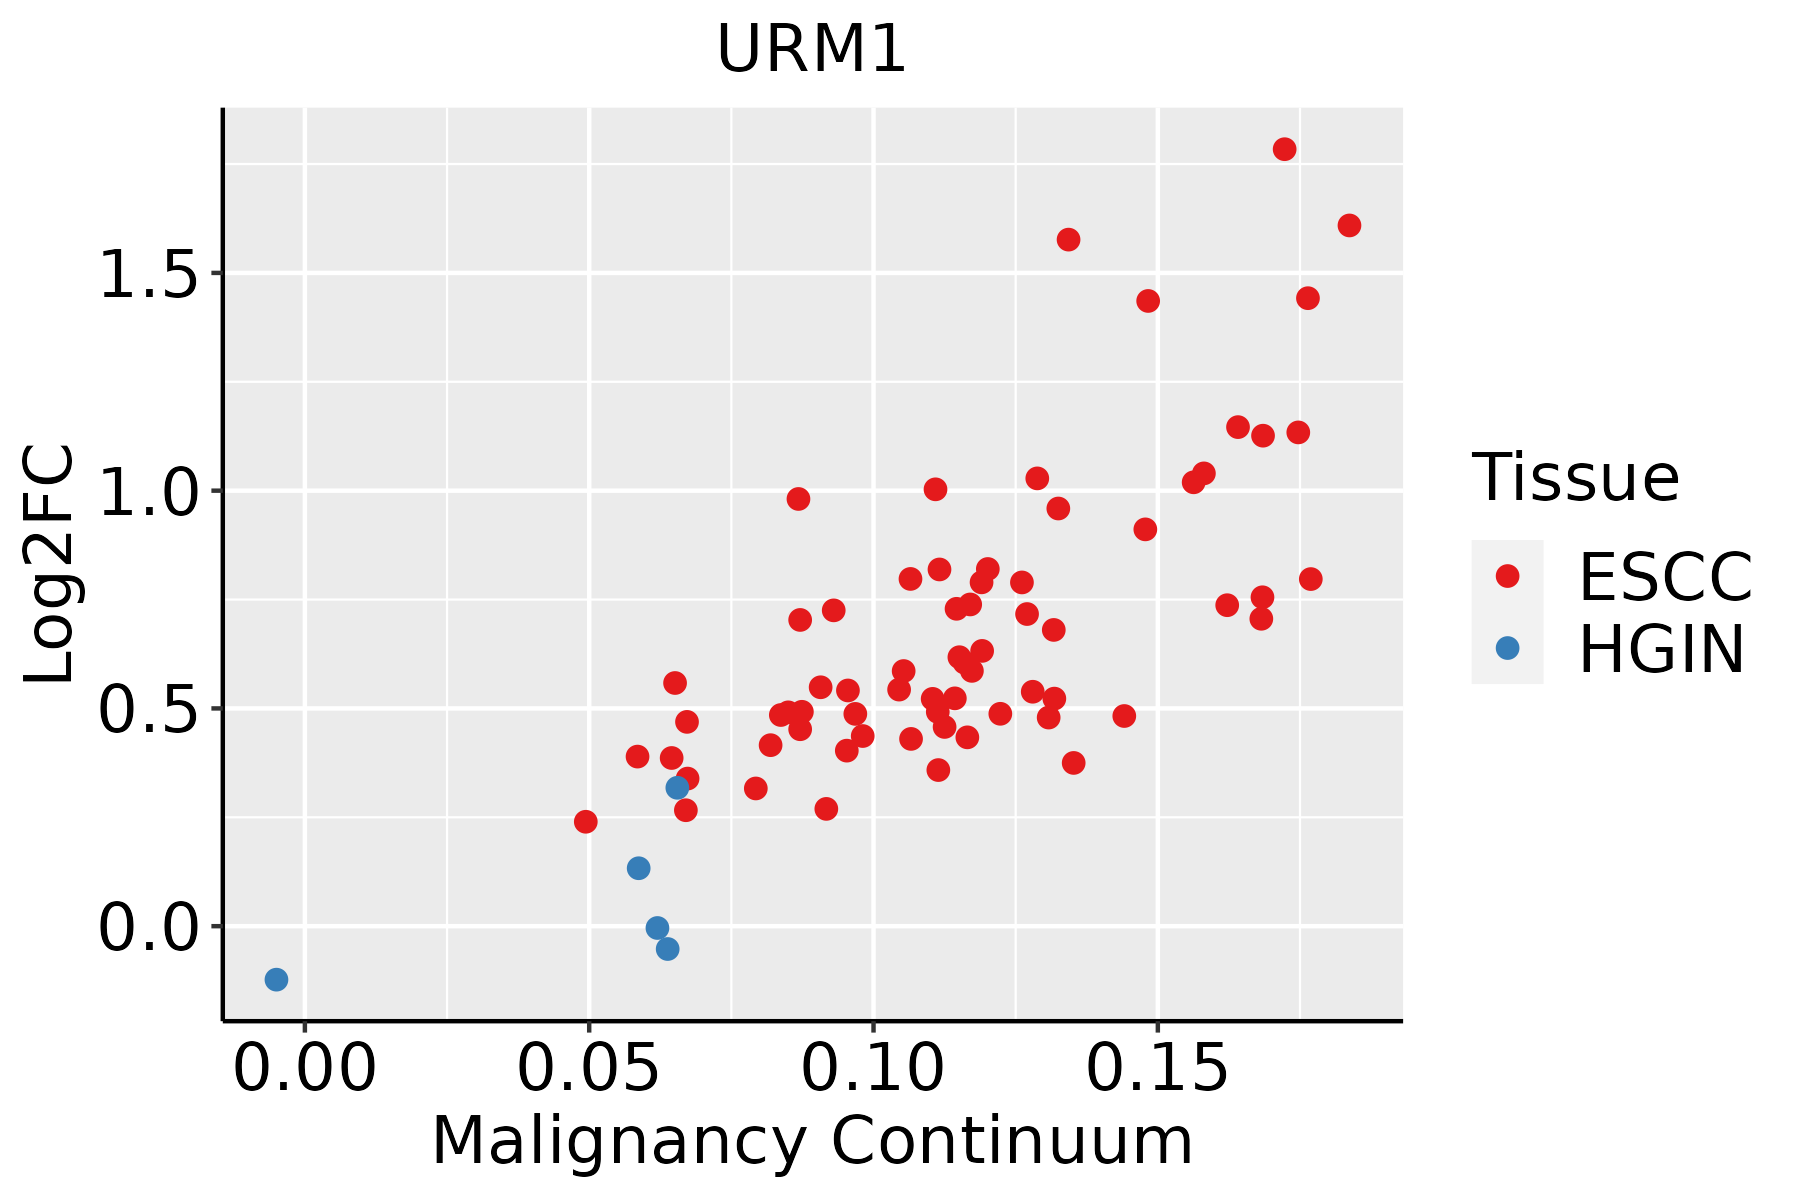 | ESCC: Esophageal squamous cell carcinoma |
| HGIN: High-grade intraepithelial neoplasias | ||
| LGIN: Low-grade intraepithelial neoplasias | ||
| Liver |  | HCC: Hepatocellular carcinoma |
| NAFLD: Non-alcoholic fatty liver disease | ||
| Oral Cavity |  | EOLP: Erosive Oral lichen planus |
| LP: leukoplakia | ||
| NEOLP: Non-erosive oral lichen planus | ||
| OSCC: Oral squamous cell carcinoma | ||
| Skin | 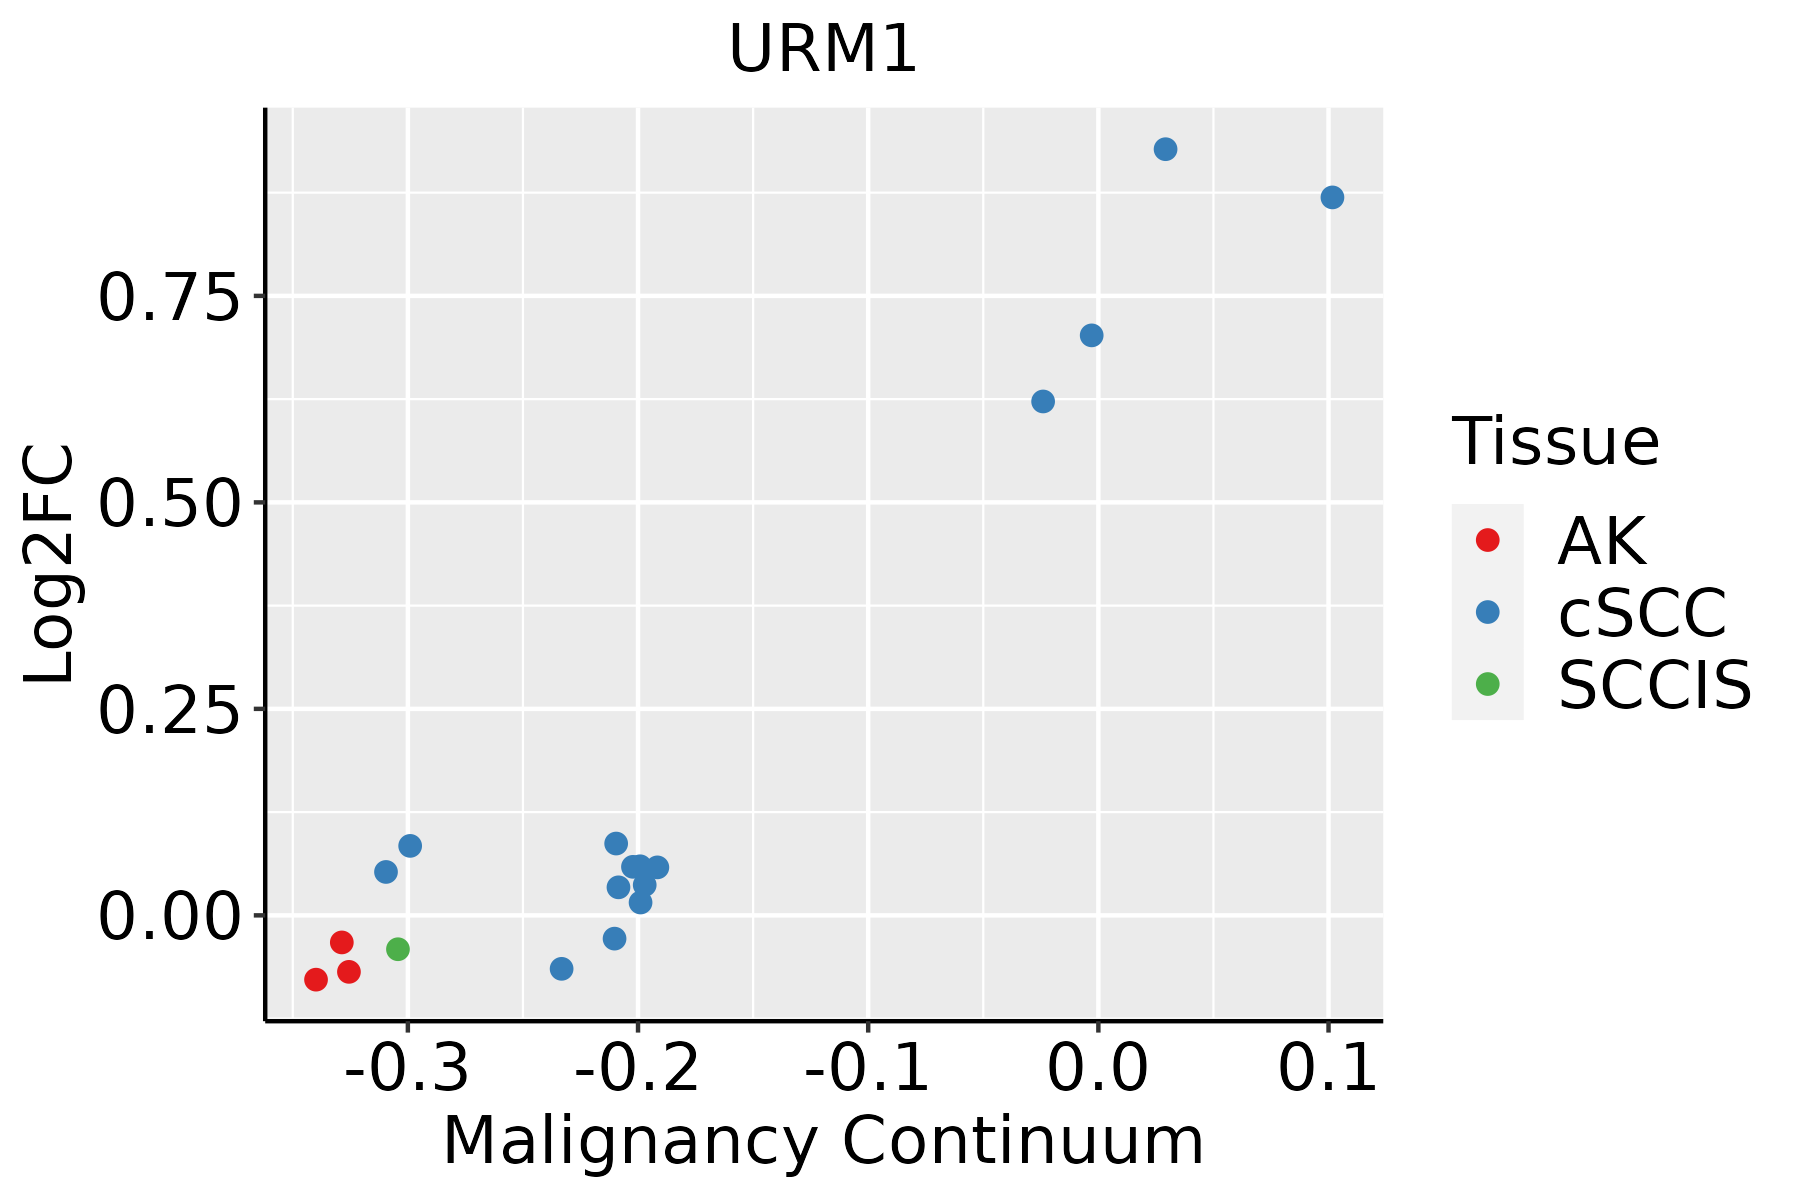 | AK: Actinic keratosis |
| cSCC: Cutaneous squamous cell carcinoma | ||
| SCCIS:squamous cell carcinoma in situ |
| ∗log2FC in expression of this searched gene in stem-like cells from each diseased tissue sample relative to stem-like cells in normal samples in each tissue plotted against the malignancy continuum. Samples are colored based on if they are from different disease stage. |
Top |
Malignant transformation related pathway analysis |
| Find out the enriched GO biological processes and KEGG pathways involved in transition from healthy to precancer to cancer |
| Tissue | Disease Stage | Enriched GO biological Processes |
| Colorectum | AD |  |
| Colorectum | SER |  |
| Colorectum | MSS |  |
| Colorectum | MSI-H |  |
| Colorectum | FAP |  |
| ∗Top 15 enriched GO BP terms are showed in the bar plot of each disease state in each tissue. Each row represents a significant GO biological process which is colored according to the -log10(p.adjust). |
| Page: 1 2 3 4 5 6 7 8 9 |
| GO ID | Tissue | Disease Stage | Description | Gene Ratio | Bg Ratio | pvalue | p.adjust | Count |
| GO:003447010 | Esophagus | HGIN | ncRNA processing | 97/2587 | 395/18723 | 5.92e-09 | 3.90e-07 | 97 |
| GO:00346606 | Esophagus | HGIN | ncRNA metabolic process | 104/2587 | 485/18723 | 2.26e-06 | 8.23e-05 | 104 |
| GO:003447015 | Esophagus | ESCC | ncRNA processing | 300/8552 | 395/18723 | 3.09e-35 | 3.26e-32 | 300 |
| GO:003466012 | Esophagus | ESCC | ncRNA metabolic process | 346/8552 | 485/18723 | 4.35e-31 | 2.51e-28 | 346 |
| GO:00080333 | Esophagus | ESCC | tRNA processing | 92/8552 | 127/18723 | 7.83e-10 | 1.93e-08 | 92 |
| GO:00063992 | Esophagus | ESCC | tRNA metabolic process | 122/8552 | 179/18723 | 9.03e-10 | 2.19e-08 | 122 |
| GO:00094512 | Esophagus | ESCC | RNA modification | 114/8552 | 167/18723 | 2.76e-09 | 6.04e-08 | 114 |
| GO:00064002 | Esophagus | ESCC | tRNA modification | 62/8552 | 90/18723 | 7.02e-06 | 7.04e-05 | 62 |
| GO:00344701 | Liver | Cirrhotic | ncRNA processing | 158/4634 | 395/18723 | 1.09e-11 | 6.96e-10 | 158 |
| GO:00346603 | Liver | Cirrhotic | ncRNA metabolic process | 173/4634 | 485/18723 | 3.64e-08 | 1.21e-06 | 173 |
| GO:00344702 | Liver | HCC | ncRNA processing | 293/7958 | 395/18723 | 4.26e-38 | 6.76e-35 | 293 |
| GO:00346601 | Liver | HCC | ncRNA metabolic process | 332/7958 | 485/18723 | 1.48e-31 | 7.80e-29 | 332 |
| GO:0008033 | Liver | HCC | tRNA processing | 87/7958 | 127/18723 | 2.66e-09 | 7.23e-08 | 87 |
| GO:0006399 | Liver | HCC | tRNA metabolic process | 108/7958 | 179/18723 | 1.07e-06 | 1.59e-05 | 108 |
| GO:0009451 | Liver | HCC | RNA modification | 101/7958 | 167/18723 | 2.02e-06 | 2.78e-05 | 101 |
| GO:0006400 | Liver | HCC | tRNA modification | 60/7958 | 90/18723 | 3.09e-06 | 4.09e-05 | 60 |
| GO:00344709 | Oral cavity | OSCC | ncRNA processing | 263/7305 | 395/18723 | 4.38e-29 | 2.78e-26 | 263 |
| GO:00346605 | Oral cavity | OSCC | ncRNA metabolic process | 296/7305 | 485/18723 | 2.94e-23 | 6.65e-21 | 296 |
| GO:00080332 | Oral cavity | OSCC | tRNA processing | 78/7305 | 127/18723 | 2.56e-07 | 4.00e-06 | 78 |
| GO:00063991 | Oral cavity | OSCC | tRNA metabolic process | 101/7305 | 179/18723 | 1.65e-06 | 2.15e-05 | 101 |
| Page: 1 2 |
| Pathway ID | Tissue | Disease Stage | Description | Gene Ratio | Bg Ratio | pvalue | p.adjust | qvalue | Count |
| Page: 1 |
Top |
Cell-cell communication analysis |
| Identification of potential cell-cell interactions between two cell types and their ligand-receptor pairs for different disease states |
| Ligand | Receptor | LRpair | Pathway | Tissue | Disease Stage |
| Page: 1 |
Top |
Single-cell gene regulatory network inference analysis |
| Find out the significant the regulons (TFs) and the target genes of each regulon across cell types for different disease states |
| TF | Cell Type | Tissue | Disease Stage | Target Gene | RSS | Regulon Activity |
| ∗The dot plots of a searched regulon are shown for all cell subpopulations in each disease state of each tissue based on the regulon specific score inferred using pySCENIC and by calculating the average expression. |
| Page: 1 |
Top |
Somatic mutation of malignant transformation related genes |
| Annotation of somatic variants for genes involved in malignant transformation |
| Hugo Symbol | Variant Class | Variant Classification | dbSNP RS | HGVSc | HGVSp | HGVSp Short | SWISSPROT | BIOTYPE | SIFT | PolyPhen | Tumor Sample Barcode | Tissue | Histology | Sex | Age | Stage | Therapy Types | Drugs | Outcome |
| URM1 | SNV | Missense_Mutation | c.368N>C | p.Arg123Thr | p.R123T | Q9BTM9 | protein_coding | deleterious_low_confidence(0) | benign(0.124) | TCGA-D8-A1XU-01 | Breast | breast invasive carcinoma | Female | <65 | I/II | Unknown | Unknown | SD | |
| URM1 | SNV | Missense_Mutation | c.369N>T | p.Arg123Ser | p.R123S | Q9BTM9 | protein_coding | deleterious_low_confidence(0) | benign(0.007) | TCGA-D8-A1XU-01 | Breast | breast invasive carcinoma | Female | <65 | I/II | Unknown | Unknown | SD | |
| URM1 | insertion | In_Frame_Ins | novel | c.121_122insGACAGTTGAGGACCATAGGCT | p.Asn40_Leu41insArgGlnLeuArgThrIleGly | p.N40_L41insRQLRTIG | Q9BTM9 | protein_coding | TCGA-BH-A0AY-01 | Breast | breast invasive carcinoma | Female | <65 | I/II | Chemotherapy | SD | |||
| URM1 | SNV | Missense_Mutation | c.154N>C | p.Glu52Gln | p.E52Q | Q9BTM9 | protein_coding | deleterious(0.02) | probably_damaging(0.987) | TCGA-DS-A0VN-01 | Cervix | cervical & endocervical cancer | Female | <65 | I/II | Chemotherapy | cisplatin | SD | |
| URM1 | SNV | Missense_Mutation | novel | c.265N>A | p.Pro89Thr | p.P89T | Q9BTM9 | protein_coding | tolerated_low_confidence(0.84) | benign(0.168) | TCGA-AA-3947-01 | Colorectum | colon adenocarcinoma | Female | <65 | I/II | Unknown | Unknown | SD |
| URM1 | SNV | Missense_Mutation | novel | c.141N>T | p.Lys47Asn | p.K47N | Q9BTM9 | protein_coding | deleterious(0.05) | benign(0.088) | TCGA-A5-A2K5-01 | Endometrium | uterine corpus endometrioid carcinoma | Female | >=65 | I/II | Unknown | Unknown | SD |
| URM1 | SNV | Missense_Mutation | rs200405492 | c.44C>T | p.Ala15Val | p.A15V | Q9BTM9 | protein_coding | tolerated(0.27) | benign(0.129) | TCGA-AP-A056-01 | Endometrium | uterine corpus endometrioid carcinoma | Female | <65 | I/II | Unknown | Unknown | SD |
| URM1 | SNV | Missense_Mutation | c.71N>C | p.Lys24Thr | p.K24T | Q9BTM9 | protein_coding | deleterious(0.05) | benign(0.088) | TCGA-B5-A11E-01 | Endometrium | uterine corpus endometrioid carcinoma | Female | <65 | I/II | Unknown | Unknown | SD | |
| URM1 | SNV | Missense_Mutation | novel | c.308N>T | p.Ser103Phe | p.S103F | Q9BTM9 | protein_coding | tolerated_low_confidence(0.66) | benign(0.001) | TCGA-EY-A1GI-01 | Endometrium | uterine corpus endometrioid carcinoma | Female | <65 | I/II | Unknown | Unknown | SD |
| URM1 | SNV | Missense_Mutation | c.43N>A | p.Ala15Thr | p.A15T | Q9BTM9 | protein_coding | tolerated(0.1) | benign(0.372) | TCGA-DD-A113-01 | Liver | liver hepatocellular carcinoma | Female | <65 | I/II | Unknown | Unknown | PD |
| Page: 1 2 |
Top |
Related drugs of malignant transformation related genes |
| Identification of chemicals and drugs interact with genes involved in malignant transfromation |
| (DGIdb 4.0) |
| Entrez ID | Symbol | Category | Interaction Types | Drug Claim Name | Drug Name | PMIDs |
| Page: 1 |

Copyright 2023-Present -The University of Texas Health Science Center at Houston |