Schematic overview of the cellular and molecular mechanisms involved in the cancer progression, including the proposed cellular and molecular mechanisms in cancer cells trajectory. AT1: alveolar type 1 cells; AT2: alveolar type 2 cells; AAH: atypical adenomatous hyperplasia; AIS: adenocarcinoma in situ; MIA: minimally invasive adenocarcinoma; IA: invasive adenocarcinoma; EMT: epithelial-mesenchymal transition

Home

Download

Statistics

Help

Contact

Center for Computational Systems Medicine
leaf

Gene summary

leaf

Malignant transformation analysis

leaf

Malignant transformation related pathway analysis

leaf

Cell-cell communication analysis

leaf

Single-cell gene regulatory network inference analysis

leaf

Somatic mutation of malignant transformation related genes

leaf

Related drugs of malignant transformation related genes

Gene: URI1

Gene summary for URI1

check button Gene summary.

Gene informationSpeciesHuman
Gene symbol

URI1

Gene ID

8725

Gene nameURI1 prefoldin like chaperone
Gene AliasC19orf2
Cytomap19q12
Gene Typeprotein-coding
GO ID

GO:0000122

UniProtAcc

O94763


Top

Malignant transformation analysis

check button Identification of the aberrant gene expression in precancerous and cancerous lesions by comparing the gene expression of stem-like cells in diseased tissues with normal stem cells
check button Malignant transformation involving gene list.
Entrez IDSymbolReplicatesSpeciesOrganTissueAdj P-valueLog2FCMalignancy
8725URI1CA_HPV_1HumanCervixCC3.74e-06-1.47e-010.0264
8725URI1CCI_2HumanCervixCC6.99e-056.13e-010.5249
8725URI1L1HumanCervixCC2.92e-02-1.44e-010.0802
8725URI1HTA11_3410_2000001011HumanColorectumAD9.56e-24-7.07e-010.0155
8725URI1HTA11_2487_2000001011HumanColorectumSER1.19e-02-4.60e-01-0.1808
8725URI1HTA11_2951_2000001011HumanColorectumAD1.44e-02-7.07e-010.0216
8725URI1HTA11_2112_2000001011HumanColorectumSER3.28e-03-7.51e-01-0.2196
8725URI1HTA11_3361_2000001011HumanColorectumAD1.06e-05-5.31e-01-0.1207
8725URI1HTA11_696_2000001011HumanColorectumAD9.28e-10-4.59e-01-0.1464
8725URI1HTA11_866_2000001011HumanColorectumAD2.38e-13-5.25e-01-0.1001
8725URI1HTA11_1391_2000001011HumanColorectumAD4.97e-02-3.81e-01-0.059
8725URI1HTA11_2992_2000001011HumanColorectumSER2.12e-03-6.43e-01-0.1706
8725URI1HTA11_5212_2000001011HumanColorectumAD1.54e-07-8.30e-01-0.2061
8725URI1HTA11_546_2000001011HumanColorectumAD4.75e-03-5.42e-01-0.0842
8725URI1HTA11_9341_2000001011HumanColorectumSER7.68e-03-8.39e-01-0.00410000000000005
8725URI1HTA11_866_3004761011HumanColorectumAD6.31e-09-5.10e-010.096
8725URI1HTA11_8622_2000001021HumanColorectumSER1.13e-04-6.42e-010.0528
8725URI1HTA11_10711_2000001011HumanColorectumAD1.77e-07-5.67e-010.0338
8725URI1HTA11_7696_3000711011HumanColorectumAD3.48e-03-3.34e-010.0674
8725URI1HTA11_6818_2000001011HumanColorectumAD5.71e-03-5.86e-010.0112
Page: 1 2 3 4 5 6 7 8 9 10 

check button Transcriptomic changes along malignancy continuum.
TissueExpression DynamicsAbbreviation
CervixThe image shows the transcriptomic changes along malignancy continuum.log2FC in expression of this searched gene in stem-like cells from each diseased tissue sample relative to stem-like cells in normal samples in each tissue plotted against the malignancy continuum. Samples are colored based on if they are from different disease stage.CC: Cervix cancer
HSIL_HPV: HPV-infected high-grade squamous intraepithelial lesions
N_HPV: HPV-infected normal cervix
Colorectum (GSE201348)The image shows the transcriptomic changes along malignancy continuum.log2FC in expression of this searched gene in stem-like cells from each diseased tissue sample relative to stem-like cells in normal samples in each tissue plotted against the malignancy continuum. Samples are colored based on if they are from different disease stage.FAP: Familial adenomatous polyposis
CRC: Colorectal cancer
Colorectum (HTA11)The image shows the transcriptomic changes along malignancy continuum.log2FC in expression of this searched gene in stem-like cells from each diseased tissue sample relative to stem-like cells in normal samples in each tissue plotted against the malignancy continuum. Samples are colored based on if they are from different disease stage.AD: Adenomas
SER: Sessile serrated lesions
MSI-H: Microsatellite-high colorectal cancer
MSS: Microsatellite stable colorectal cancer
EsophagusThe image shows the transcriptomic changes along malignancy continuum.log2FC in expression of this searched gene in stem-like cells from each diseased tissue sample relative to stem-like cells in normal samples in each tissue plotted against the malignancy continuum. Samples are colored based on if they are from different disease stage.ESCC: Esophageal squamous cell carcinoma
HGIN: High-grade intraepithelial neoplasias
LGIN: Low-grade intraepithelial neoplasias
LiverThe image shows the transcriptomic changes along malignancy continuum.log2FC in expression of this searched gene in stem-like cells from each diseased tissue sample relative to stem-like cells in normal samples in each tissue plotted against the malignancy continuum. Samples are colored based on if they are from different disease stage.HCC: Hepatocellular carcinoma
NAFLD: Non-alcoholic fatty liver disease
LungThe image shows the transcriptomic changes along malignancy continuum.log2FC in expression of this searched gene in stem-like cells from each diseased tissue sample relative to stem-like cells in normal samples in each tissue plotted against the malignancy continuum. Samples are colored based on if they are from different disease stage.
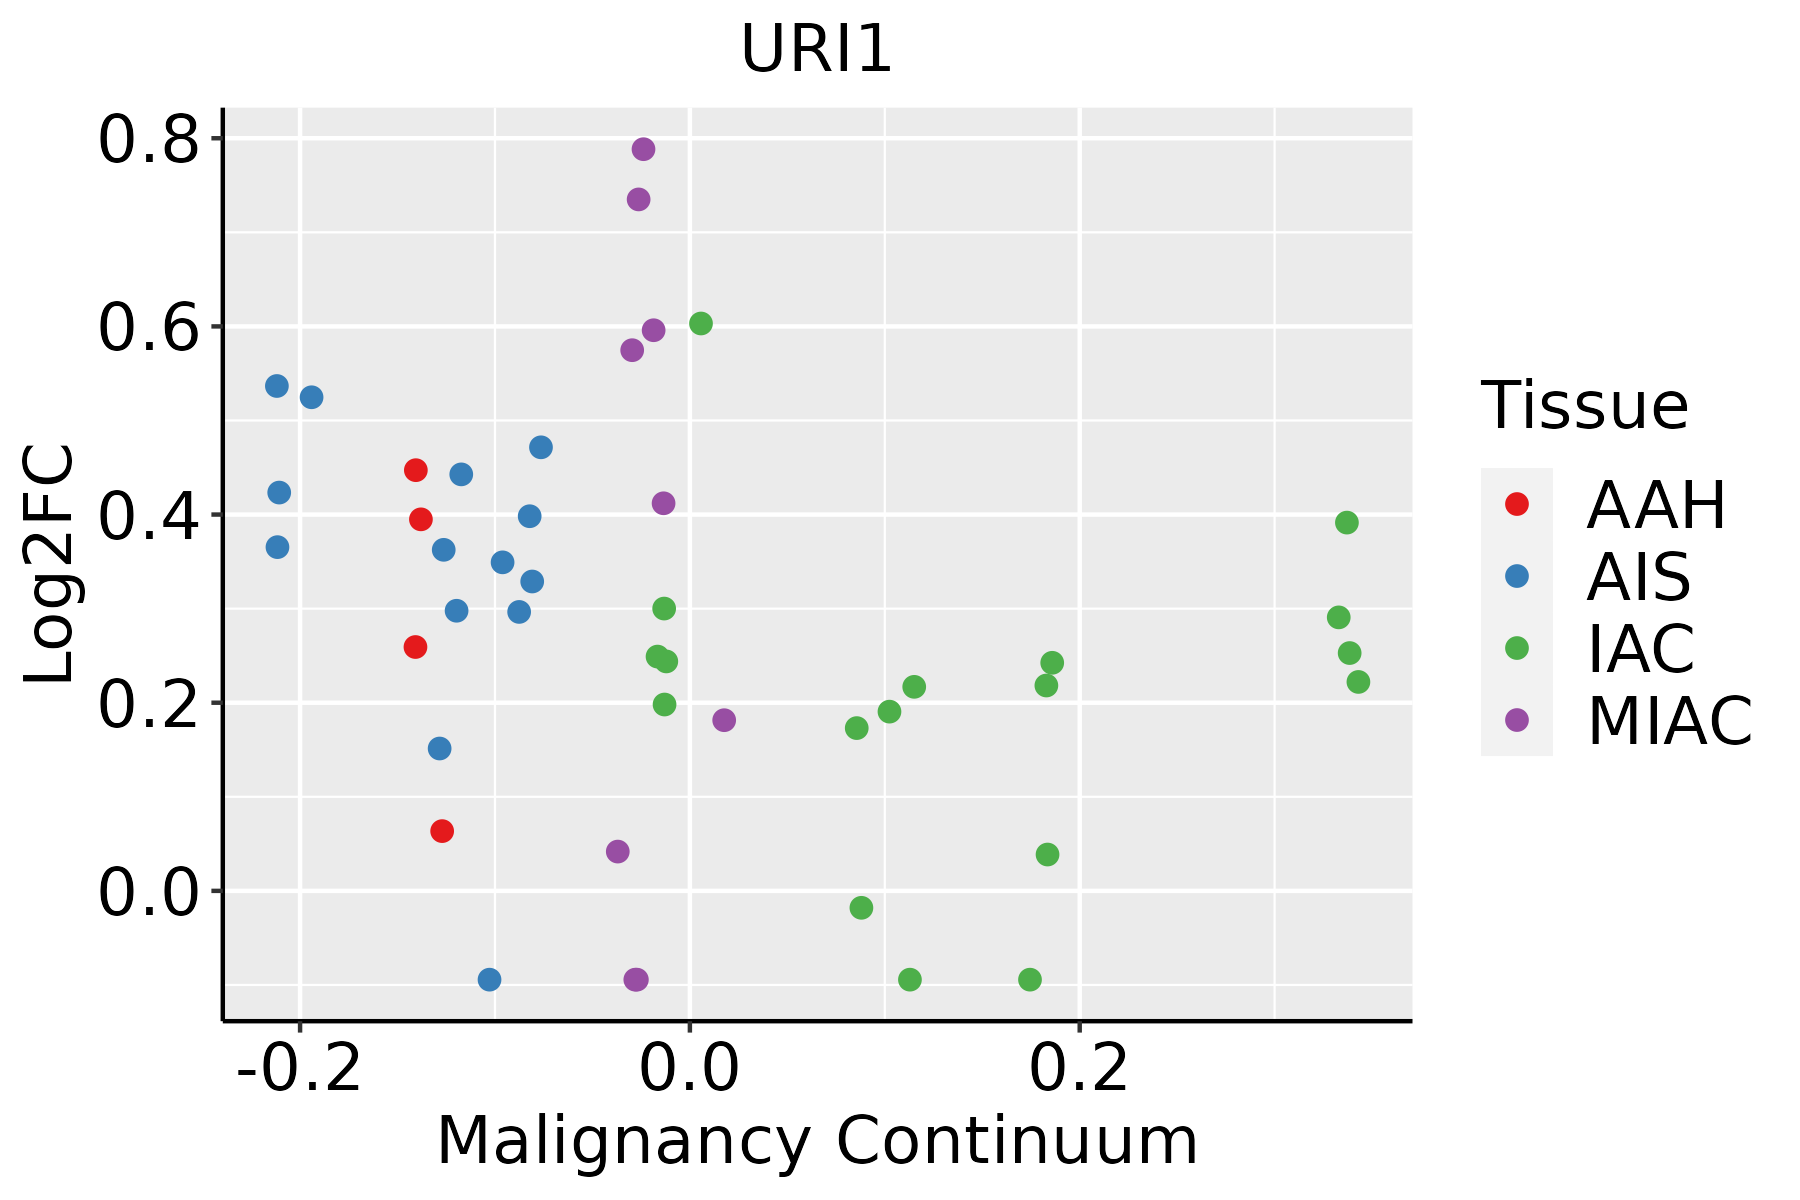
AAH: Atypical adenomatous hyperplasia
AIS: Adenocarcinoma in situ
IAC: Invasive lung adenocarcinoma
MIA: Minimally invasive adenocarcinoma
Oral CavityThe image shows the transcriptomic changes along malignancy continuum.log2FC in expression of this searched gene in stem-like cells from each diseased tissue sample relative to stem-like cells in normal samples in each tissue plotted against the malignancy continuum. Samples are colored based on if they are from different disease stage.EOLP: Erosive Oral lichen planus
LP: leukoplakia
NEOLP: Non-erosive oral lichen planus
OSCC: Oral squamous cell carcinoma
ProstateThe image shows the transcriptomic changes along malignancy continuum.log2FC in expression of this searched gene in stem-like cells from each diseased tissue sample relative to stem-like cells in normal samples in each tissue plotted against the malignancy continuum. Samples are colored based on if they are from different disease stage.
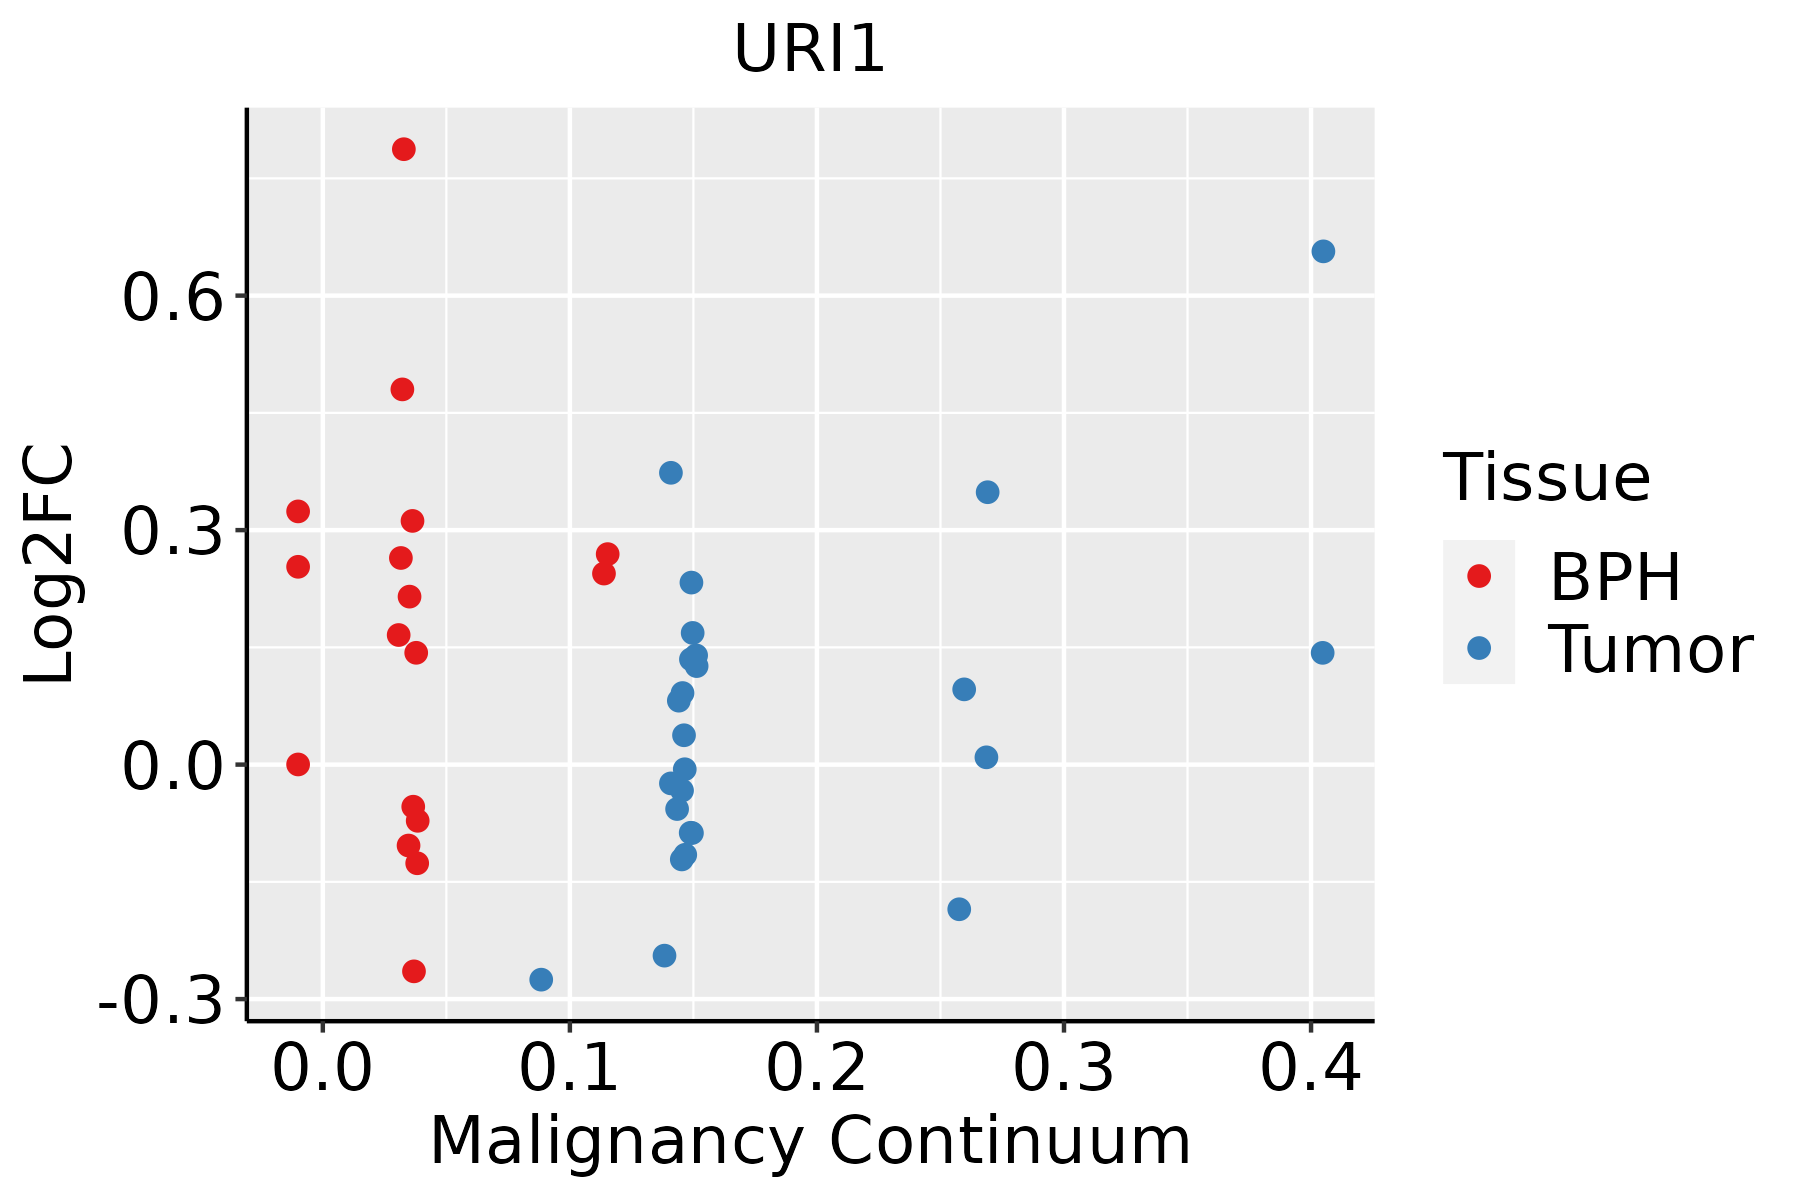
BPH: Benign Prostatic Hyperplasia
SkinThe image shows the transcriptomic changes along malignancy continuum.log2FC in expression of this searched gene in stem-like cells from each diseased tissue sample relative to stem-like cells in normal samples in each tissue plotted against the malignancy continuum. Samples are colored based on if they are from different disease stage.AK: Actinic keratosis
cSCC: Cutaneous squamous cell carcinoma
SCCIS:squamous cell carcinoma in situ
ThyroidThe image shows the transcriptomic changes along malignancy continuum.log2FC in expression of this searched gene in stem-like cells from each diseased tissue sample relative to stem-like cells in normal samples in each tissue plotted against the malignancy continuum. Samples are colored based on if they are from different disease stage.
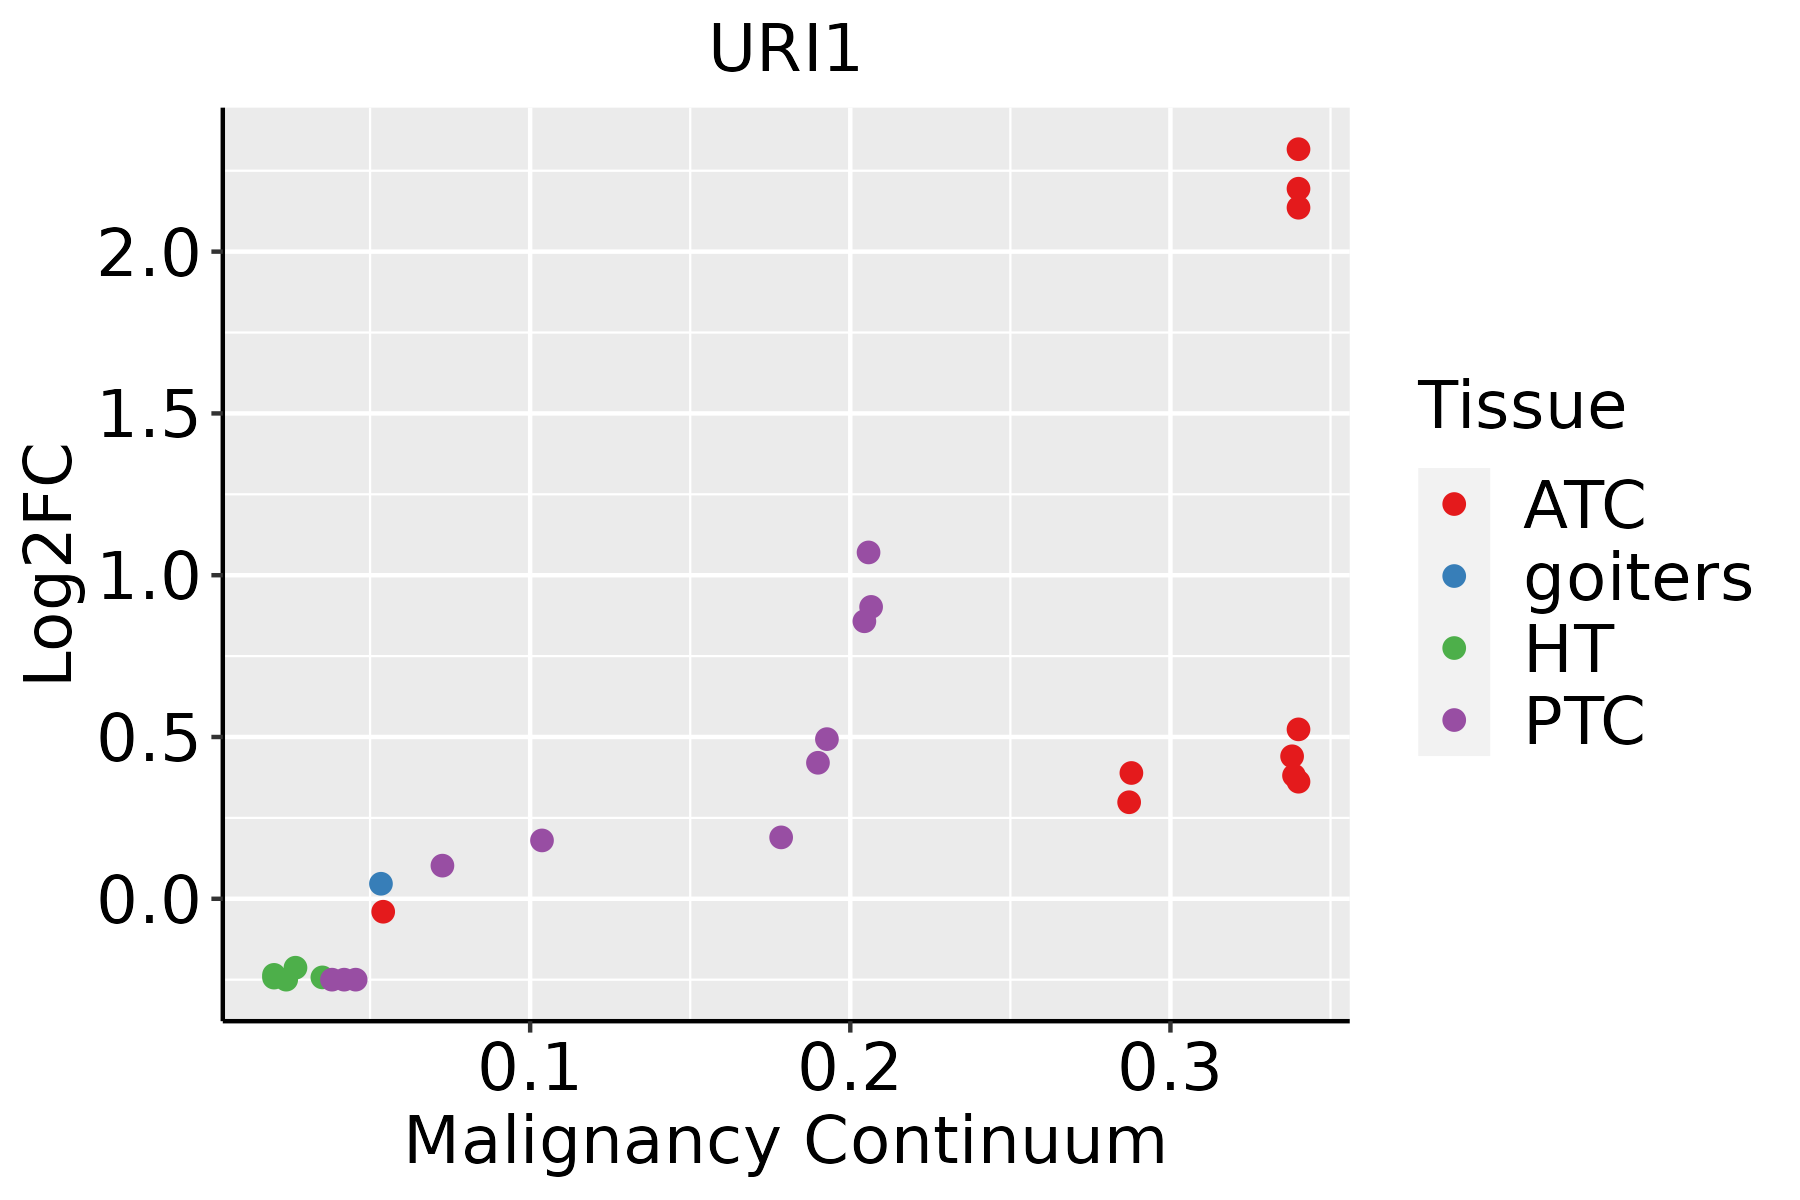
ATC: Anaplastic thyroid cancer
HT: Hashimoto's thyroiditis
PTC: Papillary thyroid cancer
∗log2FC in expression of this searched gene in stem-like cells from each diseased tissue sample relative to stem-like cells in normal samples in each tissue plotted against the malignancy continuum. Samples are colored based on if they are from different disease stage.

Top

Malignant transformation related pathway analysis

check buttonFind out the enriched GO biological processes and KEGG pathways involved in transition from healthy to precancer to cancer
check button Figure of enriched GO biological processes.
TissueDisease StageEnriched GO biological Processes
ColorectumADGO analysis - Figure of enriched GO biological processes: Top 15 enriched GO BP terms are showed in the bar plot of each disease state in each tissue. Each row represents a significant GO biological process which is colored according to the -log10(p.adjust).
ColorectumSERGO analysis - Figure of enriched GO biological processes: Top 15 enriched GO BP terms are showed in the bar plot of each disease state in each tissue. Each row represents a significant GO biological process which is colored according to the -log10(p.adjust).
ColorectumMSSGO analysis - Figure of enriched GO biological processes: Top 15 enriched GO BP terms are showed in the bar plot of each disease state in each tissue. Each row represents a significant GO biological process which is colored according to the -log10(p.adjust).
ColorectumMSI-HGO analysis - Figure of enriched GO biological processes: Top 15 enriched GO BP terms are showed in the bar plot of each disease state in each tissue. Each row represents a significant GO biological process which is colored according to the -log10(p.adjust).
ColorectumFAPGO analysis - Figure of enriched GO biological processes: Top 15 enriched GO BP terms are showed in the bar plot of each disease state in each tissue. Each row represents a significant GO biological process which is colored according to the -log10(p.adjust).
∗Top 15 enriched GO BP terms are showed in the bar plot of each disease state in each tissue. Each row represents a significant GO biological process which is colored according to the -log10(p.adjust).
Page: 1 2 3 4 5 6 7 8 9 

check button Enriched GO biological processes.
GO IDTissueDisease StageDescriptionGene RatioBg Ratiopvaluep.adjustCount
GO:009719310CervixCCintrinsic apoptotic signaling pathway85/2311288/187234.56e-156.46e-1285
GO:200123310CervixCCregulation of apoptotic signaling pathway96/2311356/187234.08e-143.05e-1196
GO:200124210CervixCCregulation of intrinsic apoptotic signaling pathway52/2311164/187235.06e-111.01e-0852
GO:200123410CervixCCnegative regulation of apoptotic signaling pathway56/2311224/187231.39e-076.70e-0656
GO:00513469CervixCCnegative regulation of hydrolase activity81/2311379/187234.27e-071.67e-0581
GO:004854510CervixCCresponse to steroid hormone74/2311339/187235.71e-072.09e-0574
GO:004593610CervixCCnegative regulation of phosphate metabolic process88/2311441/187232.92e-068.27e-0588
GO:001056310CervixCCnegative regulation of phosphorus metabolic process88/2311442/187233.21e-068.77e-0588
GO:00160498CervixCCcell growth92/2311482/187231.16e-052.49e-0492
GO:200124310CervixCCnegative regulation of intrinsic apoptotic signaling pathway28/231198/187231.31e-052.66e-0428
GO:00096158CervixCCresponse to virus73/2311367/187232.22e-053.95e-0473
GO:00015588CervixCCregulation of cell growth77/2311414/187231.40e-041.70e-0377
GO:003530310CervixCCregulation of dephosphorylation31/2311128/187231.52e-041.83e-0331
GO:00109218CervixCCregulation of phosphatase activity22/231184/187234.18e-044.23e-0322
GO:00163117CervixCCdephosphorylation73/2311417/187231.23e-039.87e-0373
GO:00713839CervixCCcellular response to steroid hormone stimulus40/2311204/187231.93e-031.42e-0240
GO:0097193ColorectumADintrinsic apoptotic signaling pathway108/3918288/187236.25e-116.41e-09108
GO:2001242ColorectumADregulation of intrinsic apoptotic signaling pathway67/3918164/187234.94e-093.16e-0767
GO:2001233ColorectumADregulation of apoptotic signaling pathway119/3918356/187232.14e-081.21e-06119
GO:0071383ColorectumADcellular response to steroid hormone stimulus73/3918204/187236.31e-072.24e-0573
Page: 1 2 3 4 5 6 7 8 9 10 11 12 13 14 15 16 17 18 

check button Enriched KEGG pathways.
Pathway IDTissueDisease StageDescriptionGene RatioBg Ratiopvaluep.adjustqvalueCount
Page: 1 

Top

Cell-cell communication analysis

check buttonIdentification of potential cell-cell interactions between two cell types and their ligand-receptor pairs for different disease states
LigandReceptorLRpairPathwayTissueDisease Stage
Page: 1 

Top

Single-cell gene regulatory network inference analysis

check buttonFind out the significant the regulons (TFs) and the target genes of each regulon across cell types for different disease states
TFCell TypeTissueDisease StageTarget GeneRSSRegulon Activity
∗The dot plots of a searched regulon are shown for all cell subpopulations in each disease state of each tissue based on the regulon specific score inferred using pySCENIC and by calculating the average expression.
Page: 1 

Top

Somatic mutation of malignant transformation related genes

check buttonAnnotation of somatic variants for genes involved in malignant transformation
Hugo SymbolVariant ClassVariant ClassificationdbSNP RSHGVScHGVSpHGVSp ShortSWISSPROTBIOTYPESIFTPolyPhenTumor Sample BarcodeTissueHistologySexAgeStageTherapy TypesDrugsOutcome
URI1SNVMissense_Mutationnovelc.508N>Ap.Glu170Lysp.E170KO94763protein_codingtolerated(0.13)benign(0.099)TCGA-AN-A046-01Breastbreast invasive carcinomaFemale>=65I/IIUnknownUnknownSD
URI1SNVMissense_Mutationc.1546N>Ap.Ser516Thrp.S516TO94763protein_codingtolerated(0.15)benign(0.156)TCGA-AN-A0XU-01Breastbreast invasive carcinomaFemale<65I/IIUnknownUnknownSD
URI1SNVMissense_Mutationc.828A>Tp.Glu276Aspp.E276DO94763protein_codingtolerated_low_confidence(0.24)benign(0)TCGA-AO-A03R-01Breastbreast invasive carcinomaFemale<65I/IIChemotherapydoxorubicinSD
URI1deletionFrame_Shift_Delnovelc.1607delNp.Ter536TrpfsTer14p.*536Wfs*14O94763protein_codingTCGA-EW-A2FV-01Breastbreast invasive carcinomaFemale<65III/IVChemotherapydocetaxelSD
URI1SNVMissense_Mutationnovelc.1516C>Ap.Pro506Thrp.P506TO94763protein_codingdeleterious_low_confidence(0.03)possibly_damaging(0.674)TCGA-EA-A3HU-01Cervixcervical & endocervical cancerFemale<65I/IIUnknownUnknownSD
URI1SNVMissense_Mutationrs769475335c.638G>Ap.Arg213Glnp.R213QO94763protein_codingdeleterious(0)probably_damaging(0.992)TCGA-EA-A410-01Cervixcervical & endocervical cancerFemale<65I/IIUnknownUnknownSD
URI1SNVMissense_Mutationnovelc.878C>Ap.Ser293Tyrp.S293YO94763protein_codingdeleterious(0)possibly_damaging(0.483)TCGA-VS-A9UR-01Cervixcervical & endocervical cancerFemale<65I/IIChemotherapycisplatinPD
URI1SNVMissense_Mutationrs138648155c.770N>Tp.Ala257Valp.A257VO94763protein_codingtolerated(0.64)benign(0)TCGA-AA-3821-01Colorectumcolon adenocarcinomaFemale>=65I/IIUnknownUnknownSD
URI1SNVMissense_Mutationc.747N>Tp.Glu249Aspp.E249DO94763protein_codingtolerated(0.11)probably_damaging(0.978)TCGA-AD-6899-01Colorectumcolon adenocarcinomaMale>=65III/IVUnknownUnknownSD
URI1SNVMissense_Mutationnovelc.287N>Cp.Val96Alap.V96AO94763protein_codingdeleterious(0)probably_damaging(0.913)TCGA-AZ-4315-01Colorectumcolon adenocarcinomaMale<65I/IIUnknownUnknownSD
Page: 1 2 3 4 5 6 7 8 

Top

Related drugs of malignant transformation related genes

check buttonIdentification of chemicals and drugs interact with genes involved in malignant transfromation
(DGIdb 4.0)
Entrez IDSymbolCategoryInteraction TypesDrug Claim NameDrug NamePMIDs
Page: 1