| Tissue | Expression Dynamics | Abbreviation |
| Endometrium |  | AEH: Atypical endometrial hyperplasia |
| EEC: Endometrioid Cancer |
| Esophagus |  | ESCC: Esophageal squamous cell carcinoma |
| HGIN: High-grade intraepithelial neoplasias |
| LGIN: Low-grade intraepithelial neoplasias |
| Liver | 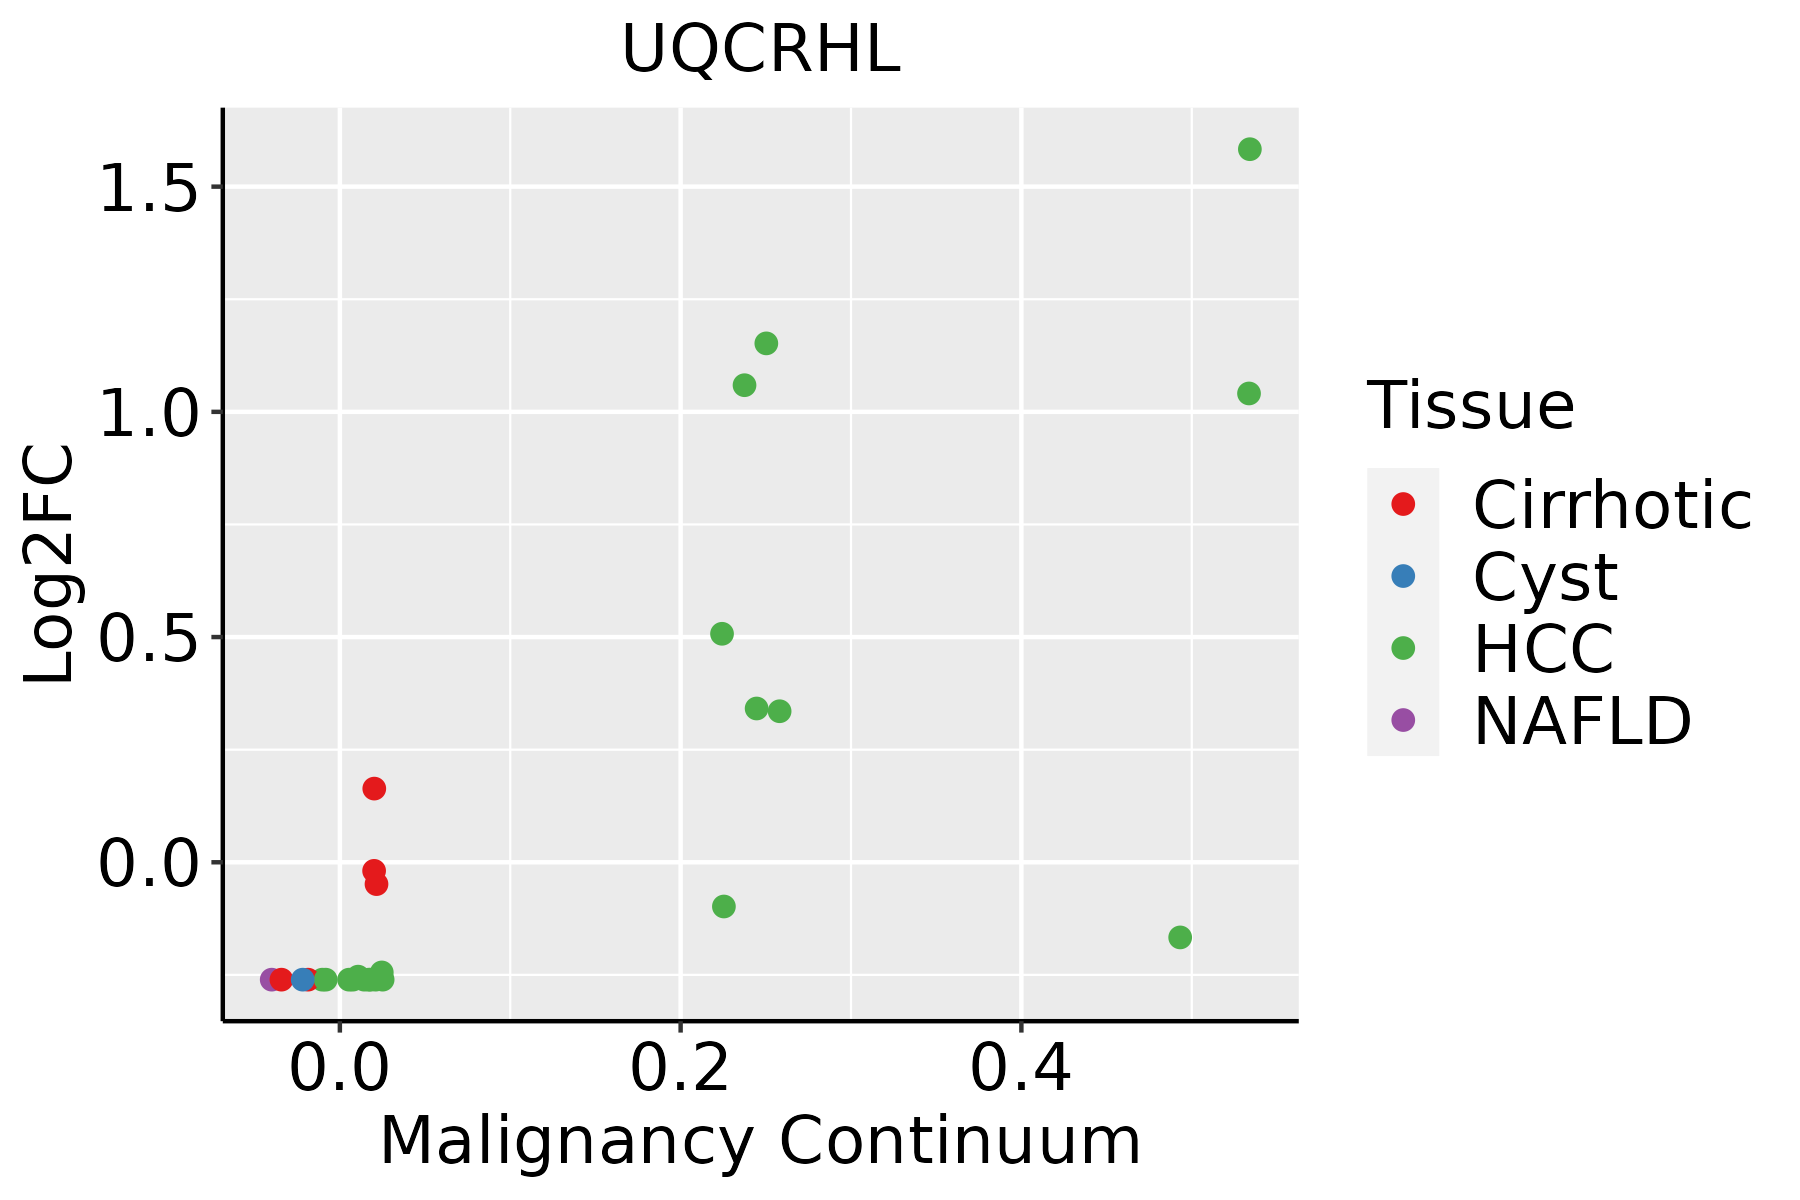 | HCC: Hepatocellular carcinoma |
| NAFLD: Non-alcoholic fatty liver disease |
| Oral Cavity |  | EOLP: Erosive Oral lichen planus |
| LP: leukoplakia |
| NEOLP: Non-erosive oral lichen planus |
| OSCC: Oral squamous cell carcinoma |
| GO ID | Tissue | Disease Stage | Description | Gene Ratio | Bg Ratio | pvalue | p.adjust | Count |
| GO:004603417 | Endometrium | EEC | ATP metabolic process | 107/2168 | 277/18723 | 1.32e-31 | 3.95e-28 | 107 |
| GO:000611916 | Endometrium | EEC | oxidative phosphorylation | 71/2168 | 141/18723 | 5.89e-30 | 1.18e-26 | 71 |
| GO:000906015 | Endometrium | EEC | aerobic respiration | 79/2168 | 189/18723 | 2.63e-26 | 3.95e-23 | 79 |
| GO:004533315 | Endometrium | EEC | cellular respiration | 83/2168 | 230/18723 | 1.72e-22 | 2.06e-19 | 83 |
| GO:004277315 | Endometrium | EEC | ATP synthesis coupled electron transport | 49/2168 | 95/18723 | 1.11e-21 | 9.50e-19 | 49 |
| GO:004277515 | Endometrium | EEC | mitochondrial ATP synthesis coupled electron transport | 49/2168 | 95/18723 | 1.11e-21 | 9.50e-19 | 49 |
| GO:001964615 | Endometrium | EEC | aerobic electron transport chain | 45/2168 | 87/18723 | 4.34e-20 | 3.26e-17 | 45 |
| GO:001598015 | Endometrium | EEC | energy derivation by oxidation of organic compounds | 97/2168 | 318/18723 | 5.37e-20 | 3.58e-17 | 97 |
| GO:002290415 | Endometrium | EEC | respiratory electron transport chain | 52/2168 | 114/18723 | 7.97e-20 | 4.78e-17 | 52 |
| GO:000609115 | Endometrium | EEC | generation of precursor metabolites and energy | 125/2168 | 490/18723 | 3.76e-18 | 1.88e-15 | 125 |
| GO:002290015 | Endometrium | EEC | electron transport chain | 61/2168 | 175/18723 | 4.60e-16 | 1.84e-13 | 61 |
| GO:000612214 | Endometrium | EEC | mitochondrial electron transport, ubiquinol to cytochrome c | 9/2168 | 11/18723 | 1.63e-07 | 7.54e-06 | 9 |
| GO:0006091110 | Esophagus | ESCC | generation of precursor metabolites and energy | 331/8552 | 490/18723 | 3.86e-23 | 8.45e-21 | 331 |
| GO:0045333110 | Esophagus | ESCC | cellular respiration | 173/8552 | 230/18723 | 4.53e-20 | 5.99e-18 | 173 |
| GO:0009060110 | Esophagus | ESCC | aerobic respiration | 145/8552 | 189/18723 | 2.16e-18 | 2.21e-16 | 145 |
| GO:0015980110 | Esophagus | ESCC | energy derivation by oxidation of organic compounds | 220/8552 | 318/18723 | 1.20e-17 | 1.09e-15 | 220 |
| GO:0022900110 | Esophagus | ESCC | electron transport chain | 133/8552 | 175/18723 | 2.18e-16 | 1.67e-14 | 133 |
| GO:0046034111 | Esophagus | ESCC | ATP metabolic process | 189/8552 | 277/18723 | 1.99e-14 | 1.04e-12 | 189 |
| GO:0006119111 | Esophagus | ESCC | oxidative phosphorylation | 106/8552 | 141/18723 | 8.19e-13 | 3.63e-11 | 106 |
| GO:0022904110 | Esophagus | ESCC | respiratory electron transport chain | 89/8552 | 114/18723 | 1.36e-12 | 5.80e-11 | 89 |
| Pathway ID | Tissue | Disease Stage | Description | Gene Ratio | Bg Ratio | pvalue | p.adjust | qvalue | Count |
| hsa05014210 | Esophagus | ESCC | Amyotrophic lateral sclerosis | 266/4205 | 364/8465 | 1.31e-20 | 2.20e-18 | 1.13e-18 | 266 |
| hsa05016210 | Esophagus | ESCC | Huntington disease | 226/4205 | 306/8465 | 1.38e-18 | 8.72e-17 | 4.46e-17 | 226 |
| hsa05012211 | Esophagus | ESCC | Parkinson disease | 201/4205 | 266/8465 | 1.56e-18 | 8.72e-17 | 4.46e-17 | 201 |
| hsa05208211 | Esophagus | ESCC | Chemical carcinogenesis - reactive oxygen species | 168/4205 | 223/8465 | 1.83e-15 | 6.81e-14 | 3.49e-14 | 168 |
| hsa05022210 | Esophagus | ESCC | Pathways of neurodegeneration - multiple diseases | 318/4205 | 476/8465 | 6.10e-15 | 2.04e-13 | 1.05e-13 | 318 |
| hsa05010210 | Esophagus | ESCC | Alzheimer disease | 263/4205 | 384/8465 | 1.80e-14 | 5.47e-13 | 2.80e-13 | 263 |
| hsa04932210 | Esophagus | ESCC | Non-alcoholic fatty liver disease | 122/4205 | 155/8465 | 5.69e-14 | 1.59e-12 | 8.14e-13 | 122 |
| hsa05020210 | Esophagus | ESCC | Prion disease | 193/4205 | 273/8465 | 6.42e-13 | 1.34e-11 | 6.89e-12 | 193 |
| hsa00190210 | Esophagus | ESCC | Oxidative phosphorylation | 104/4205 | 134/8465 | 2.04e-11 | 2.98e-10 | 1.53e-10 | 104 |
| hsa05415211 | Esophagus | ESCC | Diabetic cardiomyopathy | 146/4205 | 203/8465 | 5.81e-11 | 7.78e-10 | 3.99e-10 | 146 |
| hsa04714211 | Esophagus | ESCC | Thermogenesis | 163/4205 | 232/8465 | 9.22e-11 | 1.14e-09 | 5.86e-10 | 163 |
| hsa0501438 | Esophagus | ESCC | Amyotrophic lateral sclerosis | 266/4205 | 364/8465 | 1.31e-20 | 2.20e-18 | 1.13e-18 | 266 |
| hsa0501638 | Esophagus | ESCC | Huntington disease | 226/4205 | 306/8465 | 1.38e-18 | 8.72e-17 | 4.46e-17 | 226 |
| hsa05012310 | Esophagus | ESCC | Parkinson disease | 201/4205 | 266/8465 | 1.56e-18 | 8.72e-17 | 4.46e-17 | 201 |
| hsa05208310 | Esophagus | ESCC | Chemical carcinogenesis - reactive oxygen species | 168/4205 | 223/8465 | 1.83e-15 | 6.81e-14 | 3.49e-14 | 168 |
| hsa0502238 | Esophagus | ESCC | Pathways of neurodegeneration - multiple diseases | 318/4205 | 476/8465 | 6.10e-15 | 2.04e-13 | 1.05e-13 | 318 |
| hsa0501038 | Esophagus | ESCC | Alzheimer disease | 263/4205 | 384/8465 | 1.80e-14 | 5.47e-13 | 2.80e-13 | 263 |
| hsa0493238 | Esophagus | ESCC | Non-alcoholic fatty liver disease | 122/4205 | 155/8465 | 5.69e-14 | 1.59e-12 | 8.14e-13 | 122 |
| hsa0502038 | Esophagus | ESCC | Prion disease | 193/4205 | 273/8465 | 6.42e-13 | 1.34e-11 | 6.89e-12 | 193 |
| hsa0019038 | Esophagus | ESCC | Oxidative phosphorylation | 104/4205 | 134/8465 | 2.04e-11 | 2.98e-10 | 1.53e-10 | 104 |
| Hugo Symbol | Variant Class | Variant Classification | dbSNP RS | HGVSc | HGVSp | HGVSp Short | SWISSPROT | BIOTYPE | SIFT | PolyPhen | Tumor Sample Barcode | Tissue | Histology | Sex | Age | Stage | Therapy Types | Drugs | Outcome |
| UQCRHL | SNV | Missense_Mutation | novel | c.13N>A | p.Asp5Asn | p.D5N | A0A096LP55 | protein_coding | tolerated(0.12) | benign(0.1) | TCGA-EK-A3GK-01 | Cervix | cervical & endocervical cancer | Female | <65 | I/II | Unknown | Unknown | SD |
| UQCRHL | SNV | Missense_Mutation | novel | c.176C>G | p.Ser59Cys | p.S59C | A0A096LP55 | protein_coding | deleterious(0) | probably_damaging(0.998) | TCGA-VS-A950-01 | Cervix | cervical & endocervical cancer | Female | <65 | III/IV | Unknown | Unknown | SD |
| UQCRHL | SNV | Missense_Mutation | rs774153442 | c.244N>A | p.Val82Met | p.V82M | A0A096LP55 | protein_coding | tolerated(0.06) | benign(0.037) | TCGA-A5-A0G9-01 | Endometrium | uterine corpus endometrioid carcinoma | Female | >=65 | I/II | Unknown | Unknown | SD |
| UQCRHL | SNV | Missense_Mutation | novel | c.195G>T | p.Glu65Asp | p.E65D | A0A096LP55 | protein_coding | deleterious(0) | probably_damaging(0.99) | TCGA-B5-A11E-01 | Endometrium | uterine corpus endometrioid carcinoma | Female | <65 | I/II | Unknown | Unknown | SD |
| UQCRHL | SNV | Missense_Mutation | rs780112142 | c.179N>A | p.Arg60Gln | p.R60Q | A0A096LP55 | protein_coding | tolerated(0.06) | benign(0.01) | TCGA-B5-A1MR-01 | Endometrium | uterine corpus endometrioid carcinoma | Female | >=65 | III/IV | Unknown | Unknown | SD |
| UQCRHL | SNV | Missense_Mutation | rs764654397 | c.34G>A | p.Glu12Lys | p.E12K | A0A096LP55 | protein_coding | tolerated(0.88) | benign(0.035) | TCGA-EO-A22X-01 | Endometrium | uterine corpus endometrioid carcinoma | Female | <65 | III/IV | Unspecific | Carboplatin | Complete Response |
| UQCRHL | SNV | Missense_Mutation | novel | c.86N>A | p.Pro29His | p.P29H | A0A096LP55 | protein_coding | deleterious(0) | probably_damaging(0.999) | TCGA-EO-A3KX-01 | Endometrium | uterine corpus endometrioid carcinoma | Female | >=65 | I/II | Unknown | Unknown | SD |
| UQCRHL | insertion | Nonsense_Mutation | novel | c.31_32insAATAAGAAACAAATGGTACAT | p.Thr11delinsLysTerGluThrAsnGlyThrSer | p.T11delinsK*ETNGTS | A0A096LP55 | protein_coding | | | TCGA-BS-A0UJ-01 | Endometrium | uterine corpus endometrioid carcinoma | Female | >=65 | I/II | Unknown | Unknown | SD |


