
|
|||||
|
 | |
| |
| |
| |
| |
| |
|
Gene: UQCC3 |
Gene summary for UQCC3 |
| Gene information | Species | Human | Gene symbol | UQCC3 | Gene ID | 790955 |
| Gene name | ubiquinol-cytochrome c reductase complex assembly factor 3 | |
| Gene Alias | C11orf83 | |
| Cytomap | 11q12.3 | |
| Gene Type | protein-coding | GO ID | GO:0006091 | UniProtAcc | Q6UW78 |
Top |
Malignant transformation analysis |
| Identification of the aberrant gene expression in precancerous and cancerous lesions by comparing the gene expression of stem-like cells in diseased tissues with normal stem cells |
| Entrez ID | Symbol | Replicates | Species | Organ | Tissue | Adj P-value | Log2FC | Malignancy |
| 790955 | UQCC3 | LZE2T | Human | Esophagus | ESCC | 6.79e-06 | 7.95e-01 | 0.082 |
| 790955 | UQCC3 | LZE4T | Human | Esophagus | ESCC | 1.19e-11 | 2.97e-01 | 0.0811 |
| 790955 | UQCC3 | LZE5T | Human | Esophagus | ESCC | 1.64e-09 | 6.82e-01 | 0.0514 |
| 790955 | UQCC3 | LZE7T | Human | Esophagus | ESCC | 1.10e-09 | 5.77e-01 | 0.0667 |
| 790955 | UQCC3 | LZE8T | Human | Esophagus | ESCC | 8.30e-11 | 4.25e-01 | 0.067 |
| 790955 | UQCC3 | LZE20T | Human | Esophagus | ESCC | 9.35e-08 | 3.47e-01 | 0.0662 |
| 790955 | UQCC3 | LZE22D1 | Human | Esophagus | HGIN | 6.33e-07 | 3.54e-01 | 0.0595 |
| 790955 | UQCC3 | LZE22T | Human | Esophagus | ESCC | 7.21e-16 | 8.82e-01 | 0.068 |
| 790955 | UQCC3 | LZE24T | Human | Esophagus | ESCC | 6.82e-34 | 9.50e-01 | 0.0596 |
| 790955 | UQCC3 | LZE21T | Human | Esophagus | ESCC | 1.66e-03 | 4.32e-01 | 0.0655 |
| 790955 | UQCC3 | LZE6T | Human | Esophagus | ESCC | 2.30e-10 | 7.11e-01 | 0.0845 |
| 790955 | UQCC3 | P1T-E | Human | Esophagus | ESCC | 3.32e-15 | 5.07e-01 | 0.0875 |
| 790955 | UQCC3 | P2T-E | Human | Esophagus | ESCC | 5.08e-30 | 6.36e-01 | 0.1177 |
| 790955 | UQCC3 | P4T-E | Human | Esophagus | ESCC | 3.62e-56 | 1.54e+00 | 0.1323 |
| 790955 | UQCC3 | P5T-E | Human | Esophagus | ESCC | 4.94e-49 | 1.03e+00 | 0.1327 |
| 790955 | UQCC3 | P8T-E | Human | Esophagus | ESCC | 1.72e-52 | 1.00e+00 | 0.0889 |
| 790955 | UQCC3 | P9T-E | Human | Esophagus | ESCC | 5.81e-27 | 5.77e-01 | 0.1131 |
| 790955 | UQCC3 | P10T-E | Human | Esophagus | ESCC | 4.73e-19 | 3.49e-01 | 0.116 |
| 790955 | UQCC3 | P11T-E | Human | Esophagus | ESCC | 1.60e-20 | 7.49e-01 | 0.1426 |
| 790955 | UQCC3 | P12T-E | Human | Esophagus | ESCC | 8.17e-40 | 8.04e-01 | 0.1122 |
| Page: 1 2 3 4 5 6 7 |
| Tissue | Expression Dynamics | Abbreviation |
| Esophagus | 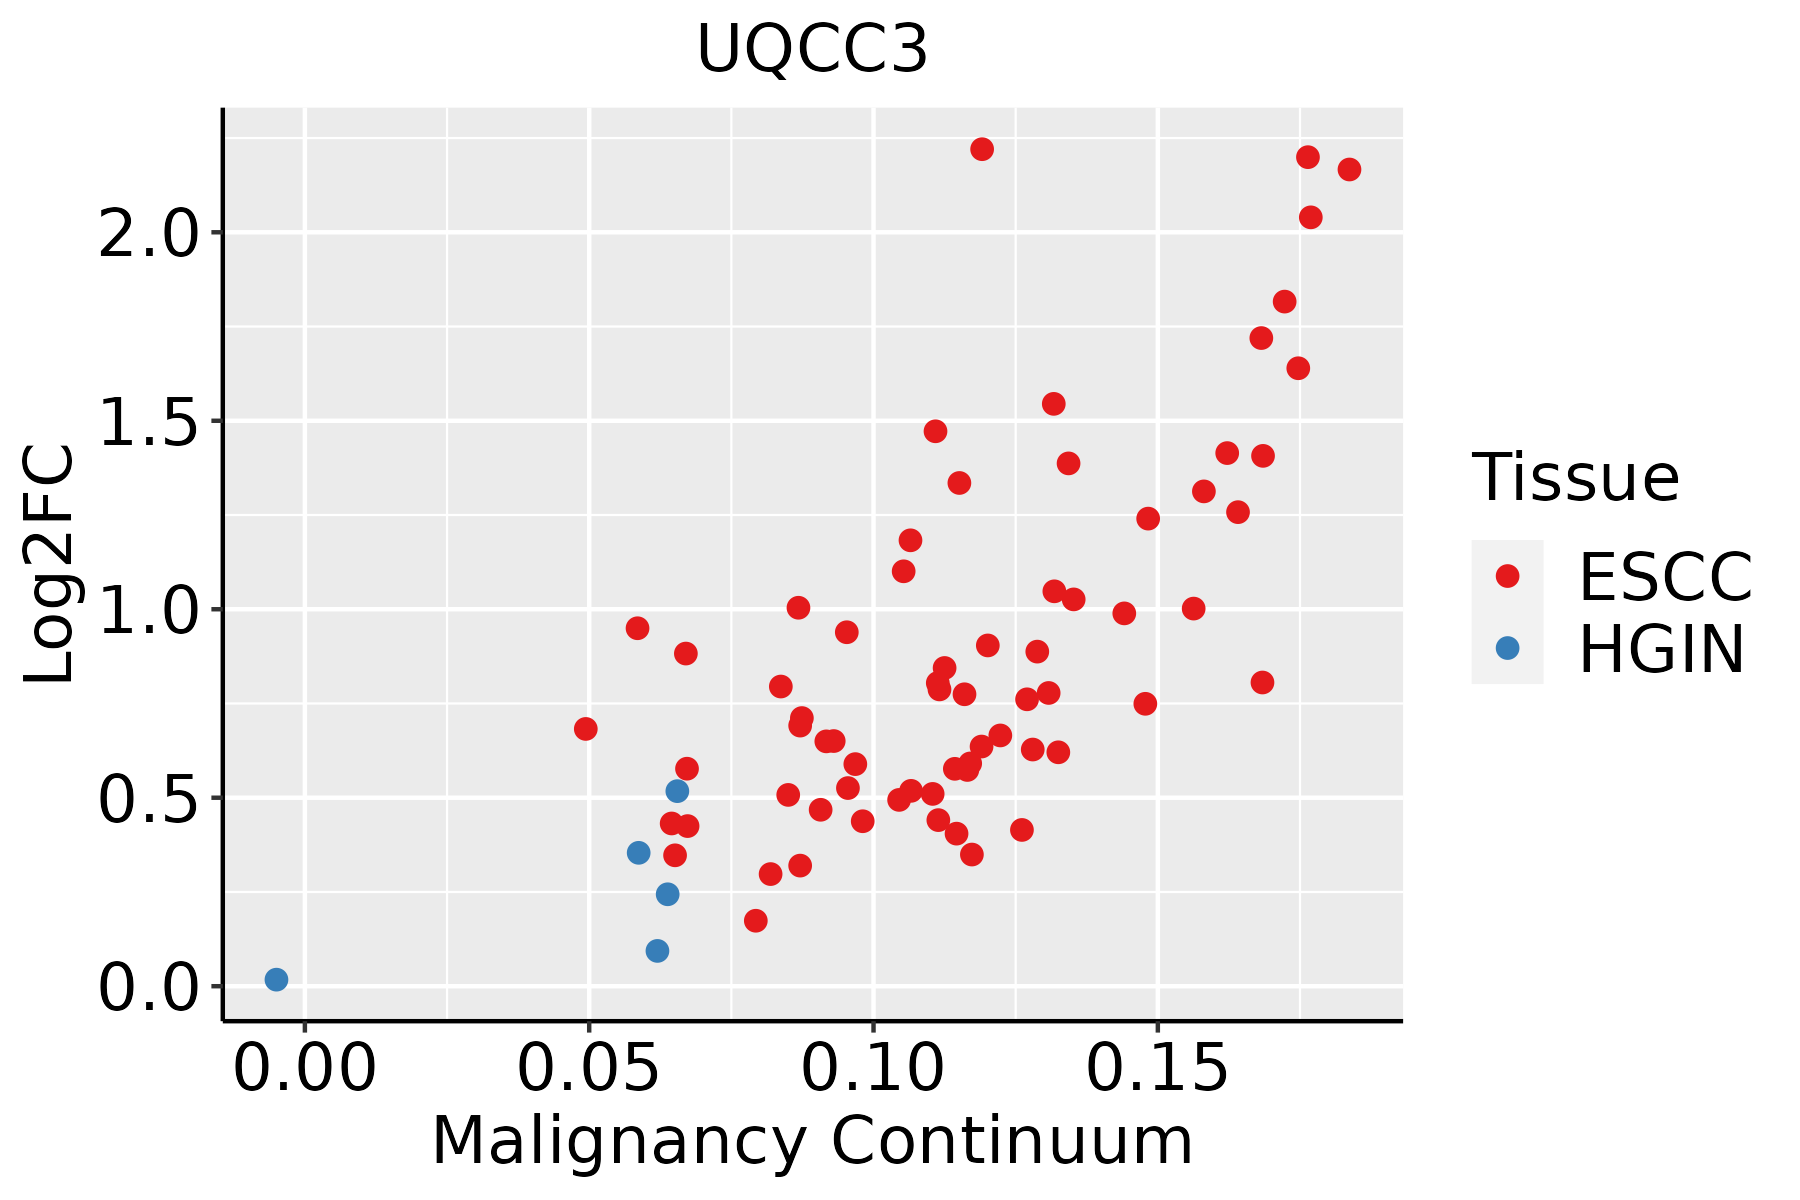 | ESCC: Esophageal squamous cell carcinoma |
| HGIN: High-grade intraepithelial neoplasias | ||
| LGIN: Low-grade intraepithelial neoplasias | ||
| Liver |  | HCC: Hepatocellular carcinoma |
| NAFLD: Non-alcoholic fatty liver disease | ||
| Oral Cavity | 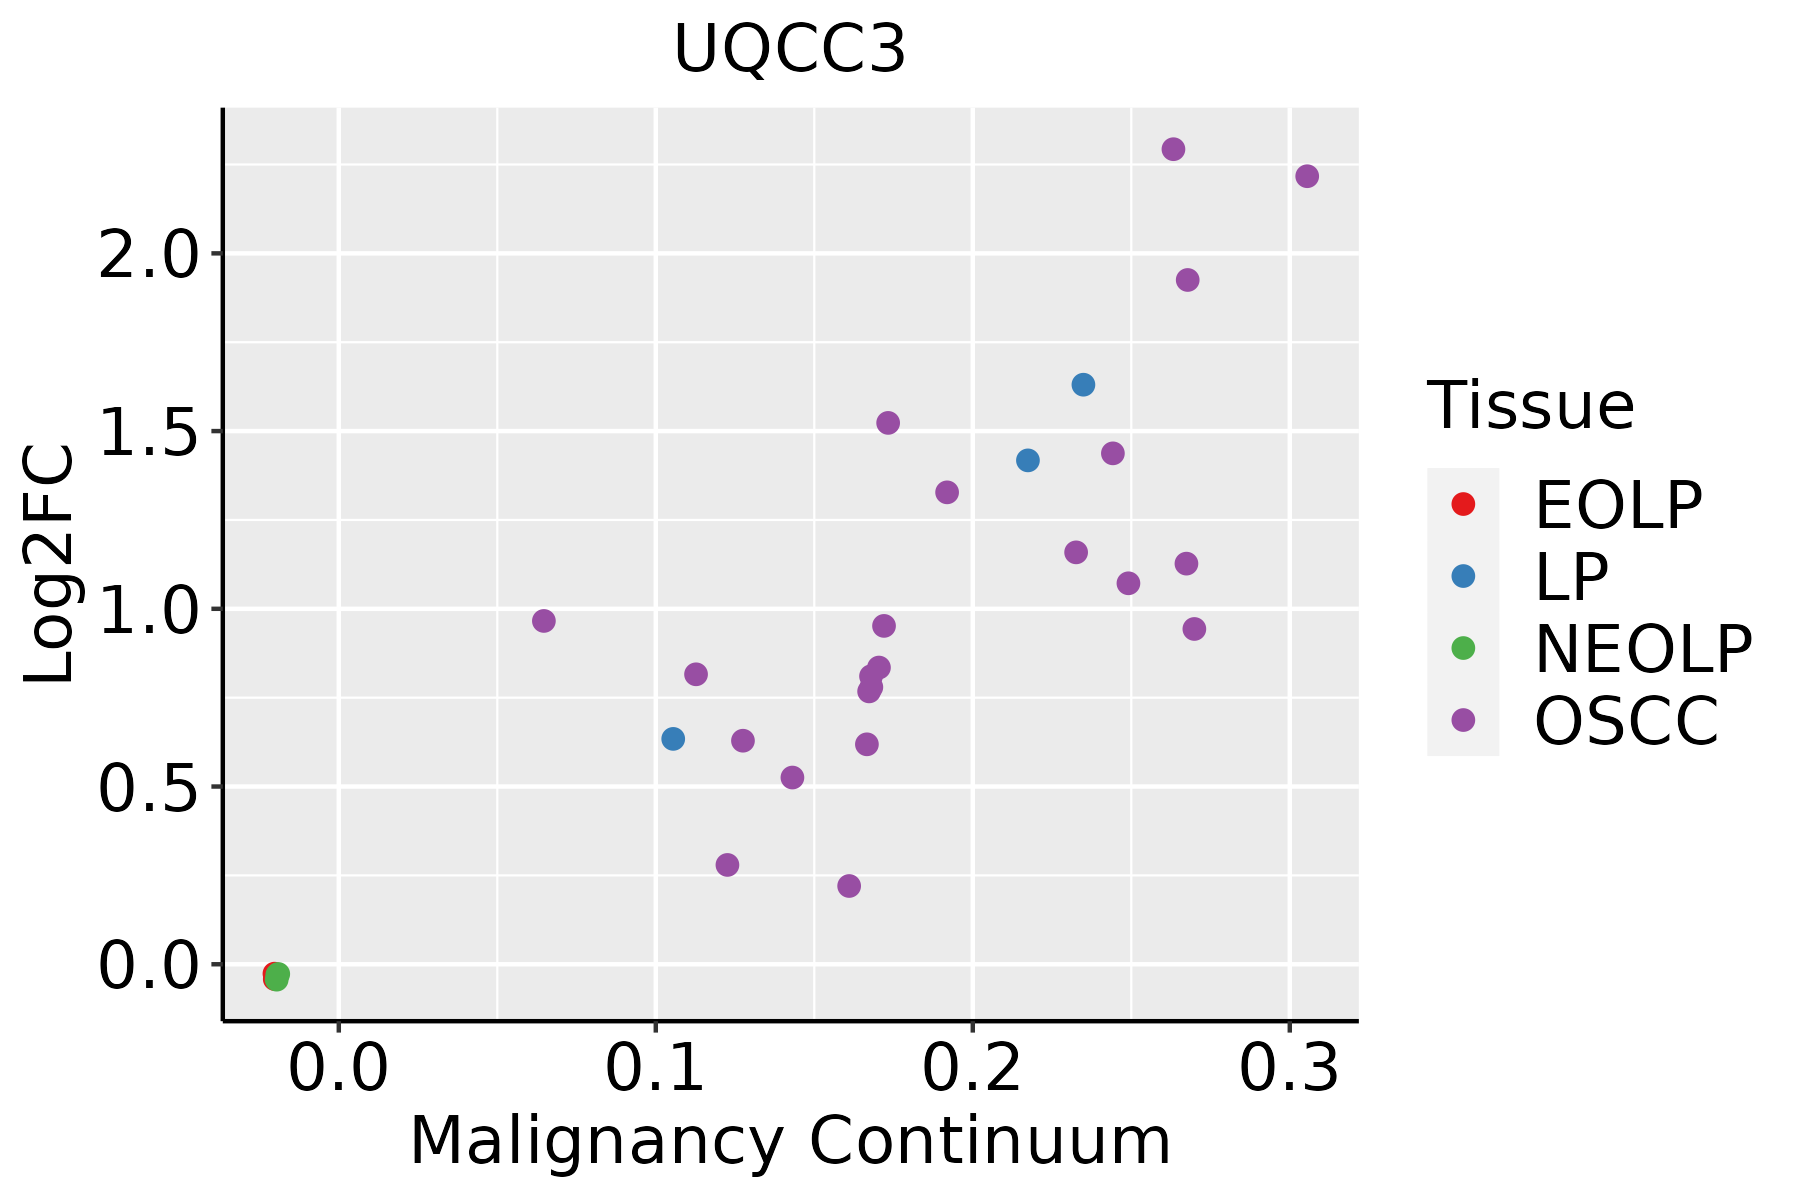 | EOLP: Erosive Oral lichen planus |
| LP: leukoplakia | ||
| NEOLP: Non-erosive oral lichen planus | ||
| OSCC: Oral squamous cell carcinoma | ||
| Prostate | 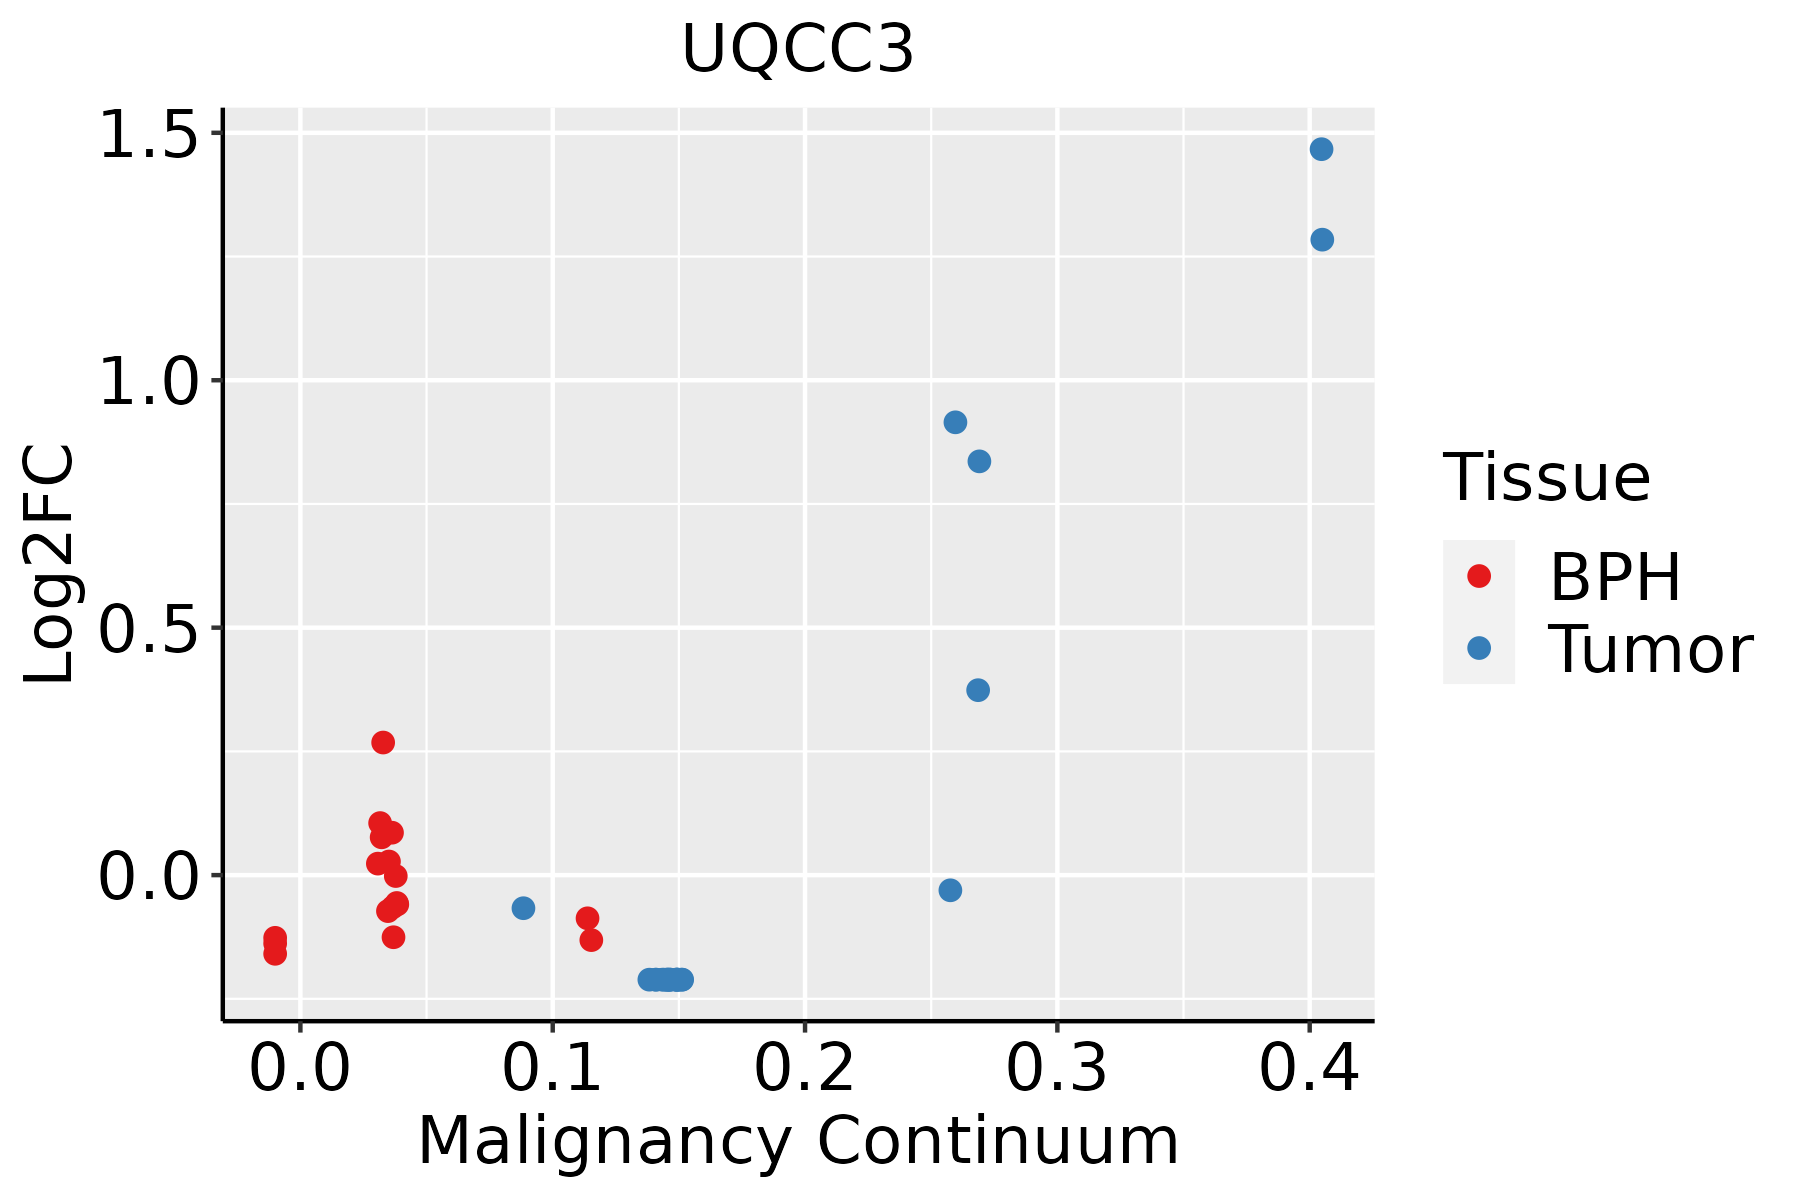 | BPH: Benign Prostatic Hyperplasia |
| Thyroid | 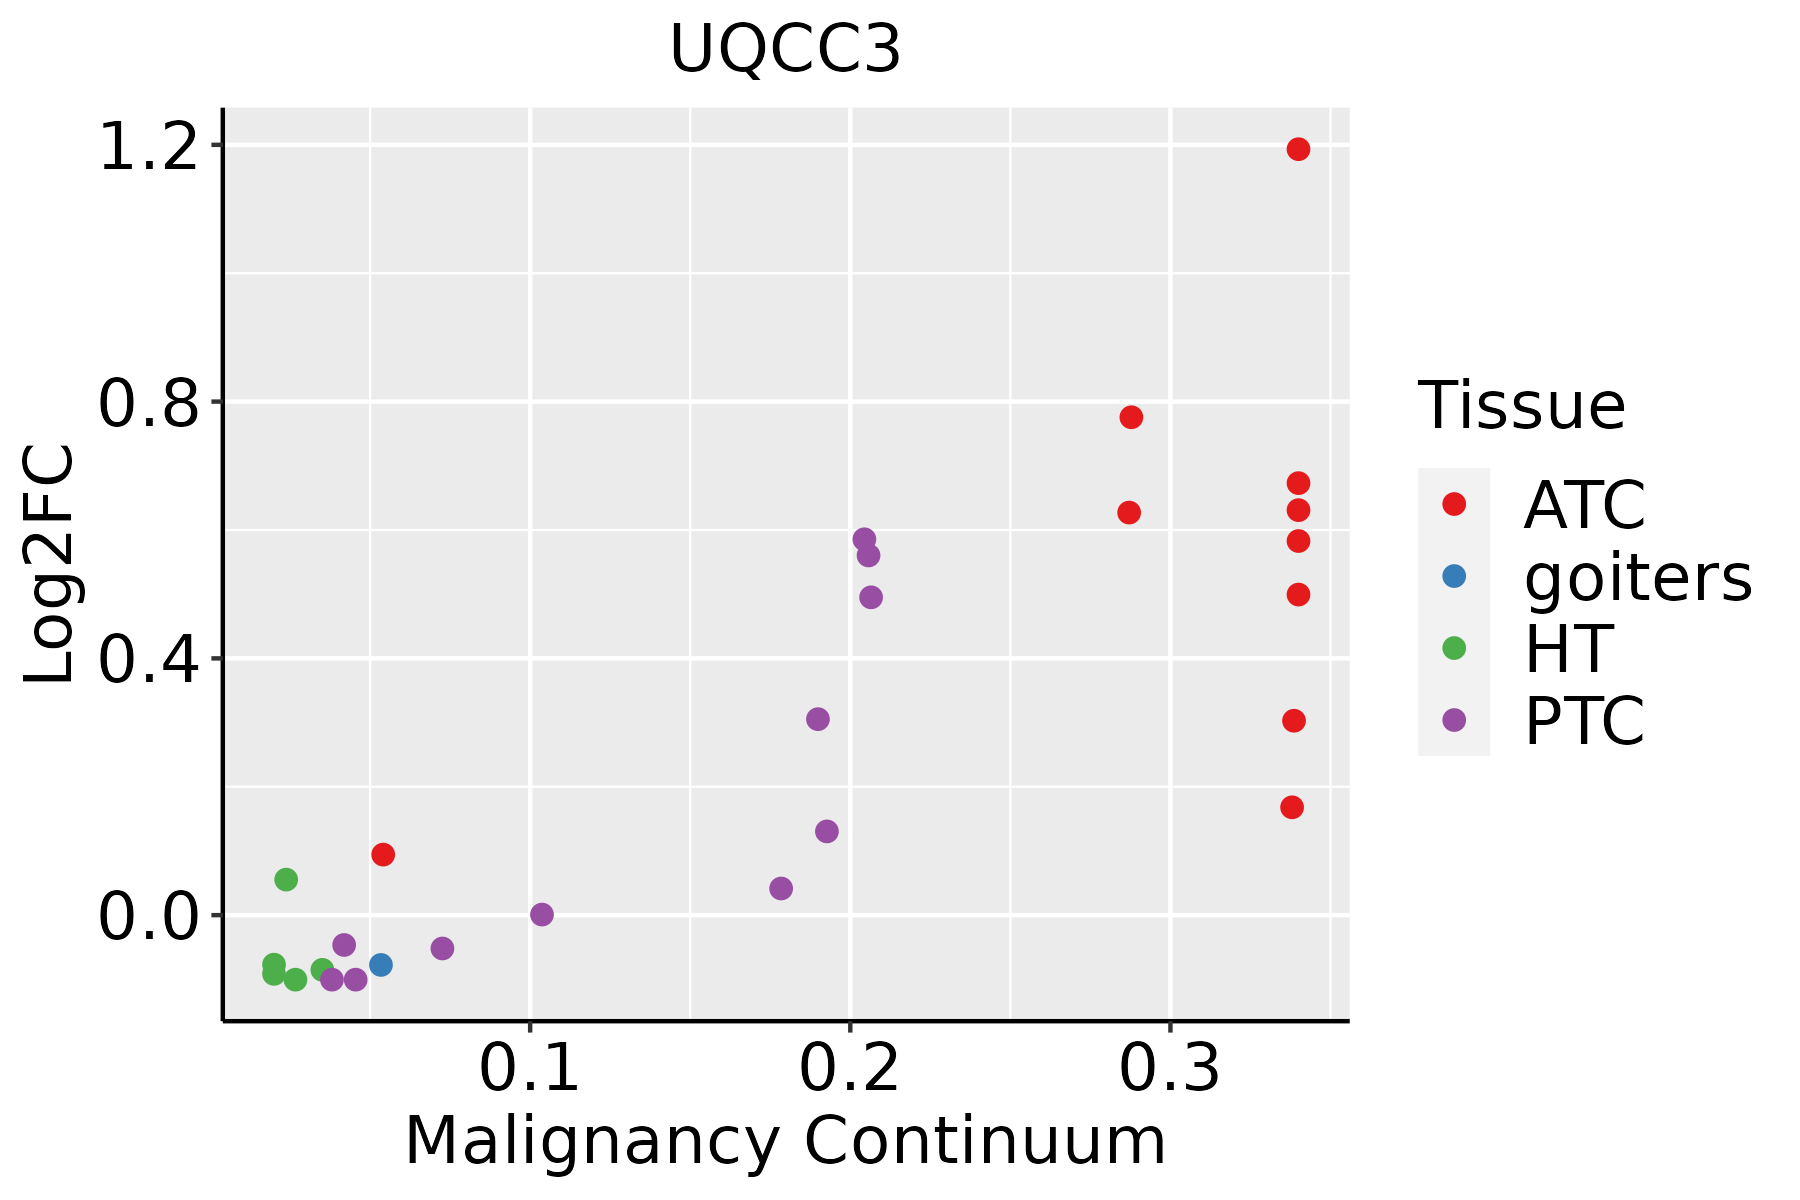 | ATC: Anaplastic thyroid cancer |
| HT: Hashimoto's thyroiditis | ||
| PTC: Papillary thyroid cancer |
| ∗log2FC in expression of this searched gene in stem-like cells from each diseased tissue sample relative to stem-like cells in normal samples in each tissue plotted against the malignancy continuum. Samples are colored based on if they are from different disease stage. |
Top |
Malignant transformation related pathway analysis |
| Find out the enriched GO biological processes and KEGG pathways involved in transition from healthy to precancer to cancer |
| Tissue | Disease Stage | Enriched GO biological Processes |
| Colorectum | AD |  |
| Colorectum | SER |  |
| Colorectum | MSS |  |
| Colorectum | MSI-H |  |
| Colorectum | FAP |  |
| ∗Top 15 enriched GO BP terms are showed in the bar plot of each disease state in each tissue. Each row represents a significant GO biological process which is colored according to the -log10(p.adjust). |
| Page: 1 2 3 4 5 6 7 8 9 |
| GO ID | Tissue | Disease Stage | Description | Gene Ratio | Bg Ratio | pvalue | p.adjust | Count |
| GO:000611920 | Esophagus | HGIN | oxidative phosphorylation | 69/2587 | 141/18723 | 1.37e-23 | 2.05e-20 | 69 |
| GO:000906020 | Esophagus | HGIN | aerobic respiration | 81/2587 | 189/18723 | 1.07e-22 | 9.26e-20 | 81 |
| GO:004603427 | Esophagus | HGIN | ATP metabolic process | 101/2587 | 277/18723 | 1.53e-21 | 1.02e-18 | 101 |
| GO:000609120 | Esophagus | HGIN | generation of precursor metabolites and energy | 145/2587 | 490/18723 | 3.41e-20 | 2.04e-17 | 145 |
| GO:004533320 | Esophagus | HGIN | cellular respiration | 86/2587 | 230/18723 | 2.41e-19 | 1.20e-16 | 86 |
| GO:001598020 | Esophagus | HGIN | energy derivation by oxidation of organic compounds | 105/2587 | 318/18723 | 1.16e-18 | 4.99e-16 | 105 |
| GO:004277320 | Esophagus | HGIN | ATP synthesis coupled electron transport | 49/2587 | 95/18723 | 2.21e-18 | 7.36e-16 | 49 |
| GO:004277520 | Esophagus | HGIN | mitochondrial ATP synthesis coupled electron transport | 49/2587 | 95/18723 | 2.21e-18 | 7.36e-16 | 49 |
| GO:003310820 | Esophagus | HGIN | mitochondrial respiratory chain complex assembly | 47/2587 | 93/18723 | 3.15e-17 | 8.60e-15 | 47 |
| GO:002290420 | Esophagus | HGIN | respiratory electron transport chain | 51/2587 | 114/18723 | 9.63e-16 | 2.41e-13 | 51 |
| GO:001964620 | Esophagus | HGIN | aerobic electron transport chain | 43/2587 | 87/18723 | 1.98e-15 | 4.41e-13 | 43 |
| GO:002290020 | Esophagus | HGIN | electron transport chain | 66/2587 | 175/18723 | 2.21e-15 | 4.73e-13 | 66 |
| GO:000914419 | Esophagus | HGIN | purine nucleoside triphosphate metabolic process | 36/2587 | 88/18723 | 3.49e-10 | 3.05e-08 | 36 |
| GO:000914518 | Esophagus | HGIN | purine nucleoside triphosphate biosynthetic process | 31/2587 | 69/18723 | 3.51e-10 | 3.05e-08 | 31 |
| GO:000920618 | Esophagus | HGIN | purine ribonucleoside triphosphate biosynthetic process | 30/2587 | 68/18723 | 1.16e-09 | 9.27e-08 | 30 |
| GO:000920518 | Esophagus | HGIN | purine ribonucleoside triphosphate metabolic process | 33/2587 | 82/18723 | 3.10e-09 | 2.27e-07 | 33 |
| GO:000675417 | Esophagus | HGIN | ATP biosynthetic process | 26/2587 | 57/18723 | 6.19e-09 | 4.04e-07 | 26 |
| GO:000920117 | Esophagus | HGIN | ribonucleoside triphosphate biosynthetic process | 30/2587 | 74/18723 | 1.30e-08 | 8.15e-07 | 30 |
| GO:000914120 | Esophagus | HGIN | nucleoside triphosphate metabolic process | 39/2587 | 112/18723 | 1.56e-08 | 9.53e-07 | 39 |
| GO:000919917 | Esophagus | HGIN | ribonucleoside triphosphate metabolic process | 33/2587 | 89/18723 | 3.42e-08 | 1.97e-06 | 33 |
| Page: 1 2 3 4 5 6 7 8 9 10 11 12 13 14 15 16 17 18 19 |
| Pathway ID | Tissue | Disease Stage | Description | Gene Ratio | Bg Ratio | pvalue | p.adjust | qvalue | Count |
| Page: 1 |
Top |
Cell-cell communication analysis |
| Identification of potential cell-cell interactions between two cell types and their ligand-receptor pairs for different disease states |
| Ligand | Receptor | LRpair | Pathway | Tissue | Disease Stage |
| Page: 1 |
Top |
Single-cell gene regulatory network inference analysis |
| Find out the significant the regulons (TFs) and the target genes of each regulon across cell types for different disease states |
| TF | Cell Type | Tissue | Disease Stage | Target Gene | RSS | Regulon Activity |
| ∗The dot plots of a searched regulon are shown for all cell subpopulations in each disease state of each tissue based on the regulon specific score inferred using pySCENIC and by calculating the average expression. |
| Page: 1 |
Top |
Somatic mutation of malignant transformation related genes |
| Annotation of somatic variants for genes involved in malignant transformation |
| Hugo Symbol | Variant Class | Variant Classification | dbSNP RS | HGVSc | HGVSp | HGVSp Short | SWISSPROT | BIOTYPE | SIFT | PolyPhen | Tumor Sample Barcode | Tissue | Histology | Sex | Age | Stage | Therapy Types | Drugs | Outcome |
| UQCC3 | SNV | Missense_Mutation | c.109G>A | p.Glu37Lys | p.E37K | Q6UW78 | protein_coding | tolerated(0.18) | benign(0.08) | TCGA-DS-A1OC-01 | Cervix | cervical & endocervical cancer | Female | <65 | I/II | Chemotherapy | gemcitabine | SD | |
| UQCC3 | insertion | Frame_Shift_Ins | novel | c.111_112insCC | p.Met38ProfsTer3 | p.M38Pfs*3 | Q6UW78 | protein_coding | TCGA-DS-A1OC-01 | Cervix | cervical & endocervical cancer | Female | <65 | I/II | Chemotherapy | gemcitabine | SD | ||
| UQCC3 | SNV | Missense_Mutation | c.184G>A | p.Ala62Thr | p.A62T | Q6UW78 | protein_coding | tolerated(0.08) | benign(0.168) | TCGA-AA-A02K-01 | Colorectum | colon adenocarcinoma | Male | <65 | III/IV | Chemotherapy | folinic | PD | |
| UQCC3 | SNV | Missense_Mutation | c.109G>A | p.Glu37Lys | p.E37K | Q6UW78 | protein_coding | tolerated(0.18) | benign(0.08) | TCGA-H7-8502-01 | Oral cavity | head & neck squamous cell carcinoma | Male | <65 | I/II | Chemotherapy | unknown | SD | |
| UQCC3 | insertion | Nonsense_Mutation | novel | c.111_112insCCATAG | p.Glu37_Met38insProTer | p.E37_M38insP* | Q6UW78 | protein_coding | TCGA-H7-8502-01 | Oral cavity | head & neck squamous cell carcinoma | Male | <65 | I/II | Chemotherapy | unknown | SD | ||
| UQCC3 | SNV | Missense_Mutation | c.205N>G | p.Thr69Ala | p.T69A | Q6UW78 | protein_coding | tolerated(0.69) | benign(0) | TCGA-CG-5721-01 | Stomach | stomach adenocarcinoma | Male | <65 | III/IV | Unknown | Unknown | SD |
| Page: 1 |
Top |
Related drugs of malignant transformation related genes |
| Identification of chemicals and drugs interact with genes involved in malignant transfromation |
| (DGIdb 4.0) |
| Entrez ID | Symbol | Category | Interaction Types | Drug Claim Name | Drug Name | PMIDs |
| Page: 1 |

Copyright 2023-Present -The University of Texas Health Science Center at Houston |