
|
|||||
|
 | |
| |
| |
| |
| |
| |
|
Gene: UQCC2 |
Gene summary for UQCC2 |
| Gene information | Species | Human | Gene symbol | UQCC2 | Gene ID | 84300 |
| Gene name | ubiquinol-cytochrome c reductase complex assembly factor 2 | |
| Gene Alias | C6orf125 | |
| Cytomap | 6p21.31 | |
| Gene Type | protein-coding | GO ID | GO:0002082 | UniProtAcc | Q9BRT2 |
Top |
Malignant transformation analysis |
| Identification of the aberrant gene expression in precancerous and cancerous lesions by comparing the gene expression of stem-like cells in diseased tissues with normal stem cells |
| Entrez ID | Symbol | Replicates | Species | Organ | Tissue | Adj P-value | Log2FC | Malignancy |
| 84300 | UQCC2 | GSM4909281 | Human | Breast | IDC | 4.08e-14 | 5.32e-01 | 0.21 |
| 84300 | UQCC2 | GSM4909286 | Human | Breast | IDC | 6.38e-05 | 9.32e-02 | 0.1081 |
| 84300 | UQCC2 | GSM4909288 | Human | Breast | IDC | 4.37e-02 | 1.76e-01 | 0.0988 |
| 84300 | UQCC2 | GSM4909290 | Human | Breast | IDC | 7.52e-04 | 3.15e-01 | 0.2096 |
| 84300 | UQCC2 | GSM4909293 | Human | Breast | IDC | 1.11e-27 | 6.67e-01 | 0.1581 |
| 84300 | UQCC2 | GSM4909294 | Human | Breast | IDC | 1.61e-05 | 3.90e-01 | 0.2022 |
| 84300 | UQCC2 | GSM4909296 | Human | Breast | IDC | 2.15e-04 | 6.00e-02 | 0.1524 |
| 84300 | UQCC2 | GSM4909297 | Human | Breast | IDC | 7.24e-05 | 6.35e-02 | 0.1517 |
| 84300 | UQCC2 | GSM4909298 | Human | Breast | IDC | 3.93e-02 | 6.24e-02 | 0.1551 |
| 84300 | UQCC2 | GSM4909301 | Human | Breast | IDC | 4.28e-04 | 3.74e-01 | 0.1577 |
| 84300 | UQCC2 | GSM4909308 | Human | Breast | IDC | 8.64e-08 | 3.59e-01 | 0.158 |
| 84300 | UQCC2 | GSM4909311 | Human | Breast | IDC | 1.16e-22 | -5.78e-03 | 0.1534 |
| 84300 | UQCC2 | GSM4909312 | Human | Breast | IDC | 5.20e-04 | 8.63e-02 | 0.1552 |
| 84300 | UQCC2 | GSM4909315 | Human | Breast | IDC | 2.48e-07 | 4.69e-01 | 0.21 |
| 84300 | UQCC2 | GSM4909316 | Human | Breast | IDC | 8.40e-10 | 5.86e-01 | 0.21 |
| 84300 | UQCC2 | GSM4909319 | Human | Breast | IDC | 5.69e-31 | -1.56e-02 | 0.1563 |
| 84300 | UQCC2 | GSM4909320 | Human | Breast | IDC | 1.10e-04 | 1.04e-01 | 0.1575 |
| 84300 | UQCC2 | GSM4909321 | Human | Breast | IDC | 3.61e-06 | 3.05e-03 | 0.1559 |
| 84300 | UQCC2 | brca2 | Human | Breast | Precancer | 7.48e-03 | 2.10e-01 | -0.024 |
| 84300 | UQCC2 | NCCBC11 | Human | Breast | DCIS | 6.40e-03 | 2.72e-01 | 0.1232 |
| Page: 1 2 3 4 5 6 7 8 9 10 |
| Tissue | Expression Dynamics | Abbreviation |
| Breast | 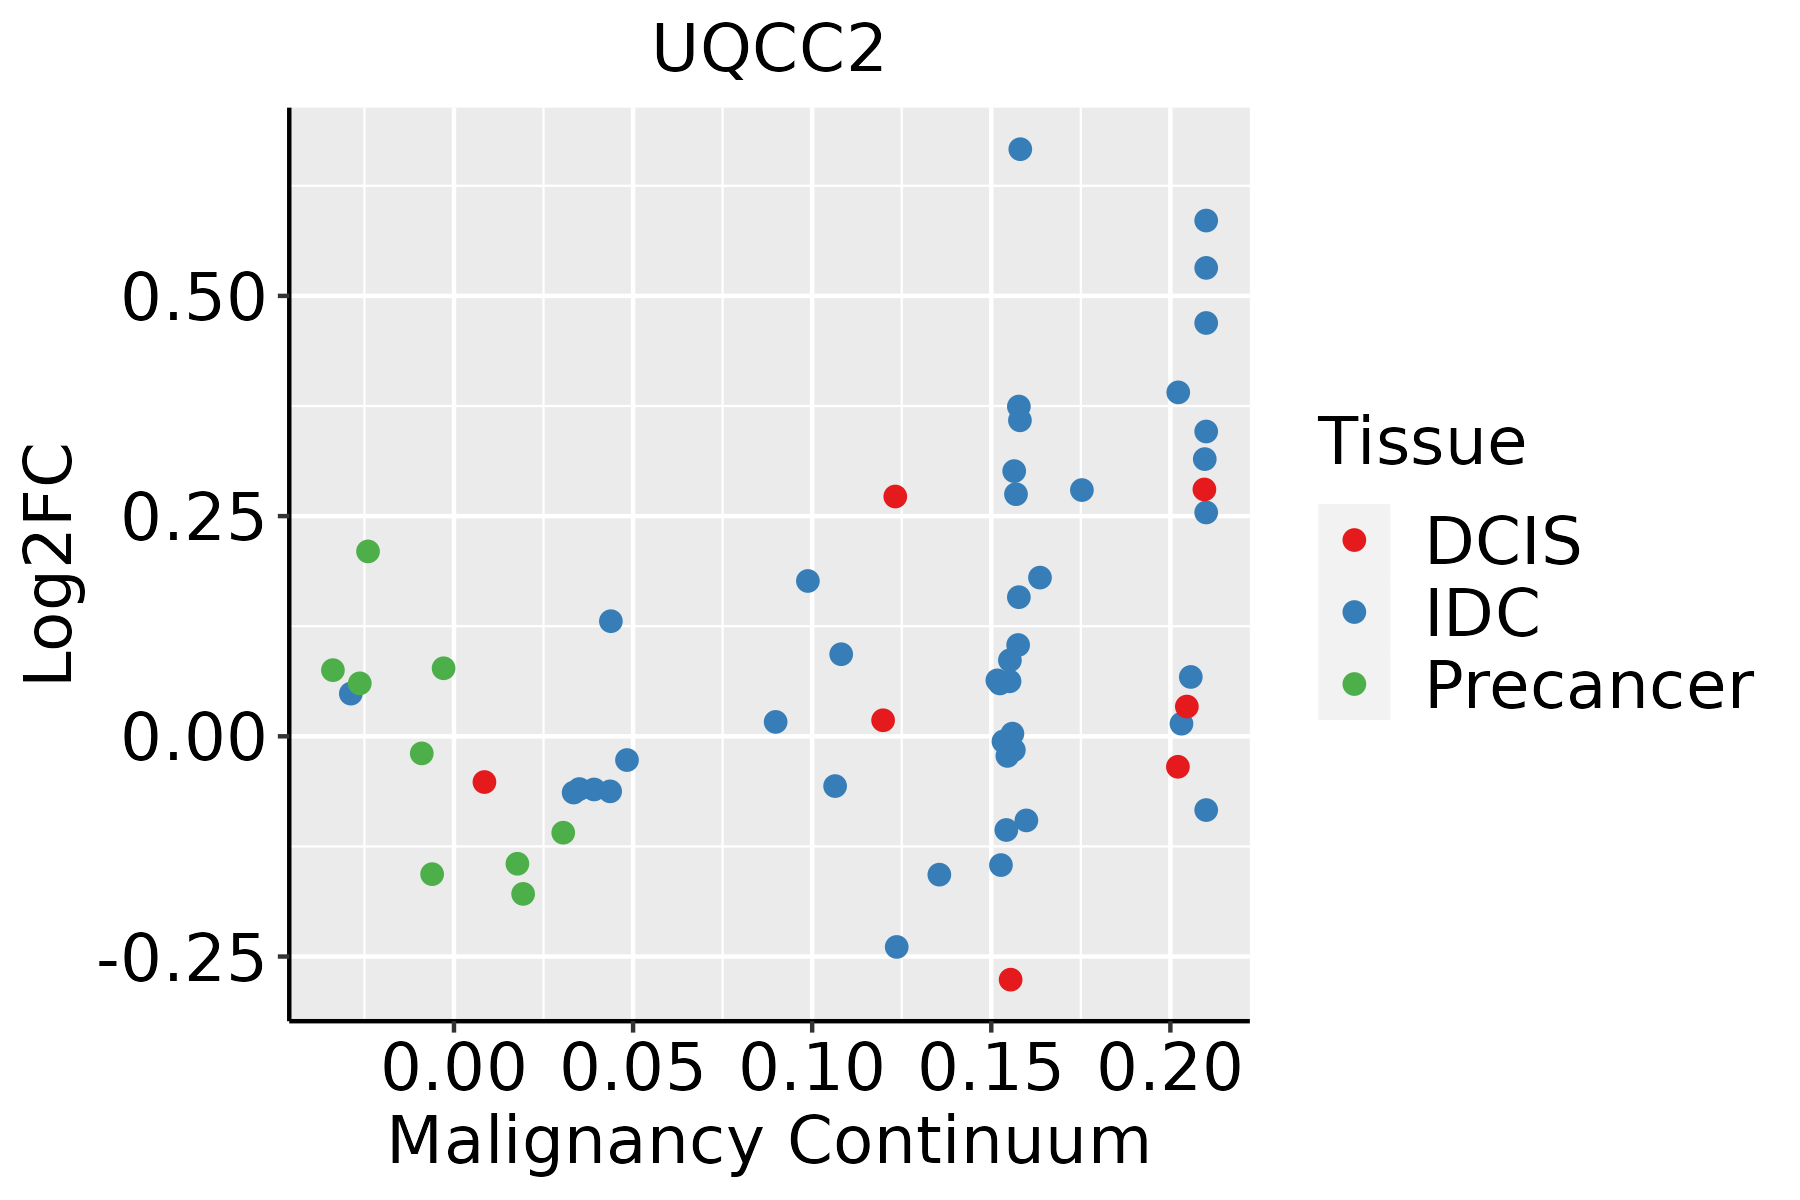 | IDC: Invasive ductal carcinoma |
| DCIS: Ductal carcinoma in situ | ||
| Precancer(BRCA1-mut): Precancerous lesion from BRCA1 mutation carriers | ||
| Endometrium |  | AEH: Atypical endometrial hyperplasia |
| EEC: Endometrioid Cancer | ||
| Esophagus |  | ESCC: Esophageal squamous cell carcinoma |
| HGIN: High-grade intraepithelial neoplasias | ||
| LGIN: Low-grade intraepithelial neoplasias | ||
| GC |  | CAG: Chronic atrophic gastritis |
| CAG with IM: Chronic atrophic gastritis with intestinal metaplasia | ||
| CSG: Chronic superficial gastritis | ||
| GC: Gastric cancer | ||
| SIM: Severe intestinal metaplasia | ||
| WIM: Wild intestinal metaplasia | ||
| Liver | 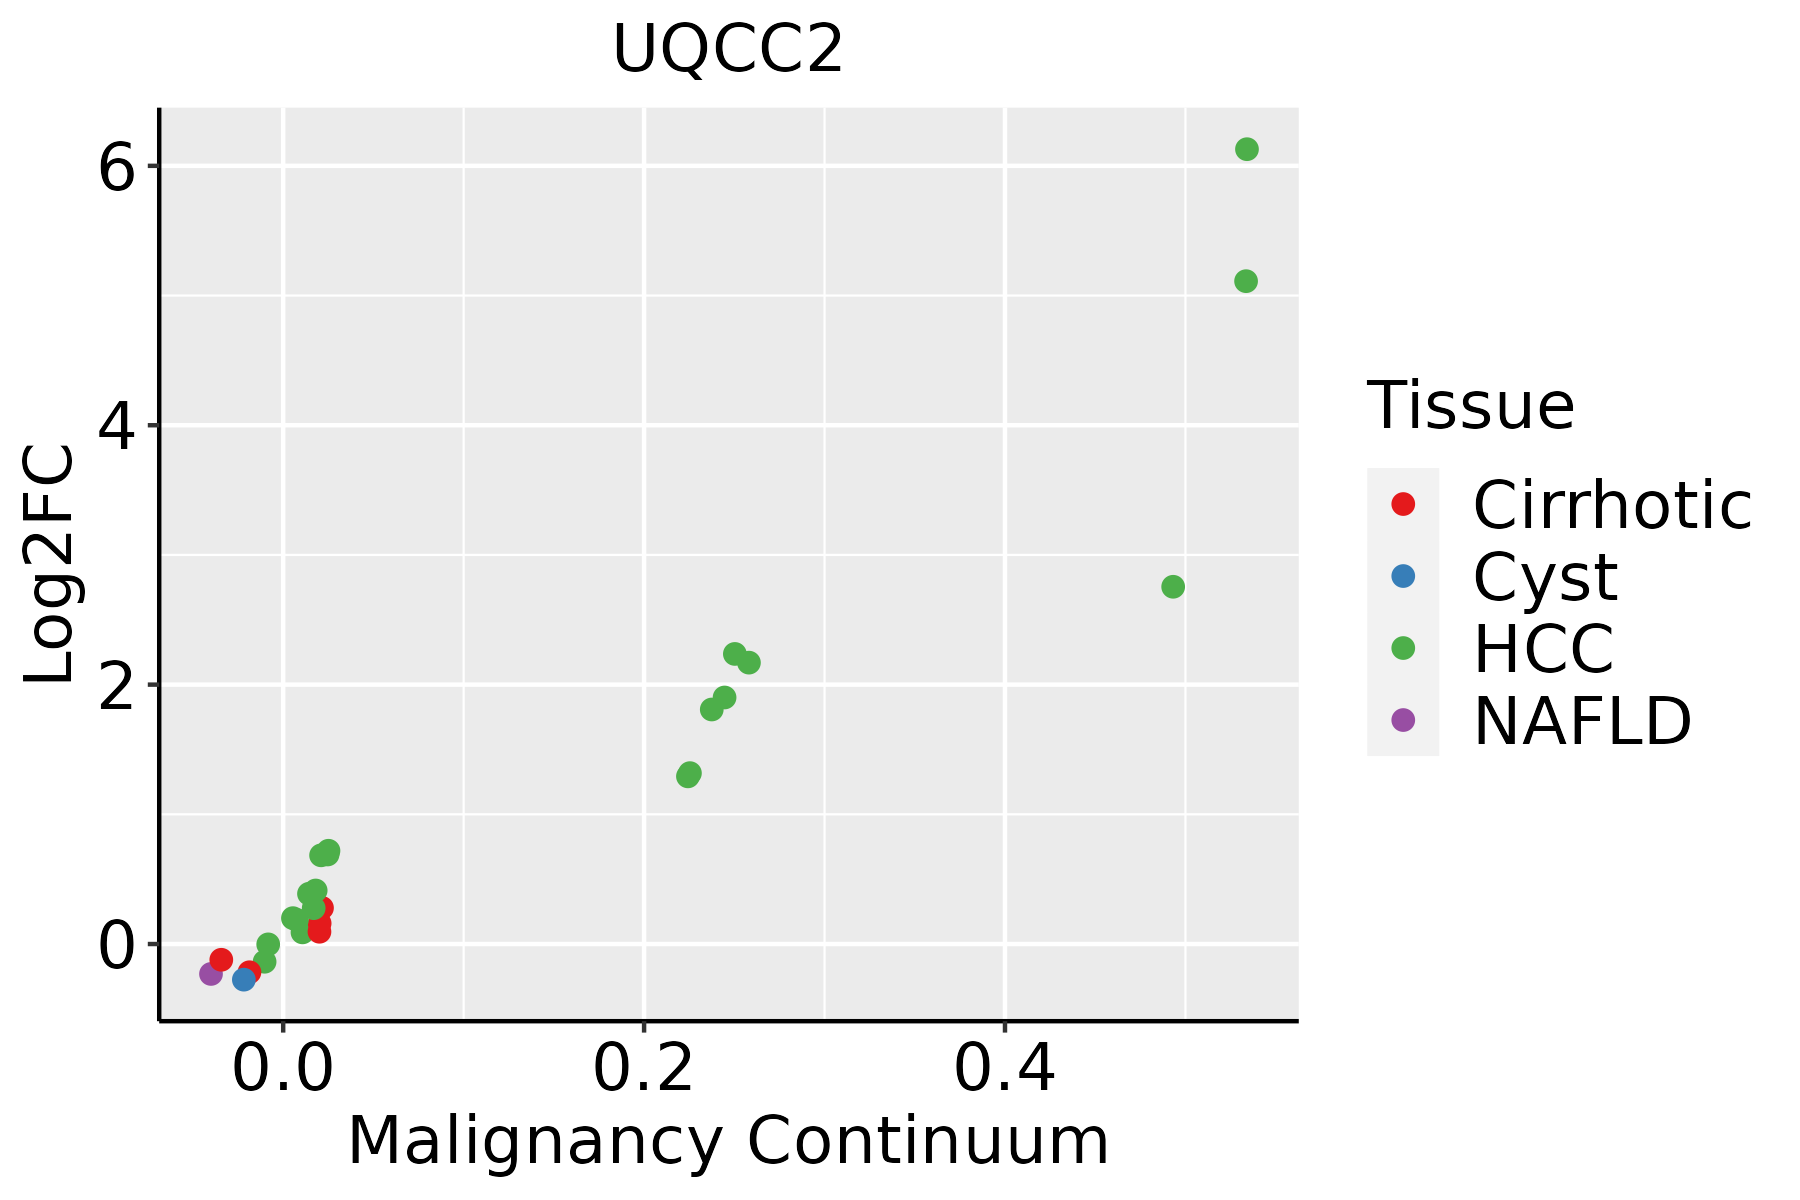 | HCC: Hepatocellular carcinoma |
| NAFLD: Non-alcoholic fatty liver disease | ||
| Oral Cavity | 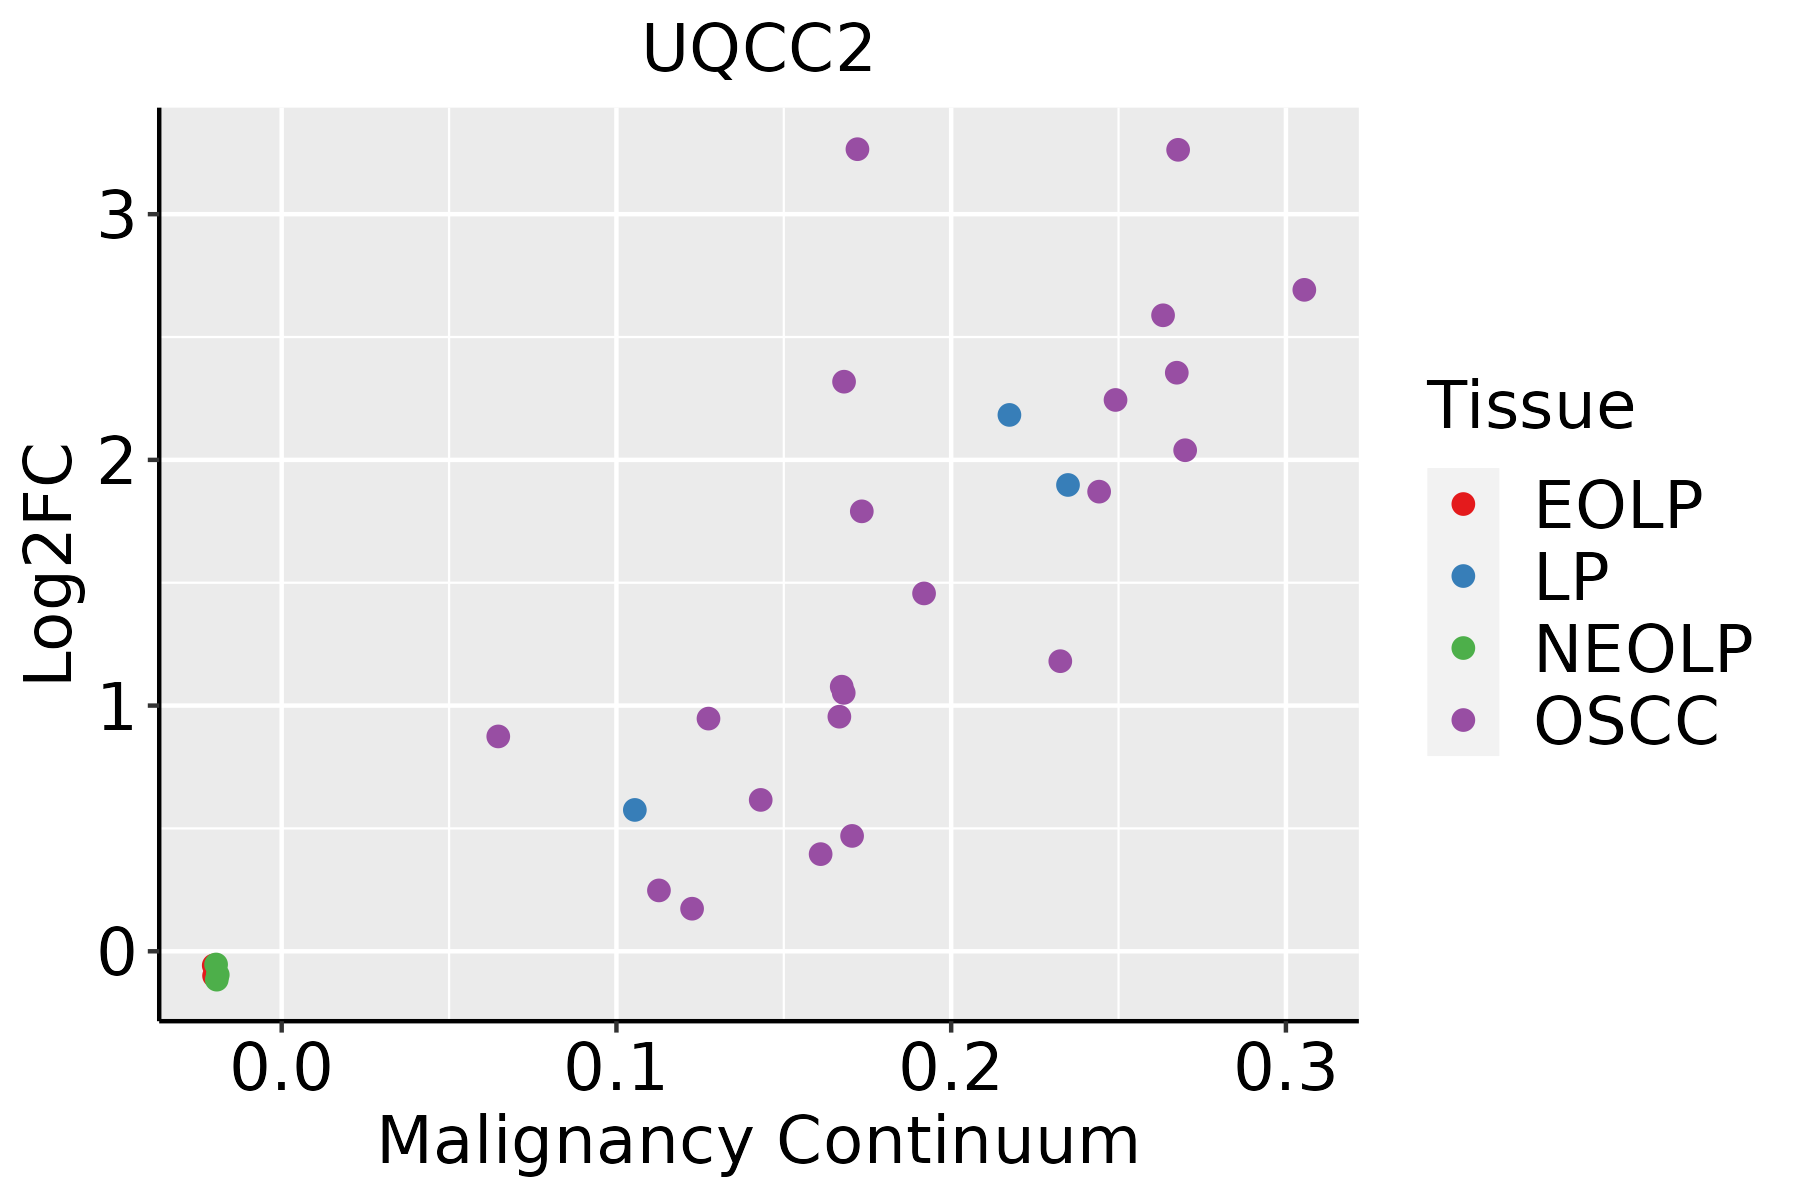 | EOLP: Erosive Oral lichen planus |
| LP: leukoplakia | ||
| NEOLP: Non-erosive oral lichen planus | ||
| OSCC: Oral squamous cell carcinoma | ||
| Prostate |  | BPH: Benign Prostatic Hyperplasia |
| Skin |  | AK: Actinic keratosis |
| cSCC: Cutaneous squamous cell carcinoma | ||
| SCCIS:squamous cell carcinoma in situ | ||
| Thyroid | 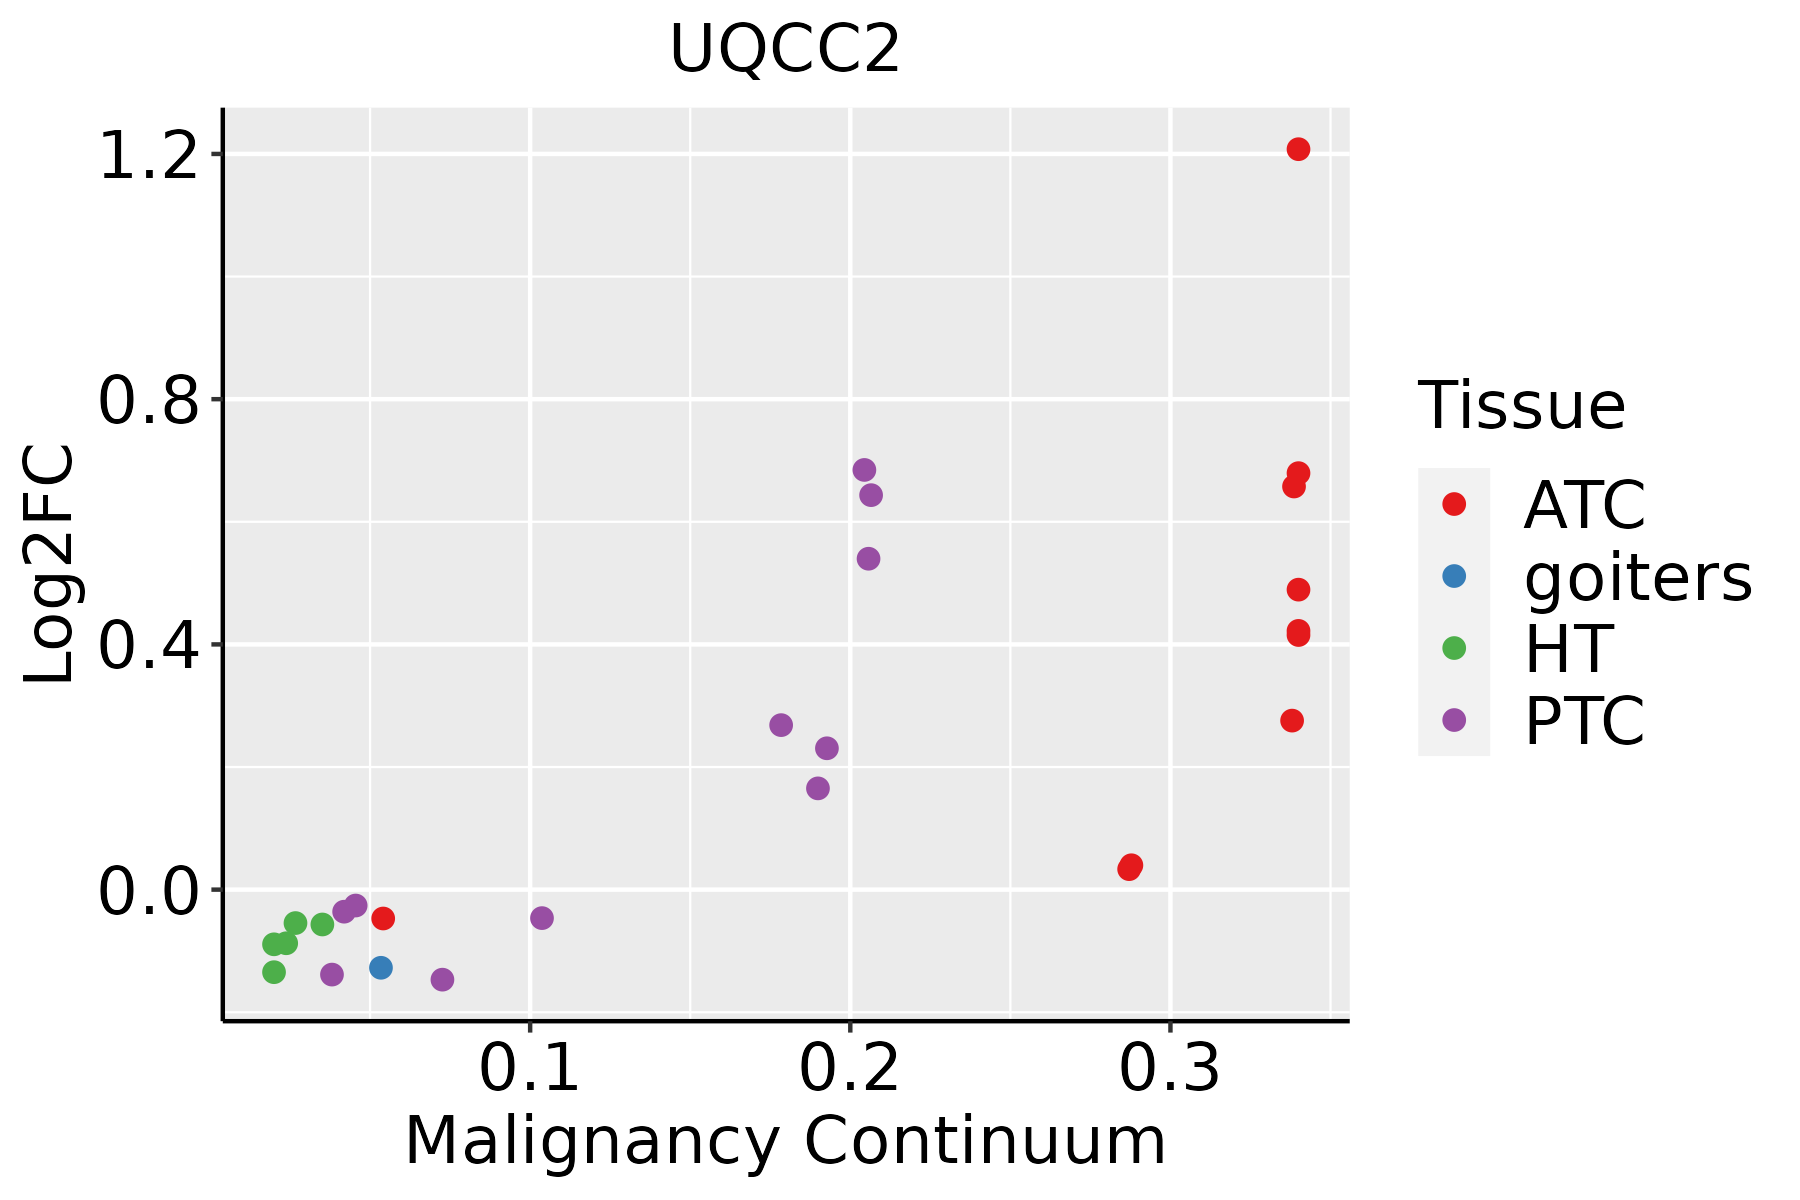 | ATC: Anaplastic thyroid cancer |
| HT: Hashimoto's thyroiditis | ||
| PTC: Papillary thyroid cancer |
| ∗log2FC in expression of this searched gene in stem-like cells from each diseased tissue sample relative to stem-like cells in normal samples in each tissue plotted against the malignancy continuum. Samples are colored based on if they are from different disease stage. |
Top |
Malignant transformation related pathway analysis |
| Find out the enriched GO biological processes and KEGG pathways involved in transition from healthy to precancer to cancer |
| Tissue | Disease Stage | Enriched GO biological Processes |
| Colorectum | AD |  |
| Colorectum | SER |  |
| Colorectum | MSS |  |
| Colorectum | MSI-H |  |
| Colorectum | FAP |  |
| ∗Top 15 enriched GO BP terms are showed in the bar plot of each disease state in each tissue. Each row represents a significant GO biological process which is colored according to the -log10(p.adjust). |
| Page: 1 2 3 4 5 6 7 8 9 |
| GO ID | Tissue | Disease Stage | Description | Gene Ratio | Bg Ratio | pvalue | p.adjust | Count |
| GO:00460349 | Breast | Precancer | ATP metabolic process | 82/1080 | 277/18723 | 1.94e-36 | 5.19e-33 | 82 |
| GO:00061199 | Breast | Precancer | oxidative phosphorylation | 53/1080 | 141/18723 | 1.15e-29 | 2.04e-26 | 53 |
| GO:00090608 | Breast | Precancer | aerobic respiration | 58/1080 | 189/18723 | 5.69e-27 | 7.62e-24 | 58 |
| GO:00060918 | Breast | Precancer | generation of precursor metabolites and energy | 94/1080 | 490/18723 | 1.54e-25 | 1.64e-22 | 94 |
| GO:00453338 | Breast | Precancer | cellular respiration | 59/1080 | 230/18723 | 5.97e-23 | 5.32e-20 | 59 |
| GO:00159808 | Breast | Precancer | energy derivation by oxidation of organic compounds | 70/1080 | 318/18723 | 8.33e-23 | 6.37e-20 | 70 |
| GO:00064179 | Breast | Precancer | regulation of translation | 67/1080 | 468/18723 | 4.71e-12 | 7.64e-10 | 67 |
| GO:00457279 | Breast | Precancer | positive regulation of translation | 32/1080 | 136/18723 | 5.89e-12 | 9.27e-10 | 32 |
| GO:00342509 | Breast | Precancer | positive regulation of cellular amide metabolic process | 33/1080 | 162/18723 | 1.72e-10 | 1.77e-08 | 33 |
| GO:00331088 | Breast | Precancer | mitochondrial respiratory chain complex assembly | 24/1080 | 93/18723 | 3.39e-10 | 3.16e-08 | 24 |
| GO:00434677 | Breast | Precancer | regulation of generation of precursor metabolites and energy | 22/1080 | 130/18723 | 4.95e-06 | 1.51e-04 | 22 |
| GO:19035789 | Breast | Precancer | regulation of ATP metabolic process | 15/1080 | 87/18723 | 1.24e-04 | 2.21e-03 | 15 |
| GO:0035914 | Breast | Precancer | skeletal muscle cell differentiation | 11/1080 | 67/18723 | 1.47e-03 | 1.52e-02 | 11 |
| GO:00507086 | Breast | Precancer | regulation of protein secretion | 28/1080 | 268/18723 | 1.76e-03 | 1.74e-02 | 28 |
| GO:19037155 | Breast | Precancer | regulation of aerobic respiration | 7/1080 | 33/18723 | 2.37e-03 | 2.19e-02 | 7 |
| GO:00158336 | Breast | Precancer | peptide transport | 27/1080 | 264/18723 | 2.84e-03 | 2.49e-02 | 27 |
| GO:00900875 | Breast | Precancer | regulation of peptide transport | 22/1080 | 202/18723 | 3.14e-03 | 2.65e-02 | 22 |
| GO:00605374 | Breast | Precancer | muscle tissue development | 37/1080 | 403/18723 | 3.60e-03 | 2.98e-02 | 37 |
| GO:00300736 | Breast | Precancer | insulin secretion | 21/1080 | 195/18723 | 4.38e-03 | 3.42e-02 | 21 |
| GO:00716926 | Breast | Precancer | protein localization to extracellular region | 34/1080 | 368/18723 | 4.65e-03 | 3.58e-02 | 34 |
| Page: 1 2 3 4 5 6 7 8 9 10 11 12 13 14 15 16 17 18 19 20 21 22 |
| Pathway ID | Tissue | Disease Stage | Description | Gene Ratio | Bg Ratio | pvalue | p.adjust | qvalue | Count |
| Page: 1 |
Top |
Cell-cell communication analysis |
| Identification of potential cell-cell interactions between two cell types and their ligand-receptor pairs for different disease states |
| Ligand | Receptor | LRpair | Pathway | Tissue | Disease Stage |
| Page: 1 |
Top |
Single-cell gene regulatory network inference analysis |
| Find out the significant the regulons (TFs) and the target genes of each regulon across cell types for different disease states |
| TF | Cell Type | Tissue | Disease Stage | Target Gene | RSS | Regulon Activity |
| ∗The dot plots of a searched regulon are shown for all cell subpopulations in each disease state of each tissue based on the regulon specific score inferred using pySCENIC and by calculating the average expression. |
| Page: 1 |
Top |
Somatic mutation of malignant transformation related genes |
| Annotation of somatic variants for genes involved in malignant transformation |
| Hugo Symbol | Variant Class | Variant Classification | dbSNP RS | HGVSc | HGVSp | HGVSp Short | SWISSPROT | BIOTYPE | SIFT | PolyPhen | Tumor Sample Barcode | Tissue | Histology | Sex | Age | Stage | Therapy Types | Drugs | Outcome |
| UQCC2 | SNV | Missense_Mutation | c.103G>T | p.Val35Leu | p.V35L | Q9BRT2 | protein_coding | deleterious(0.03) | probably_damaging(0.99) | TCGA-A2-A25D-01 | Breast | breast invasive carcinoma | Female | >=65 | III/IV | Hormone Therapy | tamoxiphen | SD | |
| UQCC2 | SNV | Missense_Mutation | rs531733294 | c.182N>T | p.Ala61Val | p.A61V | Q9BRT2 | protein_coding | tolerated(0.37) | benign(0.104) | TCGA-AZ-4313-01 | Colorectum | colon adenocarcinoma | Female | <65 | I/II | Unknown | Unknown | SD |
| UQCC2 | SNV | Missense_Mutation | c.221N>A | p.Arg74His | p.R74H | Q9BRT2 | protein_coding | tolerated(0.05) | benign(0.061) | TCGA-AZ-6598-01 | Colorectum | colon adenocarcinoma | Female | >=65 | I/II | Unknown | Unknown | SD | |
| UQCC2 | SNV | Missense_Mutation | novel | c.200N>G | p.Tyr67Cys | p.Y67C | Q9BRT2 | protein_coding | deleterious(0.01) | probably_damaging(0.964) | TCGA-AG-A00Y-01 | Colorectum | rectum adenocarcinoma | Male | >=65 | I/II | Unknown | Unknown | PD |
| UQCC2 | SNV | Missense_Mutation | novel | c.173N>G | p.Glu58Gly | p.E58G | Q9BRT2 | protein_coding | deleterious(0.01) | benign(0.053) | TCGA-AG-A02X-01 | Colorectum | rectum adenocarcinoma | Male | >=65 | I/II | Unknown | Unknown | SD |
| UQCC2 | SNV | Missense_Mutation | c.199N>G | p.Tyr67Asp | p.Y67D | Q9BRT2 | protein_coding | deleterious(0.01) | possibly_damaging(0.899) | TCGA-AP-A056-01 | Endometrium | uterine corpus endometrioid carcinoma | Female | <65 | I/II | Unknown | Unknown | SD | |
| UQCC2 | SNV | Missense_Mutation | novel | c.232A>G | p.Thr78Ala | p.T78A | Q9BRT2 | protein_coding | deleterious(0) | probably_damaging(0.911) | TCGA-FI-A2D5-01 | Endometrium | uterine corpus endometrioid carcinoma | Female | <65 | III/IV | Chemotherapy | carboplatinum | PD |
| UQCC2 | SNV | Missense_Mutation | c.60N>C | p.Glu20Asp | p.E20D | Q9BRT2 | protein_coding | tolerated(0.24) | benign(0.275) | TCGA-55-A48Y-01 | Lung | lung adenocarcinoma | Male | >=65 | I/II | Chemotherapy | carboplatin | CR | |
| UQCC2 | SNV | Missense_Mutation | novel | c.255G>T | p.Leu85Phe | p.L85F | Q9BRT2 | protein_coding | deleterious(0.04) | benign(0.203) | TCGA-CN-6010-01 | Oral cavity | head & neck squamous cell carcinoma | Male | <65 | I/II | Chemotherapy | cisplatin | PD |
| Page: 1 |
Top |
Related drugs of malignant transformation related genes |
| Identification of chemicals and drugs interact with genes involved in malignant transfromation |
| (DGIdb 4.0) |
| Entrez ID | Symbol | Category | Interaction Types | Drug Claim Name | Drug Name | PMIDs |
| Page: 1 |

Copyright 2023-Present -The University of Texas Health Science Center at Houston |