
|
|||||
|
 | |
| |
| |
| |
| |
| |
|
Gene: UPB1 |
Gene summary for UPB1 |
| Gene information | Species | Human | Gene symbol | UPB1 | Gene ID | 51733 |
| Gene name | beta-ureidopropionase 1 | |
| Gene Alias | BUP1 | |
| Cytomap | 22q11.23 | |
| Gene Type | protein-coding | GO ID | GO:0006082 | UniProtAcc | A0A024R1H3 |
Top |
Malignant transformation analysis |
| Identification of the aberrant gene expression in precancerous and cancerous lesions by comparing the gene expression of stem-like cells in diseased tissues with normal stem cells |
| Entrez ID | Symbol | Replicates | Species | Organ | Tissue | Adj P-value | Log2FC | Malignancy |
| 51733 | UPB1 | NAFLD1 | Human | Liver | NAFLD | 1.58e-03 | 7.52e-01 | -0.04 |
| 51733 | UPB1 | S41 | Human | Liver | Cirrhotic | 1.75e-02 | 4.77e-01 | -0.0343 |
| 51733 | UPB1 | S43 | Human | Liver | Cirrhotic | 4.24e-06 | -1.33e-01 | -0.0187 |
| 51733 | UPB1 | HCC1_Meng | Human | Liver | HCC | 1.56e-36 | -2.17e-02 | 0.0246 |
| 51733 | UPB1 | HCC2_Meng | Human | Liver | HCC | 2.71e-04 | -1.84e-01 | 0.0107 |
| 51733 | UPB1 | cirrhotic1 | Human | Liver | Cirrhotic | 2.35e-05 | -1.65e-01 | 0.0202 |
| 51733 | UPB1 | cirrhotic2 | Human | Liver | Cirrhotic | 2.41e-04 | -1.75e-01 | 0.0201 |
| 51733 | UPB1 | HCC2 | Human | Liver | HCC | 7.37e-10 | 2.76e+00 | 0.5341 |
| 51733 | UPB1 | S029 | Human | Liver | HCC | 2.05e-07 | 6.08e-01 | 0.2581 |
| Page: 1 |
| Tissue | Expression Dynamics | Abbreviation |
| Liver | 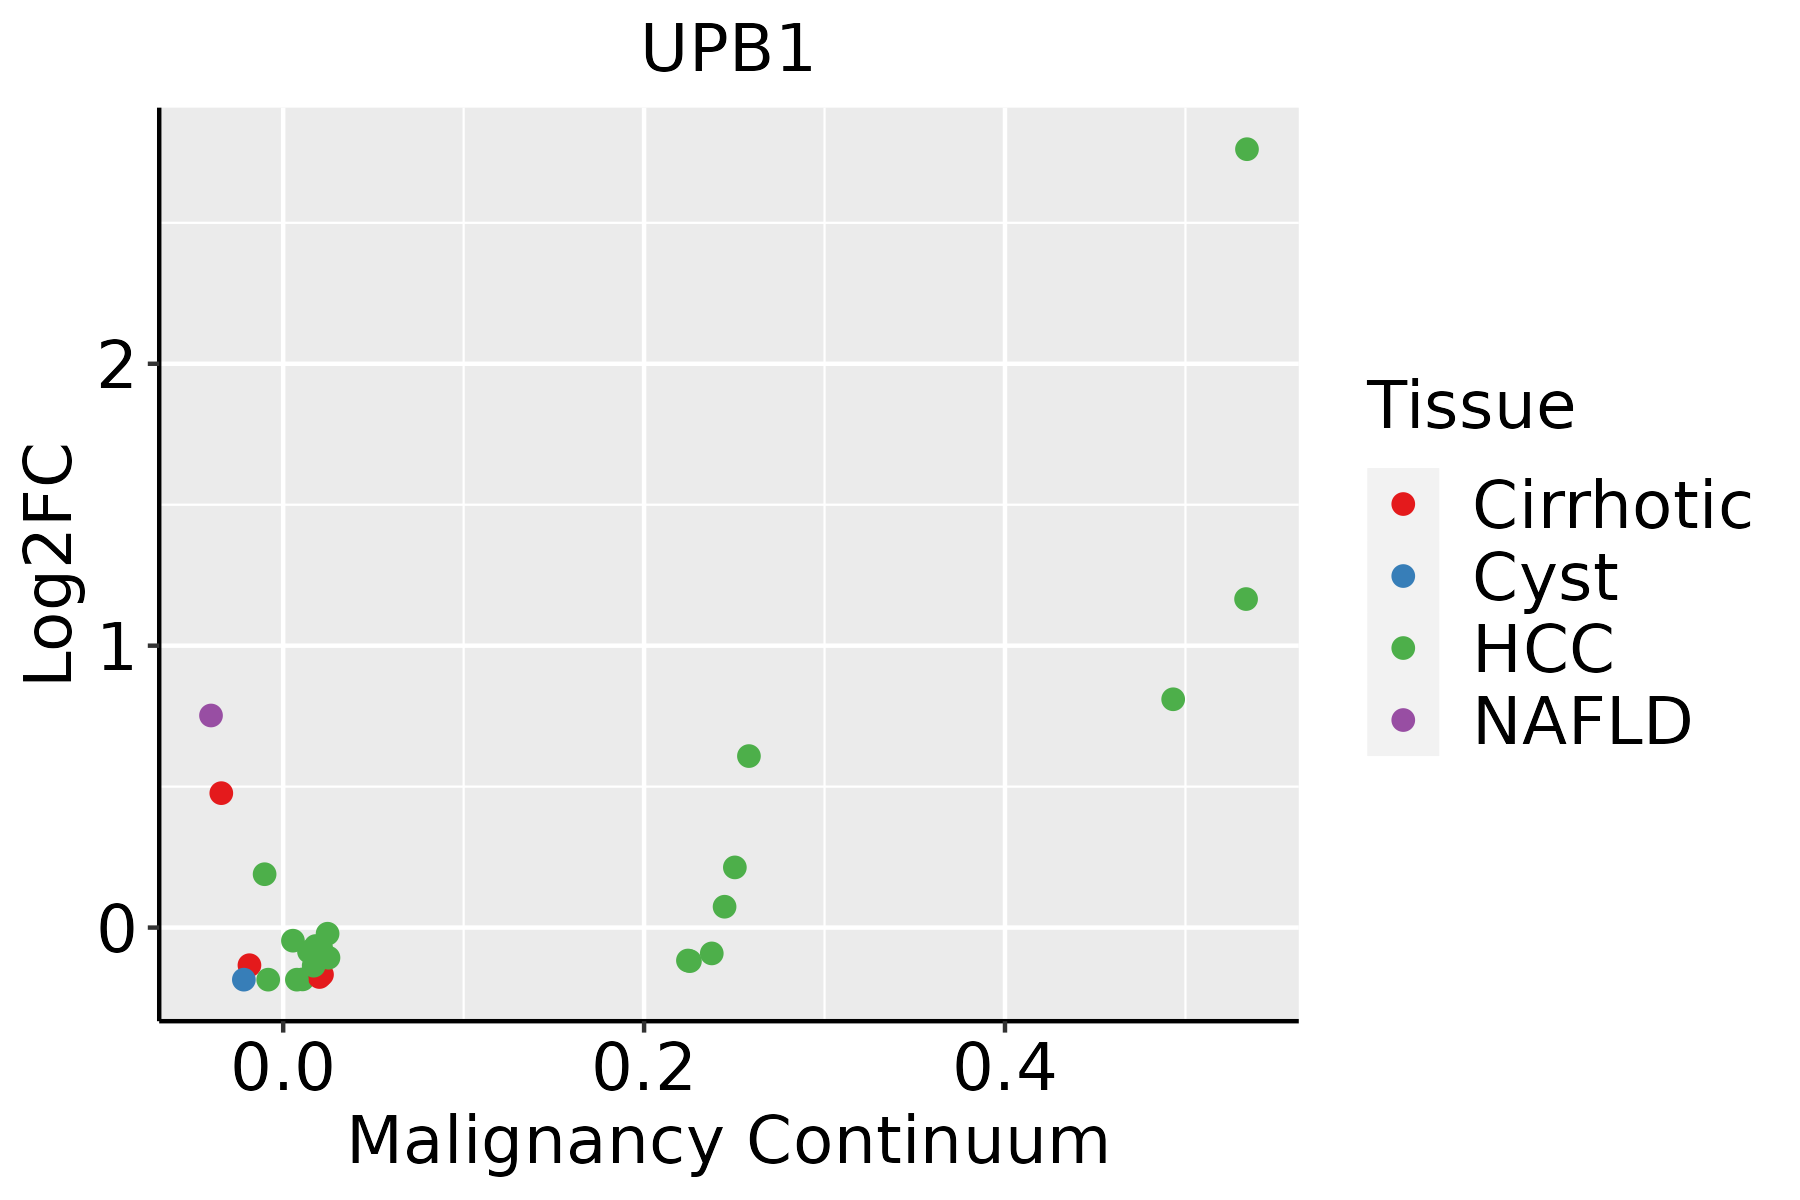 | HCC: Hepatocellular carcinoma |
| NAFLD: Non-alcoholic fatty liver disease |
| ∗log2FC in expression of this searched gene in stem-like cells from each diseased tissue sample relative to stem-like cells in normal samples in each tissue plotted against the malignancy continuum. Samples are colored based on if they are from different disease stage. |
Top |
Malignant transformation related pathway analysis |
| Find out the enriched GO biological processes and KEGG pathways involved in transition from healthy to precancer to cancer |
| Tissue | Disease Stage | Enriched GO biological Processes |
| Colorectum | AD |  |
| Colorectum | SER |  |
| Colorectum | MSS |  |
| Colorectum | MSI-H |  |
| Colorectum | FAP |  |
| ∗Top 15 enriched GO BP terms are showed in the bar plot of each disease state in each tissue. Each row represents a significant GO biological process which is colored according to the -log10(p.adjust). |
| Page: 1 2 3 4 5 6 7 8 9 |
| GO ID | Tissue | Disease Stage | Description | Gene Ratio | Bg Ratio | pvalue | p.adjust | Count |
| GO:00442825 | Liver | NAFLD | small molecule catabolic process | 91/1882 | 376/18723 | 8.96e-16 | 1.31e-12 | 91 |
| GO:00194396 | Liver | NAFLD | aromatic compound catabolic process | 102/1882 | 467/18723 | 2.29e-14 | 1.91e-11 | 102 |
| GO:19013616 | Liver | NAFLD | organic cyclic compound catabolic process | 105/1882 | 495/18723 | 7.04e-14 | 5.15e-11 | 105 |
| GO:00160535 | Liver | NAFLD | organic acid biosynthetic process | 77/1882 | 316/18723 | 1.03e-13 | 6.69e-11 | 77 |
| GO:00463945 | Liver | NAFLD | carboxylic acid biosynthetic process | 75/1882 | 314/18723 | 6.37e-13 | 3.39e-10 | 75 |
| GO:00442707 | Liver | NAFLD | cellular nitrogen compound catabolic process | 93/1882 | 451/18723 | 1.04e-11 | 4.34e-09 | 93 |
| GO:00467006 | Liver | NAFLD | heterocycle catabolic process | 92/1882 | 445/18723 | 1.16e-11 | 4.52e-09 | 92 |
| GO:00065203 | Liver | NAFLD | cellular amino acid metabolic process | 63/1882 | 284/18723 | 1.14e-09 | 2.17e-07 | 63 |
| GO:00346556 | Liver | NAFLD | nucleobase-containing compound catabolic process | 80/1882 | 407/18723 | 3.07e-09 | 4.61e-07 | 80 |
| GO:00086523 | Liver | NAFLD | cellular amino acid biosynthetic process | 26/1882 | 76/18723 | 1.00e-08 | 1.33e-06 | 26 |
| GO:00092596 | Liver | NAFLD | ribonucleotide metabolic process | 72/1882 | 385/18723 | 1.51e-07 | 1.09e-05 | 72 |
| GO:00196936 | Liver | NAFLD | ribose phosphate metabolic process | 73/1882 | 396/18723 | 2.23e-07 | 1.53e-05 | 73 |
| GO:00091177 | Liver | NAFLD | nucleotide metabolic process | 85/1882 | 489/18723 | 3.31e-07 | 2.18e-05 | 85 |
| GO:00067537 | Liver | NAFLD | nucleoside phosphate metabolic process | 85/1882 | 497/18723 | 6.69e-07 | 3.83e-05 | 85 |
| GO:0009158 | Liver | NAFLD | ribonucleoside monophosphate catabolic process | 6/1882 | 14/18723 | 1.51e-03 | 1.64e-02 | 6 |
| GO:0046434 | Liver | NAFLD | organophosphate catabolic process | 27/1882 | 155/18723 | 3.21e-03 | 2.86e-02 | 27 |
| GO:00091613 | Liver | NAFLD | ribonucleoside monophosphate metabolic process | 13/1882 | 58/18723 | 4.32e-03 | 3.55e-02 | 13 |
| GO:0009125 | Liver | NAFLD | nucleoside monophosphate catabolic process | 6/1882 | 18/18723 | 6.55e-03 | 4.69e-02 | 6 |
| GO:190136111 | Liver | Cirrhotic | organic cyclic compound catabolic process | 213/4634 | 495/18723 | 1.58e-19 | 3.67e-17 | 213 |
| GO:001943911 | Liver | Cirrhotic | aromatic compound catabolic process | 202/4634 | 467/18723 | 6.93e-19 | 1.28e-16 | 202 |
| Page: 1 2 3 4 5 |
| Pathway ID | Tissue | Disease Stage | Description | Gene Ratio | Bg Ratio | pvalue | p.adjust | qvalue | Count |
| hsa00410 | Liver | Cirrhotic | beta-Alanine metabolism | 18/2530 | 31/8465 | 1.00e-03 | 5.57e-03 | 3.43e-03 | 18 |
| hsa00770 | Liver | Cirrhotic | Pantothenate and CoA biosynthesis | 13/2530 | 21/8465 | 2.32e-03 | 9.90e-03 | 6.10e-03 | 13 |
| hsa00240 | Liver | Cirrhotic | Pyrimidine metabolism | 27/2530 | 58/8465 | 5.31e-03 | 1.88e-02 | 1.16e-02 | 27 |
| hsa00983 | Liver | Cirrhotic | Drug metabolism - other enzymes | 34/2530 | 80/8465 | 1.08e-02 | 3.57e-02 | 2.20e-02 | 34 |
| hsa004101 | Liver | Cirrhotic | beta-Alanine metabolism | 18/2530 | 31/8465 | 1.00e-03 | 5.57e-03 | 3.43e-03 | 18 |
| hsa007701 | Liver | Cirrhotic | Pantothenate and CoA biosynthesis | 13/2530 | 21/8465 | 2.32e-03 | 9.90e-03 | 6.10e-03 | 13 |
| hsa002401 | Liver | Cirrhotic | Pyrimidine metabolism | 27/2530 | 58/8465 | 5.31e-03 | 1.88e-02 | 1.16e-02 | 27 |
| hsa009831 | Liver | Cirrhotic | Drug metabolism - other enzymes | 34/2530 | 80/8465 | 1.08e-02 | 3.57e-02 | 2.20e-02 | 34 |
| hsa002402 | Liver | HCC | Pyrimidine metabolism | 44/4020 | 58/8465 | 9.34e-06 | 7.11e-05 | 3.95e-05 | 44 |
| hsa009832 | Liver | HCC | Drug metabolism - other enzymes | 54/4020 | 80/8465 | 2.25e-04 | 1.09e-03 | 6.08e-04 | 54 |
| hsa004102 | Liver | HCC | beta-Alanine metabolism | 22/4020 | 31/8465 | 6.93e-03 | 1.92e-02 | 1.07e-02 | 22 |
| hsa007702 | Liver | HCC | Pantothenate and CoA biosynthesis | 16/4020 | 21/8465 | 7.16e-03 | 1.97e-02 | 1.09e-02 | 16 |
| hsa002403 | Liver | HCC | Pyrimidine metabolism | 44/4020 | 58/8465 | 9.34e-06 | 7.11e-05 | 3.95e-05 | 44 |
| hsa009833 | Liver | HCC | Drug metabolism - other enzymes | 54/4020 | 80/8465 | 2.25e-04 | 1.09e-03 | 6.08e-04 | 54 |
| hsa004103 | Liver | HCC | beta-Alanine metabolism | 22/4020 | 31/8465 | 6.93e-03 | 1.92e-02 | 1.07e-02 | 22 |
| hsa007703 | Liver | HCC | Pantothenate and CoA biosynthesis | 16/4020 | 21/8465 | 7.16e-03 | 1.97e-02 | 1.09e-02 | 16 |
| Page: 1 |
Top |
Cell-cell communication analysis |
| Identification of potential cell-cell interactions between two cell types and their ligand-receptor pairs for different disease states |
| Ligand | Receptor | LRpair | Pathway | Tissue | Disease Stage |
| Page: 1 |
Top |
Single-cell gene regulatory network inference analysis |
| Find out the significant the regulons (TFs) and the target genes of each regulon across cell types for different disease states |
| TF | Cell Type | Tissue | Disease Stage | Target Gene | RSS | Regulon Activity |
| ∗The dot plots of a searched regulon are shown for all cell subpopulations in each disease state of each tissue based on the regulon specific score inferred using pySCENIC and by calculating the average expression. |
| Page: 1 |
Top |
Somatic mutation of malignant transformation related genes |
| Annotation of somatic variants for genes involved in malignant transformation |
| Hugo Symbol | Variant Class | Variant Classification | dbSNP RS | HGVSc | HGVSp | HGVSp Short | SWISSPROT | BIOTYPE | SIFT | PolyPhen | Tumor Sample Barcode | Tissue | Histology | Sex | Age | Stage | Therapy Types | Drugs | Outcome |
| UPB1 | SNV | Missense_Mutation | c.685G>A | p.Ala229Thr | p.A229T | Q9UBR1 | protein_coding | deleterious(0) | probably_damaging(0.972) | TCGA-AN-A0AK-01 | Breast | breast invasive carcinoma | Female | >=65 | I/II | Unknown | Unknown | SD | |
| UPB1 | insertion | Frame_Shift_Ins | novel | c.880_881insCCGTC | p.Phe294SerfsTer47 | p.F294Sfs*47 | Q9UBR1 | protein_coding | TCGA-A8-A07J-01 | Breast | breast invasive carcinoma | Female | <65 | I/II | Chemotherapy | 5-fluorouracil | CR | ||
| UPB1 | insertion | Frame_Shift_Ins | novel | c.531_532insAATCA | p.Trp178AsnfsTer8 | p.W178Nfs*8 | Q9UBR1 | protein_coding | TCGA-BH-A0HK-01 | Breast | breast invasive carcinoma | Female | >=65 | I/II | Hormone Therapy | arimidex | SD | ||
| UPB1 | deletion | In_Frame_Del | novel | c.810_821delNNNNNNNNNNNN | p.Glu271_Asn274del | p.E271_N274del | Q9UBR1 | protein_coding | TCGA-OL-A5RW-01 | Breast | breast invasive carcinoma | Female | <65 | I/II | Chemotherapy | adriamycin | CR | ||
| UPB1 | SNV | Missense_Mutation | c.907N>A | p.Gly303Arg | p.G303R | Q9UBR1 | protein_coding | deleterious(0) | probably_damaging(0.987) | TCGA-AA-3510-01 | Colorectum | colon adenocarcinoma | Male | >=65 | I/II | Unknown | Unknown | SD | |
| UPB1 | SNV | Missense_Mutation | rs565810399 | c.253N>A | p.Ala85Thr | p.A85T | Q9UBR1 | protein_coding | tolerated(1) | benign(0.001) | TCGA-AA-3977-01 | Colorectum | colon adenocarcinoma | Male | >=65 | I/II | Unknown | Unknown | SD |
| UPB1 | SNV | Missense_Mutation | rs367569283 | c.1000C>T | p.Arg334Trp | p.R334W | Q9UBR1 | protein_coding | deleterious(0) | possibly_damaging(0.677) | TCGA-G4-6304-01 | Colorectum | colon adenocarcinoma | Female | >=65 | I/II | Chemotherapy | fluorouracil | PD |
| UPB1 | SNV | Missense_Mutation | c.370N>T | p.Pro124Ser | p.P124S | Q9UBR1 | protein_coding | deleterious(0.02) | probably_damaging(0.997) | TCGA-NH-A5IV-01 | Colorectum | colon adenocarcinoma | Female | >=65 | I/II | Unknown | Unknown | SD | |
| UPB1 | SNV | Missense_Mutation | rs143521220 | c.658N>A | p.Val220Met | p.V220M | Q9UBR1 | protein_coding | deleterious(0) | probably_damaging(0.995) | TCGA-EI-6507-01 | Colorectum | rectum adenocarcinoma | Male | <65 | I/II | Unknown | Unknown | SD |
| UPB1 | SNV | Missense_Mutation | novel | c.924N>T | p.Gln308His | p.Q308H | Q9UBR1 | protein_coding | tolerated(0.34) | benign(0) | TCGA-F5-6814-01 | Colorectum | rectum adenocarcinoma | Male | <65 | I/II | Unknown | Unknown | SD |
| Page: 1 2 3 4 5 |
Top |
Related drugs of malignant transformation related genes |
| Identification of chemicals and drugs interact with genes involved in malignant transfromation |
| (DGIdb 4.0) |
| Entrez ID | Symbol | Category | Interaction Types | Drug Claim Name | Drug Name | PMIDs |
| Page: 1 |

Copyright 2023-Present -The University of Texas Health Science Center at Houston |