
|
|||||
|
 | |
| |
| |
| |
| |
| |
|
Gene: UNKL |
Gene summary for UNKL |
| Gene information | Species | Human | Gene symbol | UNKL | Gene ID | 64718 |
| Gene name | unk like zinc finger | |
| Gene Alias | C16orf28 | |
| Cytomap | 16p13.3 | |
| Gene Type | protein-coding | GO ID | GO:0006464 | UniProtAcc | Q9H9P5 |
Top |
Malignant transformation analysis |
| Identification of the aberrant gene expression in precancerous and cancerous lesions by comparing the gene expression of stem-like cells in diseased tissues with normal stem cells |
| Entrez ID | Symbol | Replicates | Species | Organ | Tissue | Adj P-value | Log2FC | Malignancy |
| 64718 | UNKL | LZE2T | Human | Esophagus | ESCC | 5.07e-08 | 6.56e-01 | 0.082 |
| 64718 | UNKL | LZE7T | Human | Esophagus | ESCC | 8.01e-07 | 1.92e-01 | 0.0667 |
| 64718 | UNKL | LZE24T | Human | Esophagus | ESCC | 1.92e-08 | 1.59e-01 | 0.0596 |
| 64718 | UNKL | P1T-E | Human | Esophagus | ESCC | 3.18e-03 | 1.25e-01 | 0.0875 |
| 64718 | UNKL | P2T-E | Human | Esophagus | ESCC | 7.45e-14 | 3.11e-01 | 0.1177 |
| 64718 | UNKL | P4T-E | Human | Esophagus | ESCC | 6.26e-11 | 2.76e-01 | 0.1323 |
| 64718 | UNKL | P5T-E | Human | Esophagus | ESCC | 6.48e-04 | 5.73e-02 | 0.1327 |
| 64718 | UNKL | P8T-E | Human | Esophagus | ESCC | 5.20e-05 | 9.12e-02 | 0.0889 |
| 64718 | UNKL | P10T-E | Human | Esophagus | ESCC | 9.37e-10 | 1.14e-01 | 0.116 |
| 64718 | UNKL | P11T-E | Human | Esophagus | ESCC | 3.21e-05 | 2.26e-01 | 0.1426 |
| 64718 | UNKL | P12T-E | Human | Esophagus | ESCC | 1.65e-07 | 1.86e-01 | 0.1122 |
| 64718 | UNKL | P15T-E | Human | Esophagus | ESCC | 2.23e-17 | 2.66e-01 | 0.1149 |
| 64718 | UNKL | P16T-E | Human | Esophagus | ESCC | 5.00e-05 | 1.11e-01 | 0.1153 |
| 64718 | UNKL | P20T-E | Human | Esophagus | ESCC | 7.24e-04 | 9.41e-02 | 0.1124 |
| 64718 | UNKL | P21T-E | Human | Esophagus | ESCC | 6.09e-12 | 2.12e-01 | 0.1617 |
| 64718 | UNKL | P22T-E | Human | Esophagus | ESCC | 6.03e-03 | 4.54e-02 | 0.1236 |
| 64718 | UNKL | P23T-E | Human | Esophagus | ESCC | 2.37e-05 | 1.09e-01 | 0.108 |
| 64718 | UNKL | P24T-E | Human | Esophagus | ESCC | 1.00e-02 | 4.23e-02 | 0.1287 |
| 64718 | UNKL | P26T-E | Human | Esophagus | ESCC | 3.79e-10 | 1.05e-01 | 0.1276 |
| 64718 | UNKL | P27T-E | Human | Esophagus | ESCC | 2.34e-09 | 9.55e-02 | 0.1055 |
| Page: 1 2 3 4 |
| Tissue | Expression Dynamics | Abbreviation |
| Esophagus | 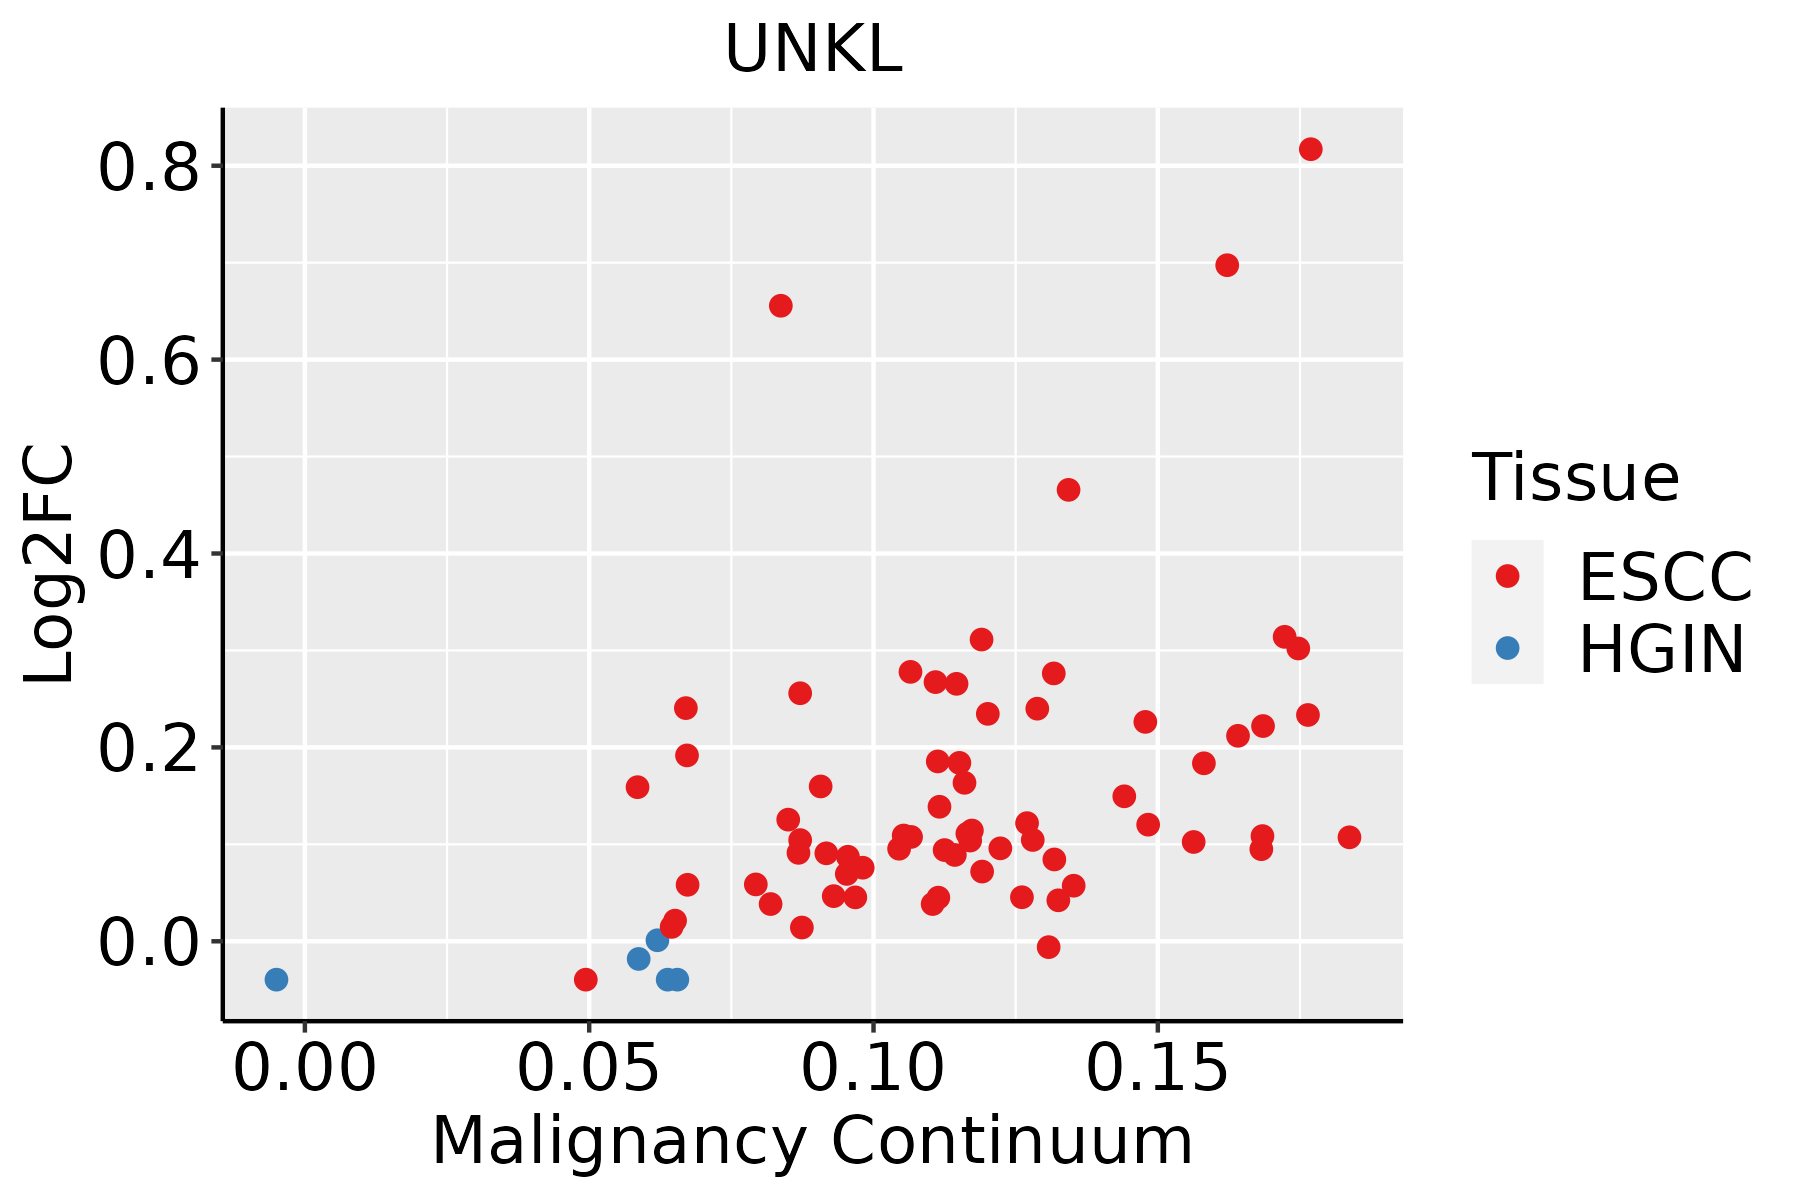 | ESCC: Esophageal squamous cell carcinoma |
| HGIN: High-grade intraepithelial neoplasias | ||
| LGIN: Low-grade intraepithelial neoplasias | ||
| Liver | 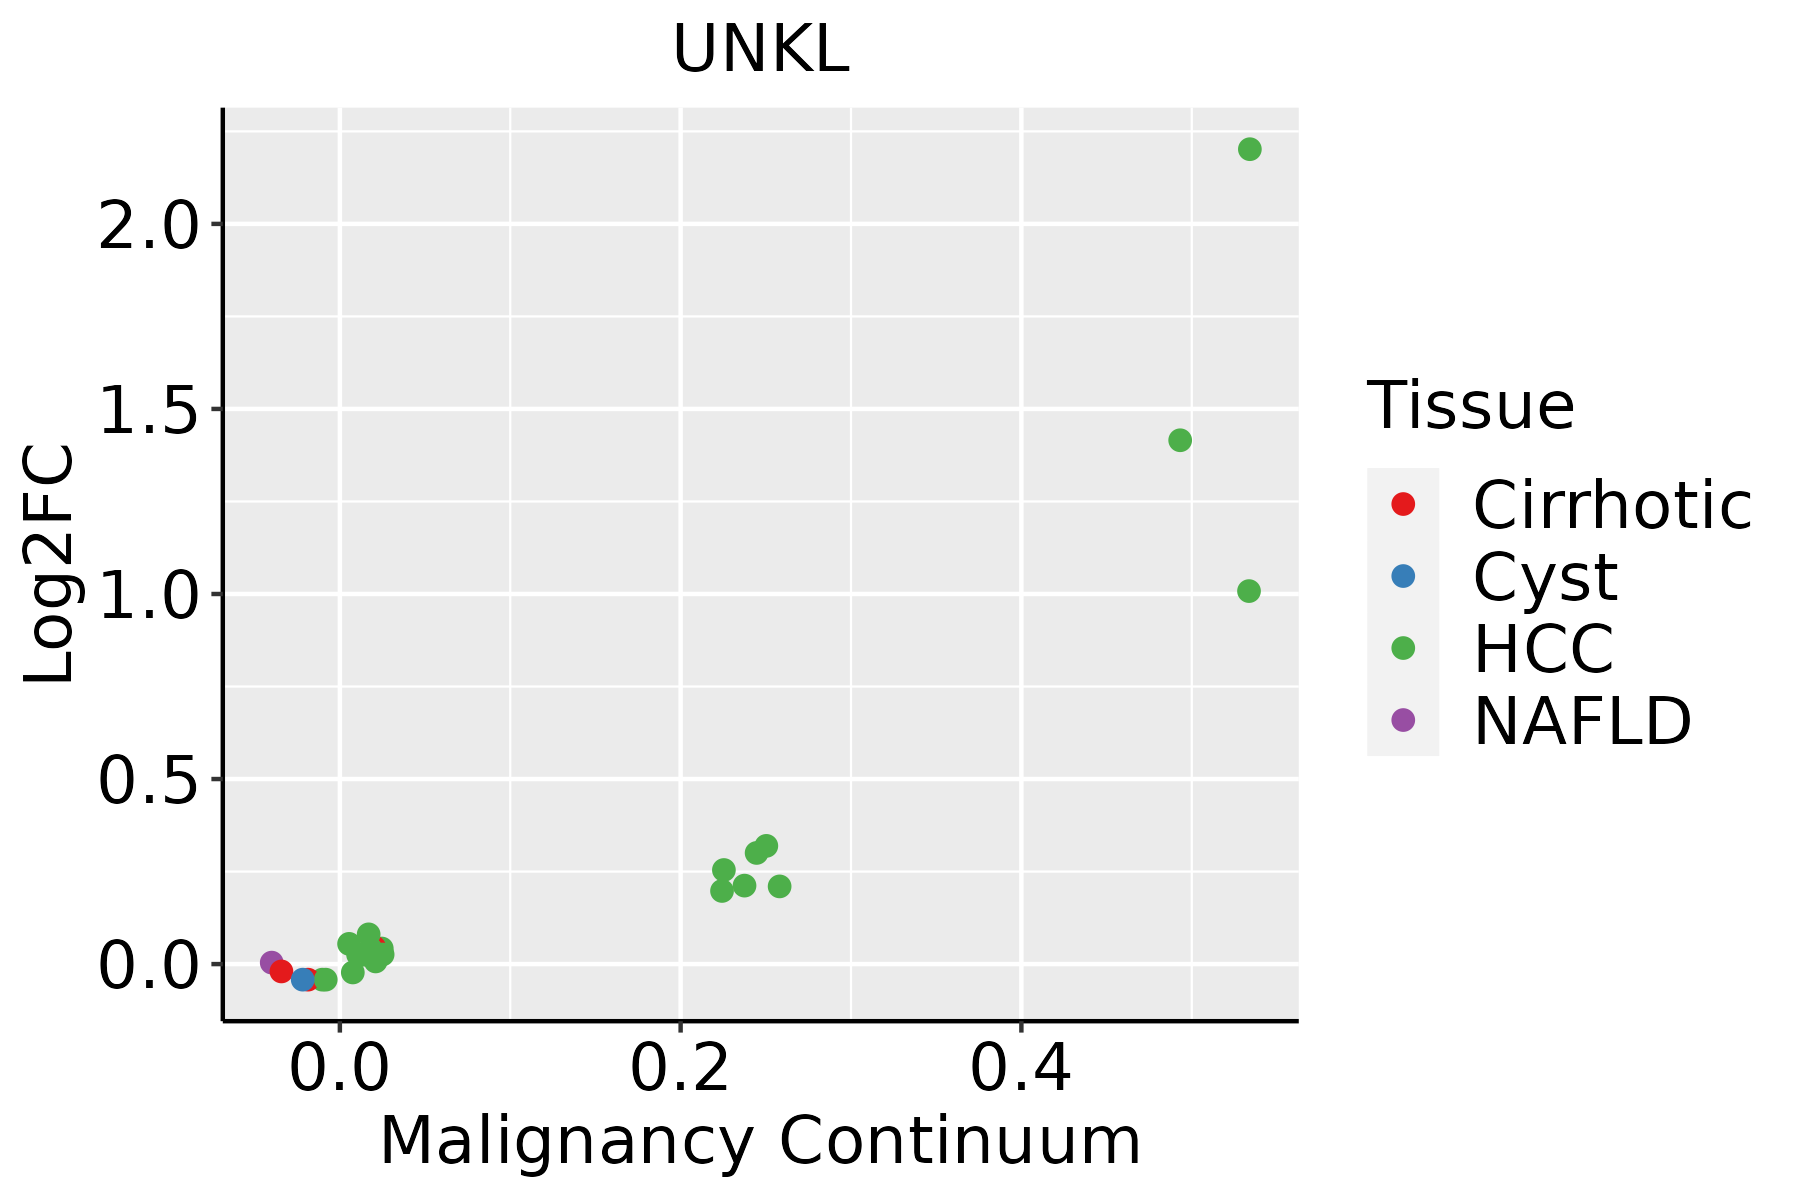 | HCC: Hepatocellular carcinoma |
| NAFLD: Non-alcoholic fatty liver disease | ||
| Oral Cavity | 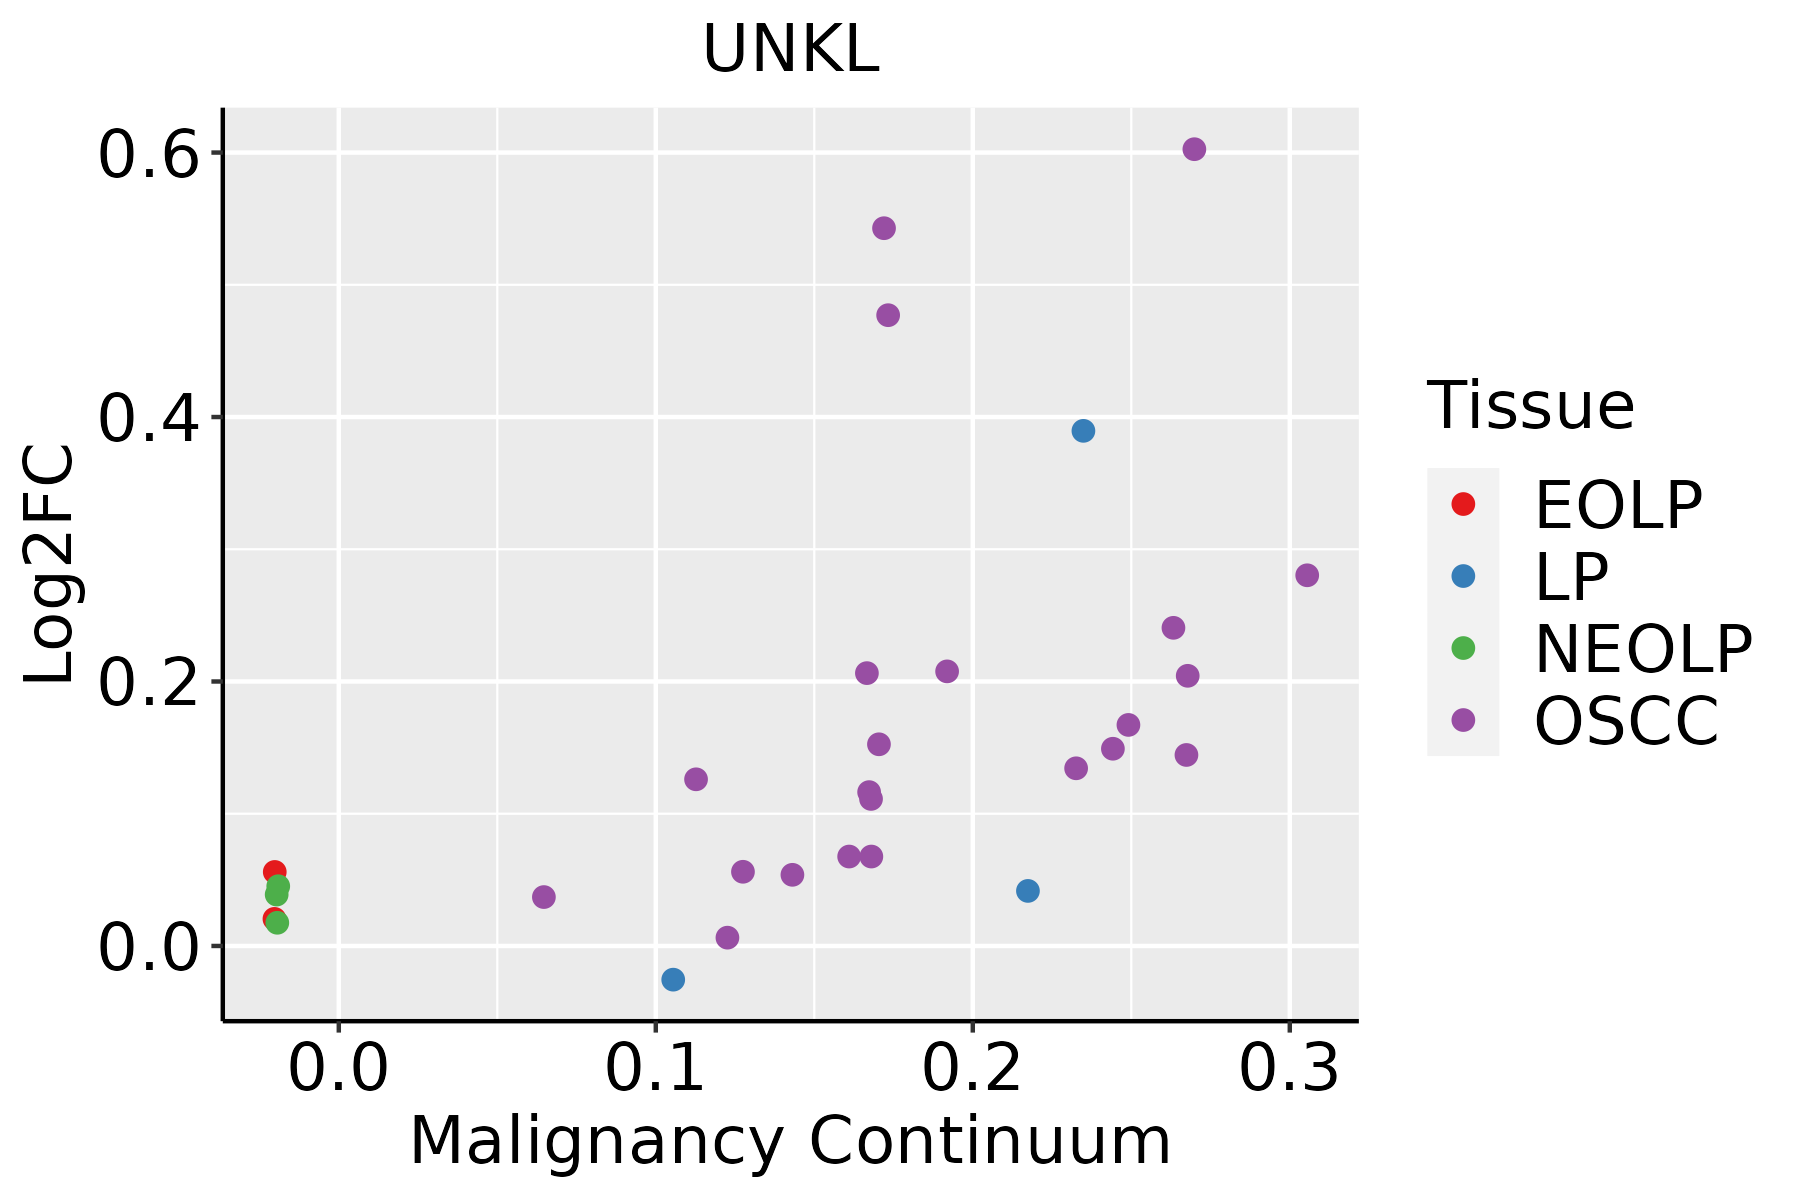 | EOLP: Erosive Oral lichen planus |
| LP: leukoplakia | ||
| NEOLP: Non-erosive oral lichen planus | ||
| OSCC: Oral squamous cell carcinoma |
| ∗log2FC in expression of this searched gene in stem-like cells from each diseased tissue sample relative to stem-like cells in normal samples in each tissue plotted against the malignancy continuum. Samples are colored based on if they are from different disease stage. |
Top |
Malignant transformation related pathway analysis |
| Find out the enriched GO biological processes and KEGG pathways involved in transition from healthy to precancer to cancer |
| Tissue | Disease Stage | Enriched GO biological Processes |
| Colorectum | AD |  |
| Colorectum | SER |  |
| Colorectum | MSS |  |
| Colorectum | MSI-H |  |
| Colorectum | FAP |  |
| ∗Top 15 enriched GO BP terms are showed in the bar plot of each disease state in each tissue. Each row represents a significant GO biological process which is colored according to the -log10(p.adjust). |
| Page: 1 2 3 4 5 6 7 8 9 |
| GO ID | Tissue | Disease Stage | Description | Gene Ratio | Bg Ratio | pvalue | p.adjust | Count |
| Page: 1 |
| Pathway ID | Tissue | Disease Stage | Description | Gene Ratio | Bg Ratio | pvalue | p.adjust | qvalue | Count |
| Page: 1 |
Top |
Cell-cell communication analysis |
| Identification of potential cell-cell interactions between two cell types and their ligand-receptor pairs for different disease states |
| Ligand | Receptor | LRpair | Pathway | Tissue | Disease Stage |
| Page: 1 |
Top |
Single-cell gene regulatory network inference analysis |
| Find out the significant the regulons (TFs) and the target genes of each regulon across cell types for different disease states |
| TF | Cell Type | Tissue | Disease Stage | Target Gene | RSS | Regulon Activity |
| ∗The dot plots of a searched regulon are shown for all cell subpopulations in each disease state of each tissue based on the regulon specific score inferred using pySCENIC and by calculating the average expression. |
| Page: 1 |
Top |
Somatic mutation of malignant transformation related genes |
| Annotation of somatic variants for genes involved in malignant transformation |
| Hugo Symbol | Variant Class | Variant Classification | dbSNP RS | HGVSc | HGVSp | HGVSp Short | SWISSPROT | BIOTYPE | SIFT | PolyPhen | Tumor Sample Barcode | Tissue | Histology | Sex | Age | Stage | Therapy Types | Drugs | Outcome |
| UNKL | SNV | Missense_Mutation | novel | c.534N>C | p.Gln178His | p.Q178H | Q9H9P5 | protein_coding | deleterious_low_confidence(0) | benign(0.03) | TCGA-C8-A1HM-01 | Breast | breast invasive carcinoma | Female | >=65 | I/II | Chemotherapy | doxorubicin | CR |
| UNKL | SNV | Missense_Mutation | novel | c.814G>A | p.Gly272Arg | p.G272R | Q9H9P5 | protein_coding | probably_damaging(0.979) | TCGA-C5-A8YQ-01 | Cervix | cervical & endocervical cancer | Female | >=65 | I/II | Chemotherapy | cisplatin | PD | |
| UNKL | SNV | Missense_Mutation | c.569N>C | p.Lys190Thr | p.K190T | Q9H9P5 | protein_coding | tolerated_low_confidence(0.07) | benign(0.09) | TCGA-A6-6653-01 | Colorectum | colon adenocarcinoma | Male | >=65 | I/II | Unknown | Unknown | SD | |
| UNKL | SNV | Missense_Mutation | c.1579C>A | p.Pro527Thr | p.P527T | protein_coding | tolerated(0.05) | benign(0.024) | TCGA-A6-6780-01 | Colorectum | colon adenocarcinoma | Male | >=65 | I/II | Unknown | Unknown | SD | ||
| UNKL | SNV | Missense_Mutation | rs574875280 | c.524C>T | p.Pro175Leu | p.P175L | Q9H9P5 | protein_coding | tolerated_low_confidence(0.22) | benign(0.149) | TCGA-CK-4951-01 | Colorectum | colon adenocarcinoma | Female | >=65 | I/II | Unknown | Unknown | PD |
| UNKL | SNV | Missense_Mutation | c.340N>T | p.Arg114Cys | p.R114C | Q9H9P5 | protein_coding | deleterious(0) | probably_damaging(1) | TCGA-G4-6304-01 | Colorectum | colon adenocarcinoma | Female | >=65 | I/II | Chemotherapy | fluorouracil | PD | |
| UNKL | SNV | Missense_Mutation | c.428N>A | p.Gly143Asp | p.G143D | Q9H9P5 | protein_coding | deleterious(0) | probably_damaging(0.996) | TCGA-AG-A02N-01 | Colorectum | rectum adenocarcinoma | Male | >=65 | I/II | Chemotherapy | folinic | CR | |
| UNKL | SNV | Missense_Mutation | novel | c.1546N>A | p.Gly516Ser | p.G516S | protein_coding | tolerated(0.67) | benign(0.058) | TCGA-A5-A2K3-01 | Endometrium | uterine corpus endometrioid carcinoma | Female | >=65 | I/II | Chemotherapy | carboplatin | SD | |
| UNKL | SNV | Missense_Mutation | novel | c.535N>T | p.Pro179Ser | p.P179S | Q9H9P5 | protein_coding | tolerated_low_confidence(0.3) | benign(0.042) | TCGA-A5-A7WJ-01 | Endometrium | uterine corpus endometrioid carcinoma | Female | <65 | I/II | Unknown | Unknown | SD |
| UNKL | SNV | Missense_Mutation | c.409N>T | p.His137Tyr | p.H137Y | Q9H9P5 | protein_coding | tolerated(0.12) | possibly_damaging(0.879) | TCGA-AP-A1DP-01 | Endometrium | uterine corpus endometrioid carcinoma | Female | >=65 | I/II | Chemotherapy | paclitaxel | PD |
| Page: 1 2 3 4 |
Top |
Related drugs of malignant transformation related genes |
| Identification of chemicals and drugs interact with genes involved in malignant transfromation |
| (DGIdb 4.0) |
| Entrez ID | Symbol | Category | Interaction Types | Drug Claim Name | Drug Name | PMIDs |
| Page: 1 |

Copyright 2023-Present -The University of Texas Health Science Center at Houston |