
|
|||||
|
 | |
| |
| |
| |
| |
| |
|
Gene: UNK |
Gene summary for UNK |
| Gene information | Species | Human | Gene symbol | UNK | Gene ID | 85451 |
| Gene name | unk zinc finger | |
| Gene Alias | UNKEMPT | |
| Cytomap | 17q25.1 | |
| Gene Type | protein-coding | GO ID | GO:0000902 | UniProtAcc | A0A024R8N4 |
Top |
Malignant transformation analysis |
| Identification of the aberrant gene expression in precancerous and cancerous lesions by comparing the gene expression of stem-like cells in diseased tissues with normal stem cells |
| Entrez ID | Symbol | Replicates | Species | Organ | Tissue | Adj P-value | Log2FC | Malignancy |
| 85451 | UNK | LZE4T | Human | Esophagus | ESCC | 2.04e-04 | 1.04e-01 | 0.0811 |
| 85451 | UNK | LZE7T | Human | Esophagus | ESCC | 1.98e-05 | 2.29e-01 | 0.0667 |
| 85451 | UNK | LZE8T | Human | Esophagus | ESCC | 3.23e-02 | 8.38e-02 | 0.067 |
| 85451 | UNK | LZE20T | Human | Esophagus | ESCC | 1.28e-02 | 1.16e-01 | 0.0662 |
| 85451 | UNK | LZE22T | Human | Esophagus | ESCC | 1.39e-04 | 2.98e-01 | 0.068 |
| 85451 | UNK | LZE24T | Human | Esophagus | ESCC | 1.74e-06 | 2.41e-01 | 0.0596 |
| 85451 | UNK | P2T-E | Human | Esophagus | ESCC | 2.49e-22 | 3.76e-01 | 0.1177 |
| 85451 | UNK | P4T-E | Human | Esophagus | ESCC | 5.40e-03 | 1.05e-01 | 0.1323 |
| 85451 | UNK | P5T-E | Human | Esophagus | ESCC | 4.69e-02 | 3.24e-02 | 0.1327 |
| 85451 | UNK | P8T-E | Human | Esophagus | ESCC | 6.13e-28 | 5.03e-01 | 0.0889 |
| 85451 | UNK | P9T-E | Human | Esophagus | ESCC | 1.50e-11 | 1.84e-01 | 0.1131 |
| 85451 | UNK | P10T-E | Human | Esophagus | ESCC | 1.31e-31 | 4.75e-01 | 0.116 |
| 85451 | UNK | P11T-E | Human | Esophagus | ESCC | 3.60e-10 | 4.77e-01 | 0.1426 |
| 85451 | UNK | P12T-E | Human | Esophagus | ESCC | 1.43e-19 | 3.82e-01 | 0.1122 |
| 85451 | UNK | P15T-E | Human | Esophagus | ESCC | 4.45e-17 | 2.52e-01 | 0.1149 |
| 85451 | UNK | P16T-E | Human | Esophagus | ESCC | 8.21e-21 | 3.41e-01 | 0.1153 |
| 85451 | UNK | P20T-E | Human | Esophagus | ESCC | 9.34e-22 | 4.81e-01 | 0.1124 |
| 85451 | UNK | P21T-E | Human | Esophagus | ESCC | 1.89e-11 | 2.68e-01 | 0.1617 |
| 85451 | UNK | P22T-E | Human | Esophagus | ESCC | 8.18e-22 | 3.13e-01 | 0.1236 |
| 85451 | UNK | P23T-E | Human | Esophagus | ESCC | 3.88e-07 | 1.84e-01 | 0.108 |
| Page: 1 2 3 4 |
| Tissue | Expression Dynamics | Abbreviation |
| Esophagus | 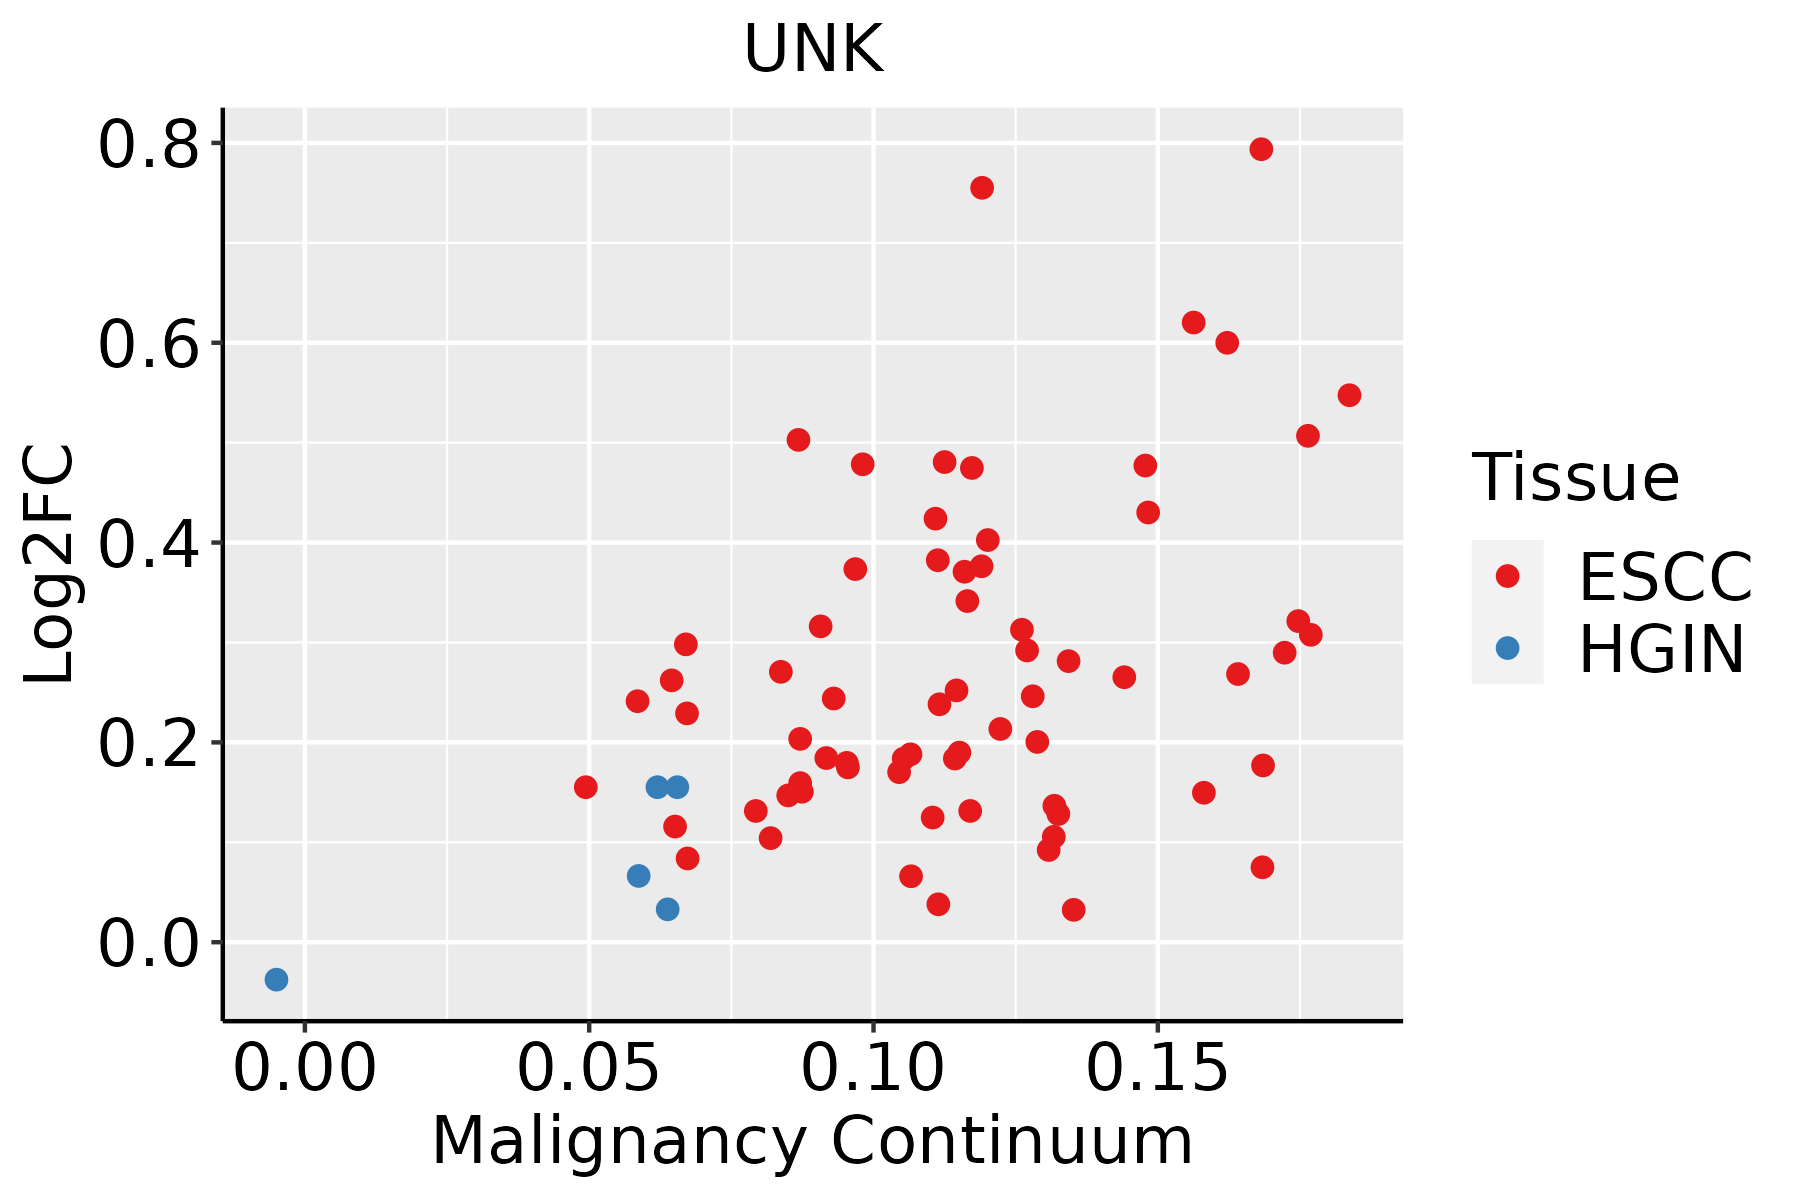 | ESCC: Esophageal squamous cell carcinoma |
| HGIN: High-grade intraepithelial neoplasias | ||
| LGIN: Low-grade intraepithelial neoplasias | ||
| Oral Cavity | 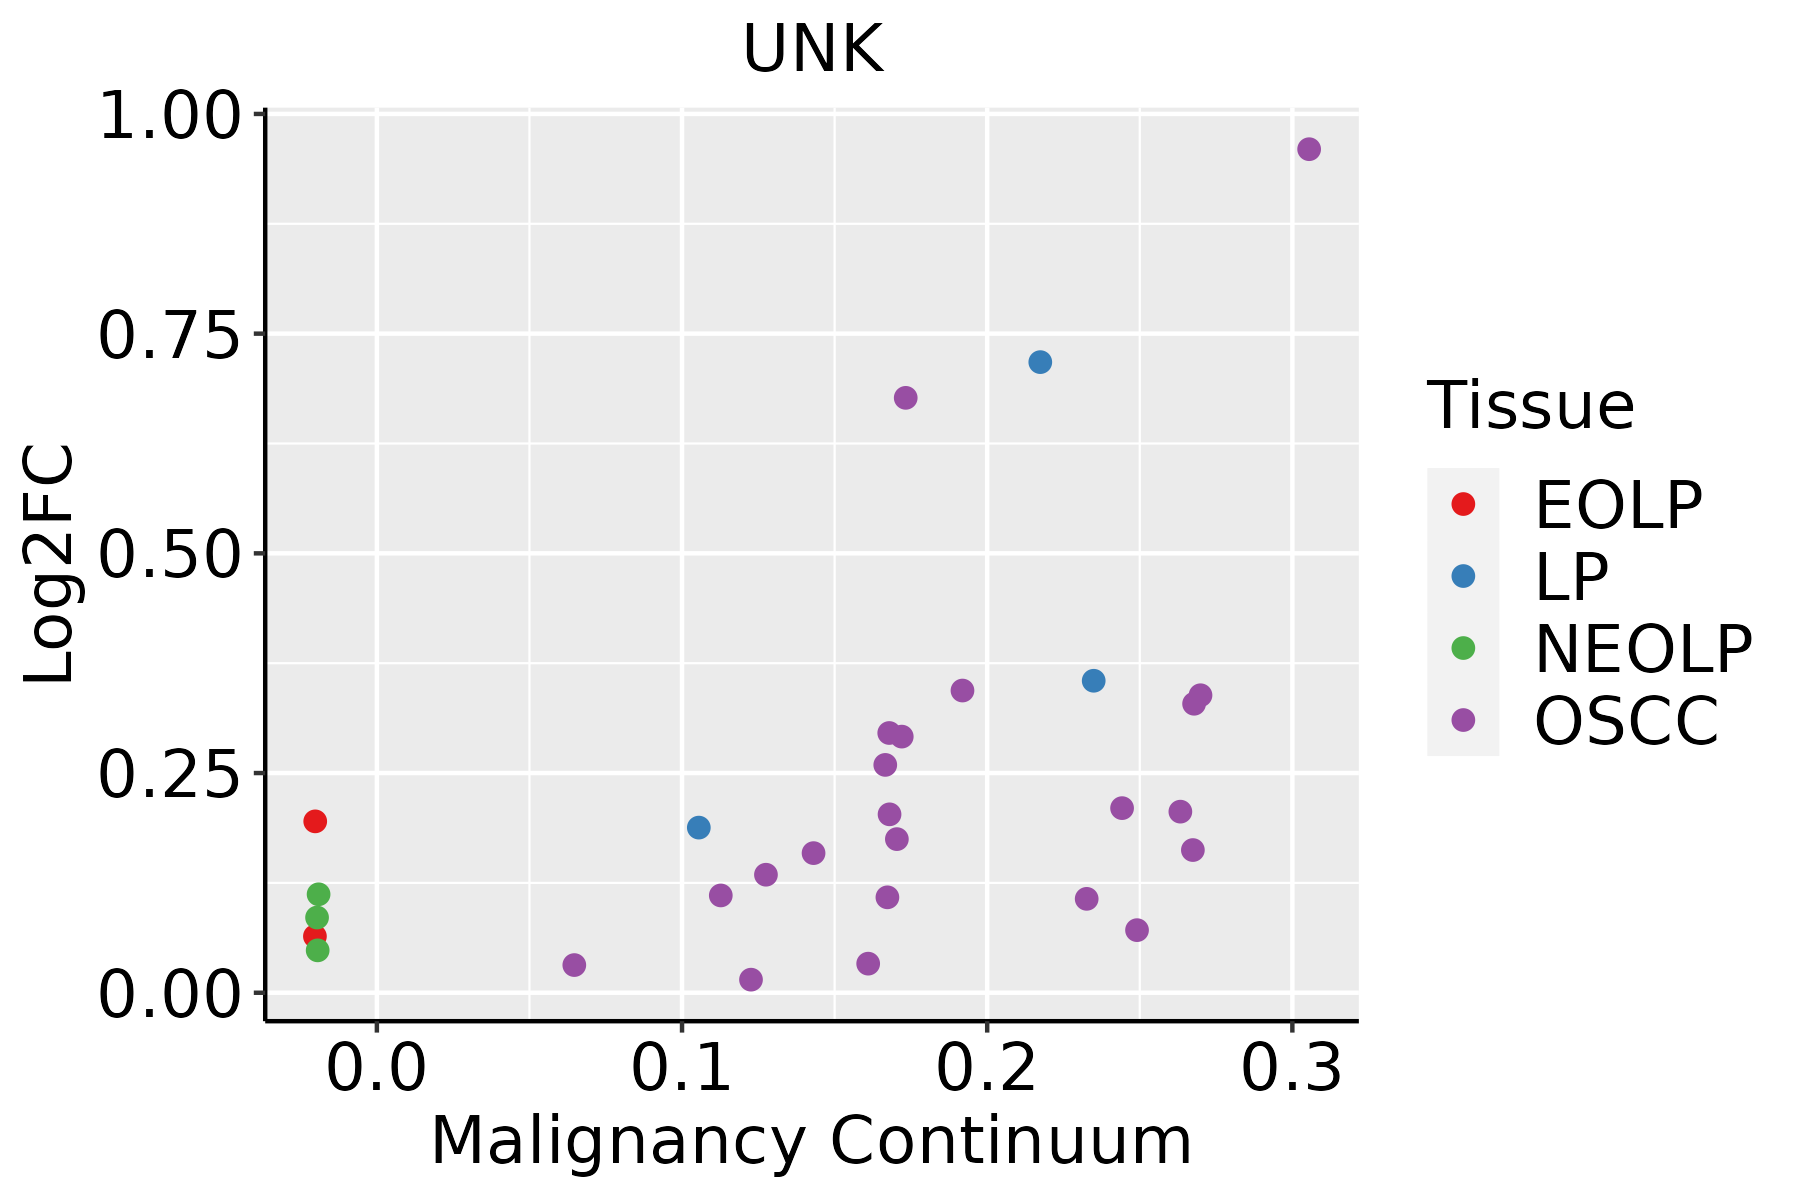 | EOLP: Erosive Oral lichen planus |
| LP: leukoplakia | ||
| NEOLP: Non-erosive oral lichen planus | ||
| OSCC: Oral squamous cell carcinoma |
| ∗log2FC in expression of this searched gene in stem-like cells from each diseased tissue sample relative to stem-like cells in normal samples in each tissue plotted against the malignancy continuum. Samples are colored based on if they are from different disease stage. |
Top |
Malignant transformation related pathway analysis |
| Find out the enriched GO biological processes and KEGG pathways involved in transition from healthy to precancer to cancer |
| Tissue | Disease Stage | Enriched GO biological Processes |
| Colorectum | AD |  |
| Colorectum | SER |  |
| Colorectum | MSS |  |
| Colorectum | MSI-H |  |
| Colorectum | FAP |  |
| ∗Top 15 enriched GO BP terms are showed in the bar plot of each disease state in each tissue. Each row represents a significant GO biological process which is colored according to the -log10(p.adjust). |
| Page: 1 2 3 4 5 6 7 8 9 |
| GO ID | Tissue | Disease Stage | Description | Gene Ratio | Bg Ratio | pvalue | p.adjust | Count |
| GO:0002181111 | Esophagus | ESCC | cytoplasmic translation | 135/8552 | 148/18723 | 4.17e-32 | 2.65e-29 | 135 |
| GO:0006417111 | Esophagus | ESCC | regulation of translation | 304/8552 | 468/18723 | 1.53e-17 | 1.33e-15 | 304 |
| GO:000170119 | Esophagus | ESCC | in utero embryonic development | 243/8552 | 367/18723 | 1.00e-15 | 6.86e-14 | 243 |
| GO:003424914 | Esophagus | ESCC | negative regulation of cellular amide metabolic process | 144/8552 | 273/18723 | 1.08e-02 | 3.67e-02 | 144 |
| GO:000218120 | Oral cavity | OSCC | cytoplasmic translation | 133/7305 | 148/18723 | 1.94e-38 | 2.46e-35 | 133 |
| GO:000641720 | Oral cavity | OSCC | regulation of translation | 274/7305 | 468/18723 | 4.39e-18 | 4.63e-16 | 274 |
| GO:000170116 | Oral cavity | OSCC | in utero embryonic development | 207/7305 | 367/18723 | 7.92e-12 | 2.95e-10 | 207 |
| GO:00342495 | Oral cavity | OSCC | negative regulation of cellular amide metabolic process | 130/7305 | 273/18723 | 2.20e-03 | 1.00e-02 | 130 |
| GO:00171485 | Oral cavity | OSCC | negative regulation of translation | 113/7305 | 245/18723 | 1.34e-02 | 4.45e-02 | 113 |
| GO:0002181110 | Oral cavity | LP | cytoplasmic translation | 124/4623 | 148/18723 | 5.09e-52 | 3.19e-48 | 124 |
| GO:0006417110 | Oral cavity | LP | regulation of translation | 175/4623 | 468/18723 | 4.49e-10 | 2.22e-08 | 175 |
| GO:000170117 | Oral cavity | LP | in utero embryonic development | 142/4623 | 367/18723 | 1.48e-09 | 6.75e-08 | 142 |
| GO:000218126 | Oral cavity | EOLP | cytoplasmic translation | 102/2218 | 148/18723 | 7.91e-60 | 4.74e-56 | 102 |
| GO:000641726 | Oral cavity | EOLP | regulation of translation | 108/2218 | 468/18723 | 4.04e-12 | 7.34e-10 | 108 |
| GO:001714813 | Oral cavity | EOLP | negative regulation of translation | 54/2218 | 245/18723 | 4.15e-06 | 8.72e-05 | 54 |
| GO:003424913 | Oral cavity | EOLP | negative regulation of cellular amide metabolic process | 58/2218 | 273/18723 | 6.23e-06 | 1.22e-04 | 58 |
| GO:000170123 | Oral cavity | EOLP | in utero embryonic development | 72/2218 | 367/18723 | 1.02e-05 | 1.83e-04 | 72 |
| GO:20007653 | Oral cavity | EOLP | regulation of cytoplasmic translation | 7/2218 | 16/18723 | 1.40e-03 | 9.58e-03 | 7 |
| Page: 1 |
| Pathway ID | Tissue | Disease Stage | Description | Gene Ratio | Bg Ratio | pvalue | p.adjust | qvalue | Count |
| Page: 1 |
Top |
Cell-cell communication analysis |
| Identification of potential cell-cell interactions between two cell types and their ligand-receptor pairs for different disease states |
| Ligand | Receptor | LRpair | Pathway | Tissue | Disease Stage |
| Page: 1 |
Top |
Single-cell gene regulatory network inference analysis |
| Find out the significant the regulons (TFs) and the target genes of each regulon across cell types for different disease states |
| TF | Cell Type | Tissue | Disease Stage | Target Gene | RSS | Regulon Activity |
| ∗The dot plots of a searched regulon are shown for all cell subpopulations in each disease state of each tissue based on the regulon specific score inferred using pySCENIC and by calculating the average expression. |
| Page: 1 |
Top |
Somatic mutation of malignant transformation related genes |
| Annotation of somatic variants for genes involved in malignant transformation |
| Hugo Symbol | Variant Class | Variant Classification | dbSNP RS | HGVSc | HGVSp | HGVSp Short | SWISSPROT | BIOTYPE | SIFT | PolyPhen | Tumor Sample Barcode | Tissue | Histology | Sex | Age | Stage | Therapy Types | Drugs | Outcome |
| UNK | SNV | Missense_Mutation | novel | c.2419N>C | p.Thr807Pro | p.T807P | Q9C0B0 | protein_coding | deleterious_low_confidence(0.02) | benign(0) | TCGA-A7-A0DA-01 | Breast | breast invasive carcinoma | Female | <65 | I/II | Chemotherapy | adriamycin | SD |
| UNK | SNV | Missense_Mutation | novel | c.122N>T | p.Arg41Leu | p.R41L | Q9C0B0 | protein_coding | deleterious(0) | probably_damaging(0.993) | TCGA-AC-A3W6-01 | Breast | breast invasive carcinoma | Female | >=65 | III/IV | Unknown | Unknown | SD |
| UNK | SNV | Missense_Mutation | c.350N>C | p.Glu117Ala | p.E117A | Q9C0B0 | protein_coding | deleterious(0) | probably_damaging(0.977) | TCGA-AO-A128-01 | Breast | breast invasive carcinoma | Female | <65 | I/II | Chemotherapy | doxorubicin | SD | |
| UNK | SNV | Missense_Mutation | rs752774700 | c.1966N>A | p.Glu656Lys | p.E656K | Q9C0B0 | protein_coding | deleterious(0.03) | probably_damaging(0.956) | TCGA-D8-A1J8-01 | Breast | breast invasive carcinoma | Female | >=65 | I/II | Hormone Therapy | nolvadex | SD |
| UNK | SNV | Missense_Mutation | novel | c.877N>T | p.Ile293Phe | p.I293F | Q9C0B0 | protein_coding | deleterious(0) | probably_damaging(0.987) | TCGA-LD-A7W6-01 | Breast | breast invasive carcinoma | Female | <65 | I/II | Chemotherapy | letrozole | SD |
| UNK | insertion | Frame_Shift_Ins | novel | c.702_703insC | p.Tyr236LeufsTer30 | p.Y236Lfs*30 | Q9C0B0 | protein_coding | TCGA-AC-A6IW-01 | Breast | breast invasive carcinoma | Female | >=65 | I/II | Unknown | Unknown | SD | ||
| UNK | deletion | Frame_Shift_Del | c.1451delN | p.Pro486LeufsTer12 | p.P486Lfs*12 | Q9C0B0 | protein_coding | TCGA-BH-A18G-01 | Breast | breast invasive carcinoma | Female | >=65 | I/II | Unknown | Unknown | SD | |||
| UNK | deletion | Frame_Shift_Del | novel | c.1523delN | p.Ser508ThrfsTer4 | p.S508Tfs*4 | Q9C0B0 | protein_coding | TCGA-D8-A27V-01 | Breast | breast invasive carcinoma | Female | <65 | I/II | Hormone Therapy | tamoxiphen | SD | ||
| UNK | SNV | Missense_Mutation | novel | c.1082N>T | p.Pro361Leu | p.P361L | Q9C0B0 | protein_coding | tolerated(0.15) | probably_damaging(0.982) | TCGA-2W-A8YY-01 | Cervix | cervical & endocervical cancer | Female | <65 | I/II | Chemotherapy | cisplatin | CR |
| UNK | SNV | Missense_Mutation | c.2143N>A | p.Glu715Lys | p.E715K | Q9C0B0 | protein_coding | tolerated(0.17) | benign(0.431) | TCGA-C5-A1BN-01 | Cervix | cervical & endocervical cancer | Female | <65 | I/II | Chemotherapy | cisplatin | PD |
| Page: 1 2 3 4 5 6 7 8 |
Top |
Related drugs of malignant transformation related genes |
| Identification of chemicals and drugs interact with genes involved in malignant transfromation |
| (DGIdb 4.0) |
| Entrez ID | Symbol | Category | Interaction Types | Drug Claim Name | Drug Name | PMIDs |
| Page: 1 |

Copyright 2023-Present -The University of Texas Health Science Center at Houston |