
|
|||||
|
 | |
| |
| |
| |
| |
| |
|
Gene: UNC93B1 |
Gene summary for UNC93B1 |
| Gene information | Species | Human | Gene symbol | UNC93B1 | Gene ID | 81622 |
| Gene name | unc-93 homolog B1, TLR signaling regulator | |
| Gene Alias | IIAE1 | |
| Cytomap | 11q13.2 | |
| Gene Type | protein-coding | GO ID | GO:0002221 | UniProtAcc | Q9H1C4 |
Top |
Malignant transformation analysis |
| Identification of the aberrant gene expression in precancerous and cancerous lesions by comparing the gene expression of stem-like cells in diseased tissues with normal stem cells |
| Entrez ID | Symbol | Replicates | Species | Organ | Tissue | Adj P-value | Log2FC | Malignancy |
| 81622 | UNC93B1 | LZE5T | Human | Esophagus | ESCC | 4.72e-02 | 2.20e-01 | 0.0514 |
| 81622 | UNC93B1 | LZE20T | Human | Esophagus | ESCC | 4.91e-14 | 5.53e-01 | 0.0662 |
| 81622 | UNC93B1 | LZE22T | Human | Esophagus | ESCC | 9.15e-04 | 5.07e-01 | 0.068 |
| 81622 | UNC93B1 | LZE24T | Human | Esophagus | ESCC | 4.65e-26 | 8.83e-01 | 0.0596 |
| 81622 | UNC93B1 | P1T-E | Human | Esophagus | ESCC | 5.97e-10 | 5.68e-01 | 0.0875 |
| 81622 | UNC93B1 | P2T-E | Human | Esophagus | ESCC | 2.55e-25 | 4.05e-01 | 0.1177 |
| 81622 | UNC93B1 | P4T-E | Human | Esophagus | ESCC | 5.96e-30 | 6.87e-01 | 0.1323 |
| 81622 | UNC93B1 | P5T-E | Human | Esophagus | ESCC | 1.15e-34 | 6.67e-01 | 0.1327 |
| 81622 | UNC93B1 | P8T-E | Human | Esophagus | ESCC | 6.49e-47 | 8.76e-01 | 0.0889 |
| 81622 | UNC93B1 | P9T-E | Human | Esophagus | ESCC | 1.63e-09 | 2.83e-01 | 0.1131 |
| 81622 | UNC93B1 | P10T-E | Human | Esophagus | ESCC | 6.96e-04 | 5.11e-02 | 0.116 |
| 81622 | UNC93B1 | P11T-E | Human | Esophagus | ESCC | 4.28e-18 | 5.07e-01 | 0.1426 |
| 81622 | UNC93B1 | P12T-E | Human | Esophagus | ESCC | 2.84e-10 | 2.08e-01 | 0.1122 |
| 81622 | UNC93B1 | P15T-E | Human | Esophagus | ESCC | 7.12e-33 | 7.36e-01 | 0.1149 |
| 81622 | UNC93B1 | P16T-E | Human | Esophagus | ESCC | 4.16e-04 | 1.17e-01 | 0.1153 |
| 81622 | UNC93B1 | P17T-E | Human | Esophagus | ESCC | 5.57e-07 | 3.41e-01 | 0.1278 |
| 81622 | UNC93B1 | P20T-E | Human | Esophagus | ESCC | 1.26e-12 | 2.76e-01 | 0.1124 |
| 81622 | UNC93B1 | P21T-E | Human | Esophagus | ESCC | 1.47e-22 | 4.32e-01 | 0.1617 |
| 81622 | UNC93B1 | P22T-E | Human | Esophagus | ESCC | 1.28e-37 | 6.95e-01 | 0.1236 |
| 81622 | UNC93B1 | P23T-E | Human | Esophagus | ESCC | 7.10e-29 | 6.46e-01 | 0.108 |
| Page: 1 2 3 4 5 |
| Tissue | Expression Dynamics | Abbreviation |
| Esophagus | 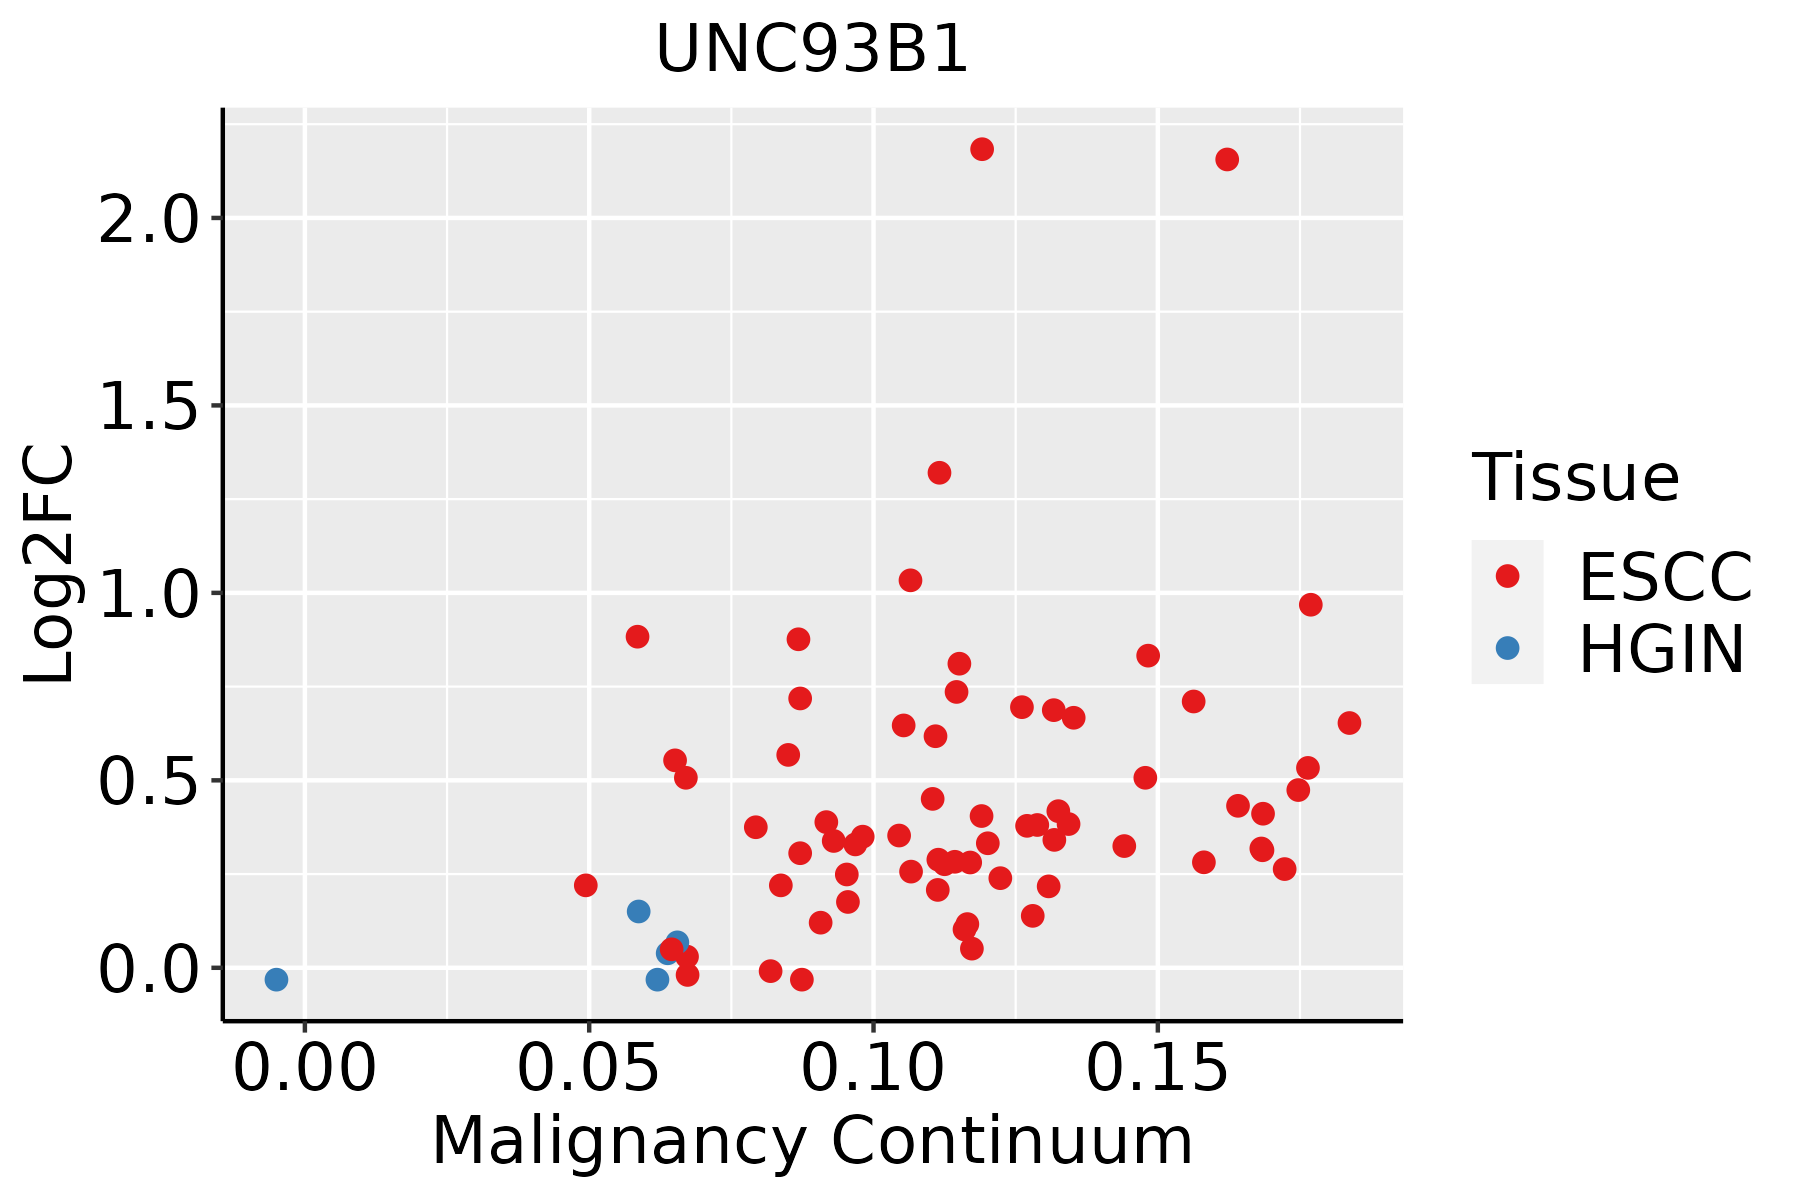 | ESCC: Esophageal squamous cell carcinoma |
| HGIN: High-grade intraepithelial neoplasias | ||
| LGIN: Low-grade intraepithelial neoplasias | ||
| Liver |  | HCC: Hepatocellular carcinoma |
| NAFLD: Non-alcoholic fatty liver disease | ||
| Oral Cavity |  | EOLP: Erosive Oral lichen planus |
| LP: leukoplakia | ||
| NEOLP: Non-erosive oral lichen planus | ||
| OSCC: Oral squamous cell carcinoma | ||
| Thyroid | 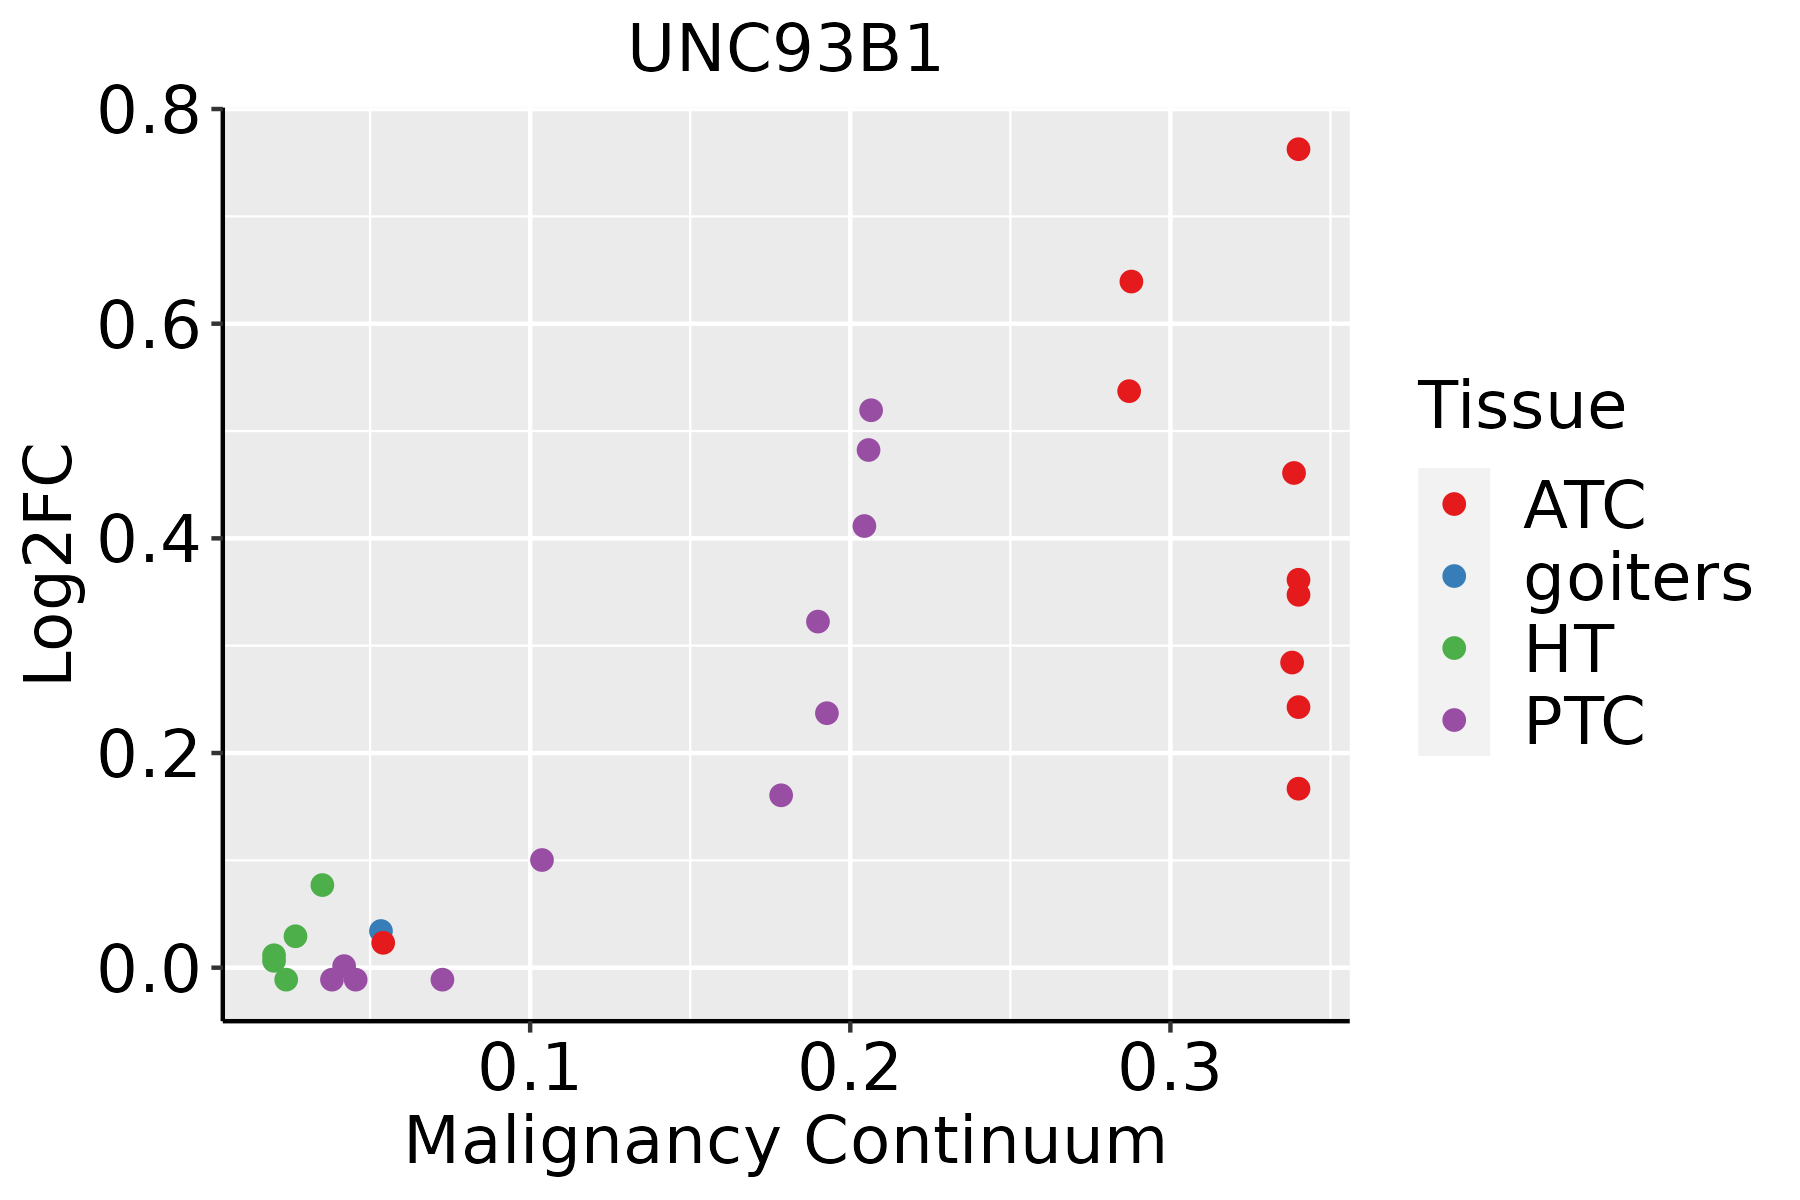 | ATC: Anaplastic thyroid cancer |
| HT: Hashimoto's thyroiditis | ||
| PTC: Papillary thyroid cancer |
| ∗log2FC in expression of this searched gene in stem-like cells from each diseased tissue sample relative to stem-like cells in normal samples in each tissue plotted against the malignancy continuum. Samples are colored based on if they are from different disease stage. |
Top |
Malignant transformation related pathway analysis |
| Find out the enriched GO biological processes and KEGG pathways involved in transition from healthy to precancer to cancer |
| Tissue | Disease Stage | Enriched GO biological Processes |
| Colorectum | AD |  |
| Colorectum | SER |  |
| Colorectum | MSS |  |
| Colorectum | MSI-H |  |
| Colorectum | FAP |  |
| ∗Top 15 enriched GO BP terms are showed in the bar plot of each disease state in each tissue. Each row represents a significant GO biological process which is colored according to the -log10(p.adjust). |
| Page: 1 2 3 4 5 6 7 8 9 |
| GO ID | Tissue | Disease Stage | Description | Gene Ratio | Bg Ratio | pvalue | p.adjust | Count |
| GO:000961518 | Esophagus | ESCC | response to virus | 238/8552 | 367/18723 | 6.65e-14 | 3.32e-12 | 238 |
| GO:00516075 | Esophagus | ESCC | defense response to virus | 171/8552 | 265/18723 | 3.91e-10 | 1.05e-08 | 171 |
| GO:01405465 | Esophagus | ESCC | defense response to symbiont | 171/8552 | 265/18723 | 3.91e-10 | 1.05e-08 | 171 |
| GO:00096155 | Liver | Cirrhotic | response to virus | 126/4634 | 367/18723 | 2.10e-05 | 2.77e-04 | 126 |
| GO:0051607 | Liver | Cirrhotic | defense response to virus | 84/4634 | 265/18723 | 6.02e-03 | 3.00e-02 | 84 |
| GO:0140546 | Liver | Cirrhotic | defense response to symbiont | 84/4634 | 265/18723 | 6.02e-03 | 3.00e-02 | 84 |
| GO:000961511 | Liver | HCC | response to virus | 210/7958 | 367/18723 | 7.32e-09 | 1.86e-07 | 210 |
| GO:00022211 | Liver | HCC | pattern recognition receptor signaling pathway | 107/7958 | 172/18723 | 1.37e-07 | 2.58e-06 | 107 |
| GO:00516071 | Liver | HCC | defense response to virus | 151/7958 | 265/18723 | 1.27e-06 | 1.85e-05 | 151 |
| GO:01405461 | Liver | HCC | defense response to symbiont | 151/7958 | 265/18723 | 1.27e-06 | 1.85e-05 | 151 |
| GO:0002224 | Liver | HCC | toll-like receptor signaling pathway | 67/7958 | 121/18723 | 2.87e-03 | 1.34e-02 | 67 |
| GO:000961515 | Oral cavity | OSCC | response to virus | 215/7305 | 367/18723 | 1.63e-14 | 9.41e-13 | 215 |
| GO:00516074 | Oral cavity | OSCC | defense response to virus | 154/7305 | 265/18723 | 1.96e-10 | 5.63e-09 | 154 |
| GO:01405464 | Oral cavity | OSCC | defense response to symbiont | 154/7305 | 265/18723 | 1.96e-10 | 5.63e-09 | 154 |
| GO:00022214 | Oral cavity | OSCC | pattern recognition receptor signaling pathway | 95/7305 | 172/18723 | 1.11e-05 | 1.15e-04 | 95 |
| GO:00022243 | Oral cavity | OSCC | toll-like receptor signaling pathway | 63/7305 | 121/18723 | 2.36e-03 | 1.04e-02 | 63 |
| GO:00027646 | Oral cavity | OSCC | immune response-regulating signaling pathway | 212/7305 | 468/18723 | 2.93e-03 | 1.27e-02 | 212 |
| GO:000961520 | Thyroid | PTC | response to virus | 162/5968 | 367/18723 | 4.52e-07 | 7.41e-06 | 162 |
| GO:00022215 | Thyroid | PTC | pattern recognition receptor signaling pathway | 77/5968 | 172/18723 | 2.56e-04 | 1.84e-03 | 77 |
| GO:00516077 | Thyroid | PTC | defense response to virus | 108/5968 | 265/18723 | 1.34e-03 | 7.55e-03 | 108 |
| Page: 1 2 |
| Pathway ID | Tissue | Disease Stage | Description | Gene Ratio | Bg Ratio | pvalue | p.adjust | qvalue | Count |
| Page: 1 |
Top |
Cell-cell communication analysis |
| Identification of potential cell-cell interactions between two cell types and their ligand-receptor pairs for different disease states |
| Ligand | Receptor | LRpair | Pathway | Tissue | Disease Stage |
| Page: 1 |
Top |
Single-cell gene regulatory network inference analysis |
| Find out the significant the regulons (TFs) and the target genes of each regulon across cell types for different disease states |
| TF | Cell Type | Tissue | Disease Stage | Target Gene | RSS | Regulon Activity |
| ∗The dot plots of a searched regulon are shown for all cell subpopulations in each disease state of each tissue based on the regulon specific score inferred using pySCENIC and by calculating the average expression. |
| Page: 1 |
Top |
Somatic mutation of malignant transformation related genes |
| Annotation of somatic variants for genes involved in malignant transformation |
| Hugo Symbol | Variant Class | Variant Classification | dbSNP RS | HGVSc | HGVSp | HGVSp Short | SWISSPROT | BIOTYPE | SIFT | PolyPhen | Tumor Sample Barcode | Tissue | Histology | Sex | Age | Stage | Therapy Types | Drugs | Outcome |
| UNC93B1 | SNV | Missense_Mutation | novel | c.286N>A | p.Glu96Lys | p.E96K | Q9H1C4 | protein_coding | deleterious(0.01) | possibly_damaging(0.466) | TCGA-5L-AAT1-01 | Breast | breast invasive carcinoma | Female | <65 | III/IV | Hormone Therapy | letrozol | SD |
| UNC93B1 | SNV | Missense_Mutation | c.1313N>T | p.Ala438Val | p.A438V | Q9H1C4 | protein_coding | tolerated(0.77) | benign(0) | TCGA-A1-A0SH-01 | Breast | breast invasive carcinoma | Female | <65 | I/II | Chemotherapy | tc | SD | |
| UNC93B1 | SNV | Missense_Mutation | rs750571331 | c.1517N>T | p.Ala506Val | p.A506V | Q9H1C4 | protein_coding | tolerated(1) | benign(0) | TCGA-A2-A0CR-01 | Breast | breast invasive carcinoma | Female | <65 | I/II | Chemotherapy | adriamycin | CR |
| UNC93B1 | SNV | Missense_Mutation | c.631G>T | p.Gly211Cys | p.G211C | Q9H1C4 | protein_coding | deleterious(0) | possibly_damaging(0.808) | TCGA-AR-A1AH-01 | Breast | breast invasive carcinoma | Female | <65 | I/II | Unspecific | PD | ||
| UNC93B1 | SNV | Missense_Mutation | novel | c.414N>T | p.Met138Ile | p.M138I | Q9H1C4 | protein_coding | tolerated(0.26) | benign(0.03) | TCGA-BH-A0B6-01 | Breast | breast invasive carcinoma | Female | <65 | I/II | Unknown | Unknown | SD |
| UNC93B1 | SNV | Missense_Mutation | novel | c.935N>C | p.Arg312Pro | p.R312P | Q9H1C4 | protein_coding | deleterious(0.01) | probably_damaging(0.941) | TCGA-GM-A2DF-01 | Breast | breast invasive carcinoma | Female | <65 | I/II | Chemotherapy | taxol | CR |
| UNC93B1 | SNV | Missense_Mutation | novel | c.1675N>A | p.Gly559Ser | p.G559S | Q9H1C4 | protein_coding | tolerated_low_confidence(0.47) | benign(0) | TCGA-2W-A8YY-01 | Cervix | cervical & endocervical cancer | Female | <65 | I/II | Chemotherapy | cisplatin | CR |
| UNC93B1 | SNV | Missense_Mutation | rs750571331 | c.1517N>T | p.Ala506Val | p.A506V | Q9H1C4 | protein_coding | tolerated(1) | benign(0) | TCGA-EA-A5ZF-01 | Cervix | cervical & endocervical cancer | Female | <65 | I/II | Unknown | Unknown | PD |
| UNC93B1 | SNV | Missense_Mutation | rs750571331 | c.1517C>T | p.Ala506Val | p.A506V | Q9H1C4 | protein_coding | tolerated(1) | benign(0) | TCGA-LP-A4AU-01 | Cervix | cervical & endocervical cancer | Female | <65 | III/IV | Chemotherapy | cisplatin | CR |
| UNC93B1 | SNV | Missense_Mutation | novel | c.1157N>T | p.Ala386Val | p.A386V | Q9H1C4 | protein_coding | tolerated(0.27) | benign(0.343) | TCGA-VS-A954-01 | Cervix | cervical & endocervical cancer | Female | >=65 | III/IV | Chemotherapy | cisplatin | CR |
| Page: 1 2 3 4 |
Top |
Related drugs of malignant transformation related genes |
| Identification of chemicals and drugs interact with genes involved in malignant transfromation |
| (DGIdb 4.0) |
| Entrez ID | Symbol | Category | Interaction Types | Drug Claim Name | Drug Name | PMIDs |
| Page: 1 |

Copyright 2023-Present -The University of Texas Health Science Center at Houston |