
|
|||||
|
 | |
| |
| |
| |
| |
| |
|
Gene: UNC5B |
Gene summary for UNC5B |
| Gene information | Species | Human | Gene symbol | UNC5B | Gene ID | 219699 |
| Gene name | unc-5 netrin receptor B | |
| Gene Alias | UNC5H2 | |
| Cytomap | 10q22.1 | |
| Gene Type | protein-coding | GO ID | GO:0000902 | UniProtAcc | Q8IZJ1 |
Top |
Malignant transformation analysis |
| Identification of the aberrant gene expression in precancerous and cancerous lesions by comparing the gene expression of stem-like cells in diseased tissues with normal stem cells |
| Entrez ID | Symbol | Replicates | Species | Organ | Tissue | Adj P-value | Log2FC | Malignancy |
| 219699 | UNC5B | HTA11_2487_2000001011 | Human | Colorectum | SER | 1.52e-05 | 3.33e-01 | -0.1808 |
| 219699 | UNC5B | HTA11_347_2000001011 | Human | Colorectum | AD | 2.66e-09 | 3.80e-01 | -0.1954 |
| 219699 | UNC5B | HTA11_411_2000001011 | Human | Colorectum | SER | 2.25e-03 | 5.85e-01 | -0.2602 |
| 219699 | UNC5B | HTA11_3361_2000001011 | Human | Colorectum | AD | 3.34e-08 | 5.00e-01 | -0.1207 |
| 219699 | UNC5B | HTA11_83_2000001011 | Human | Colorectum | SER | 2.60e-09 | 5.70e-01 | -0.1526 |
| 219699 | UNC5B | HTA11_696_2000001011 | Human | Colorectum | AD | 3.27e-12 | 4.93e-01 | -0.1464 |
| 219699 | UNC5B | HTA11_1391_2000001011 | Human | Colorectum | AD | 1.23e-03 | 2.63e-01 | -0.059 |
| 219699 | UNC5B | HTA11_2992_2000001011 | Human | Colorectum | SER | 5.94e-03 | 5.20e-01 | -0.1706 |
| 219699 | UNC5B | HTA11_5212_2000001011 | Human | Colorectum | AD | 1.36e-06 | 5.22e-01 | -0.2061 |
| 219699 | UNC5B | HTA11_546_2000001011 | Human | Colorectum | AD | 8.85e-05 | 4.97e-01 | -0.0842 |
| 219699 | UNC5B | C04 | Human | Oral cavity | OSCC | 4.76e-05 | 3.23e-01 | 0.2633 |
| 219699 | UNC5B | C30 | Human | Oral cavity | OSCC | 2.43e-06 | 4.85e-01 | 0.3055 |
| 219699 | UNC5B | C38 | Human | Oral cavity | OSCC | 1.88e-05 | 8.92e-01 | 0.172 |
| 219699 | UNC5B | C43 | Human | Oral cavity | OSCC | 4.12e-10 | 2.82e-01 | 0.1704 |
| 219699 | UNC5B | C51 | Human | Oral cavity | OSCC | 1.88e-03 | 3.68e-01 | 0.2674 |
| 219699 | UNC5B | C57 | Human | Oral cavity | OSCC | 5.04e-05 | 2.89e-01 | 0.1679 |
| 219699 | UNC5B | C06 | Human | Oral cavity | OSCC | 9.67e-10 | 1.09e+00 | 0.2699 |
| 219699 | UNC5B | C08 | Human | Oral cavity | OSCC | 1.93e-02 | 1.52e-01 | 0.1919 |
| 219699 | UNC5B | C09 | Human | Oral cavity | OSCC | 1.42e-09 | 2.89e-01 | 0.1431 |
| 219699 | UNC5B | LN38 | Human | Oral cavity | OSCC | 2.79e-09 | 1.19e+00 | 0.168 |
| Page: 1 2 |
| Tissue | Expression Dynamics | Abbreviation |
| Colorectum (GSE201348) |  | FAP: Familial adenomatous polyposis |
| CRC: Colorectal cancer | ||
| Colorectum (HTA11) | 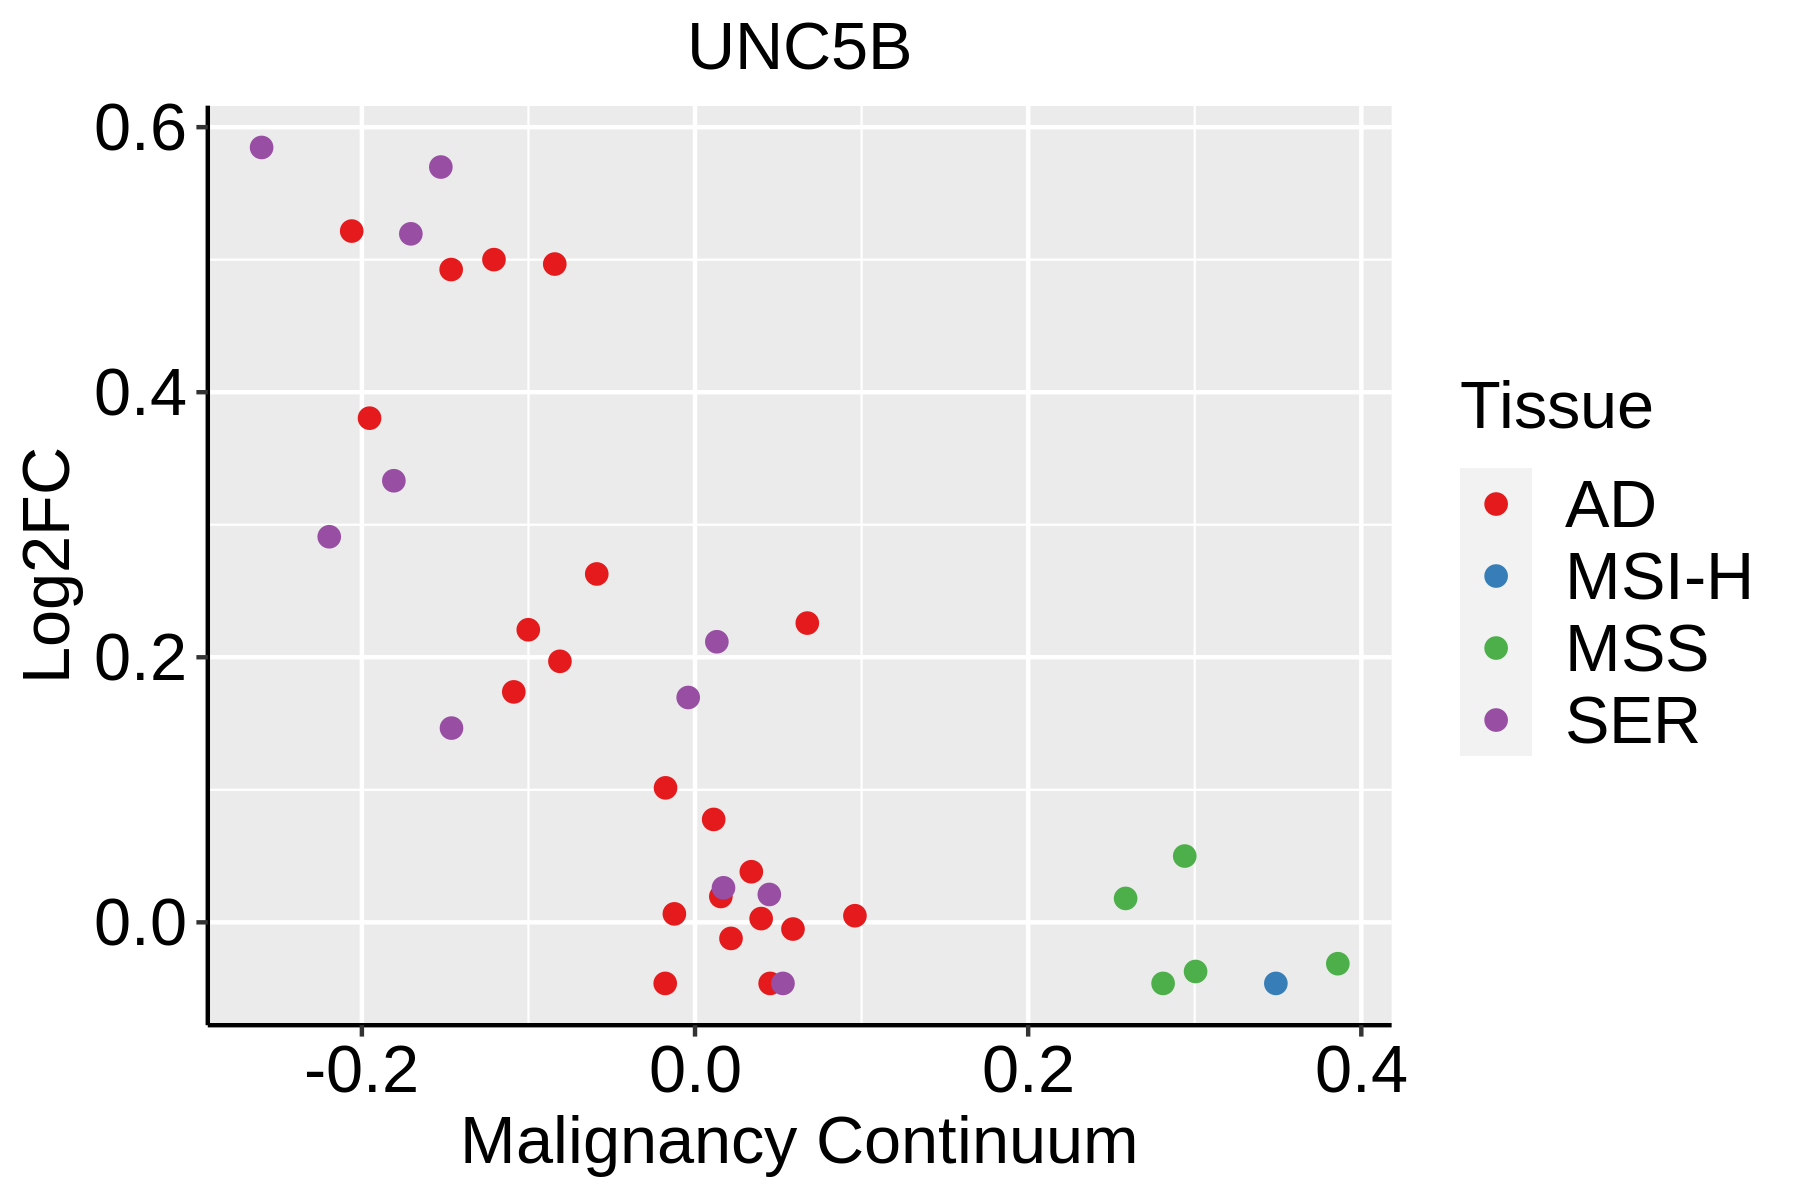 | AD: Adenomas |
| SER: Sessile serrated lesions | ||
| MSI-H: Microsatellite-high colorectal cancer | ||
| MSS: Microsatellite stable colorectal cancer | ||
| Oral Cavity | 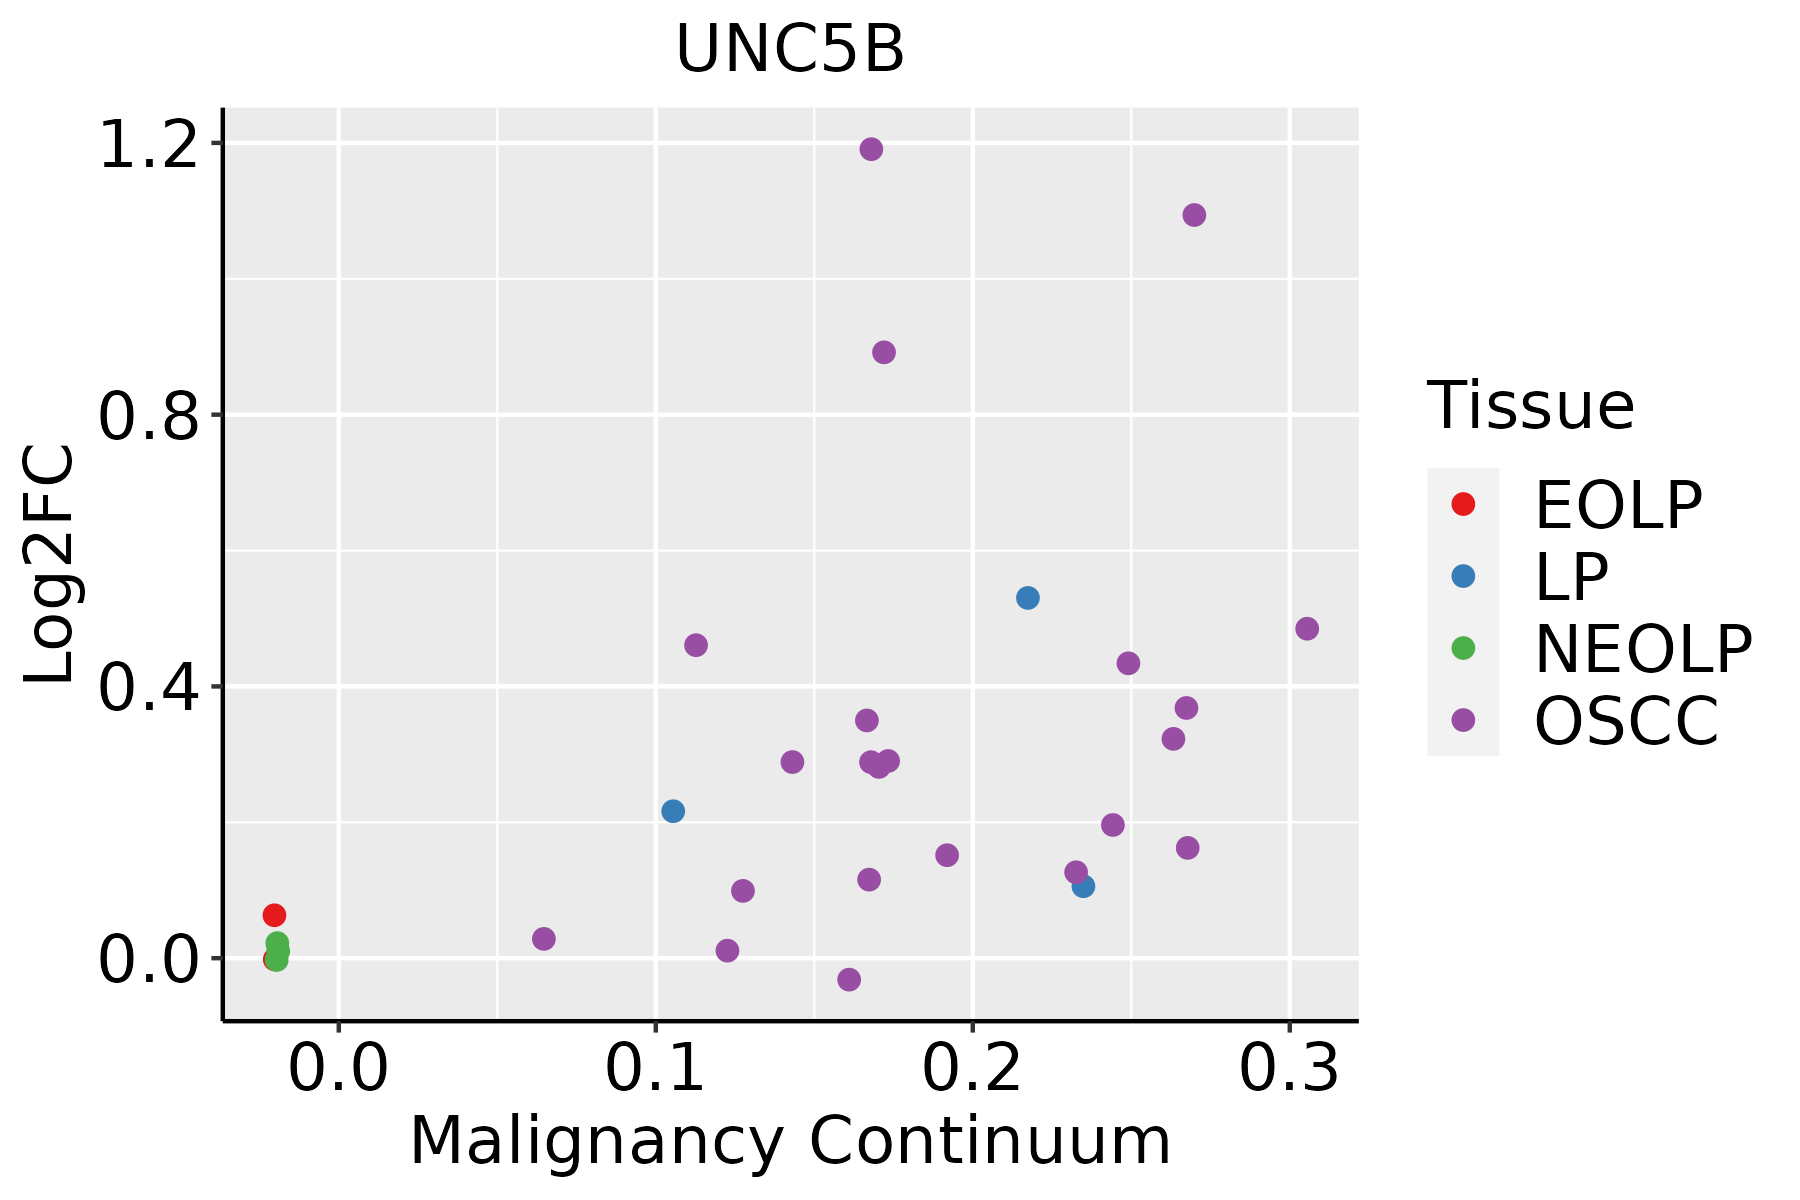 | EOLP: Erosive Oral lichen planus |
| LP: leukoplakia | ||
| NEOLP: Non-erosive oral lichen planus | ||
| OSCC: Oral squamous cell carcinoma | ||
| Thyroid | 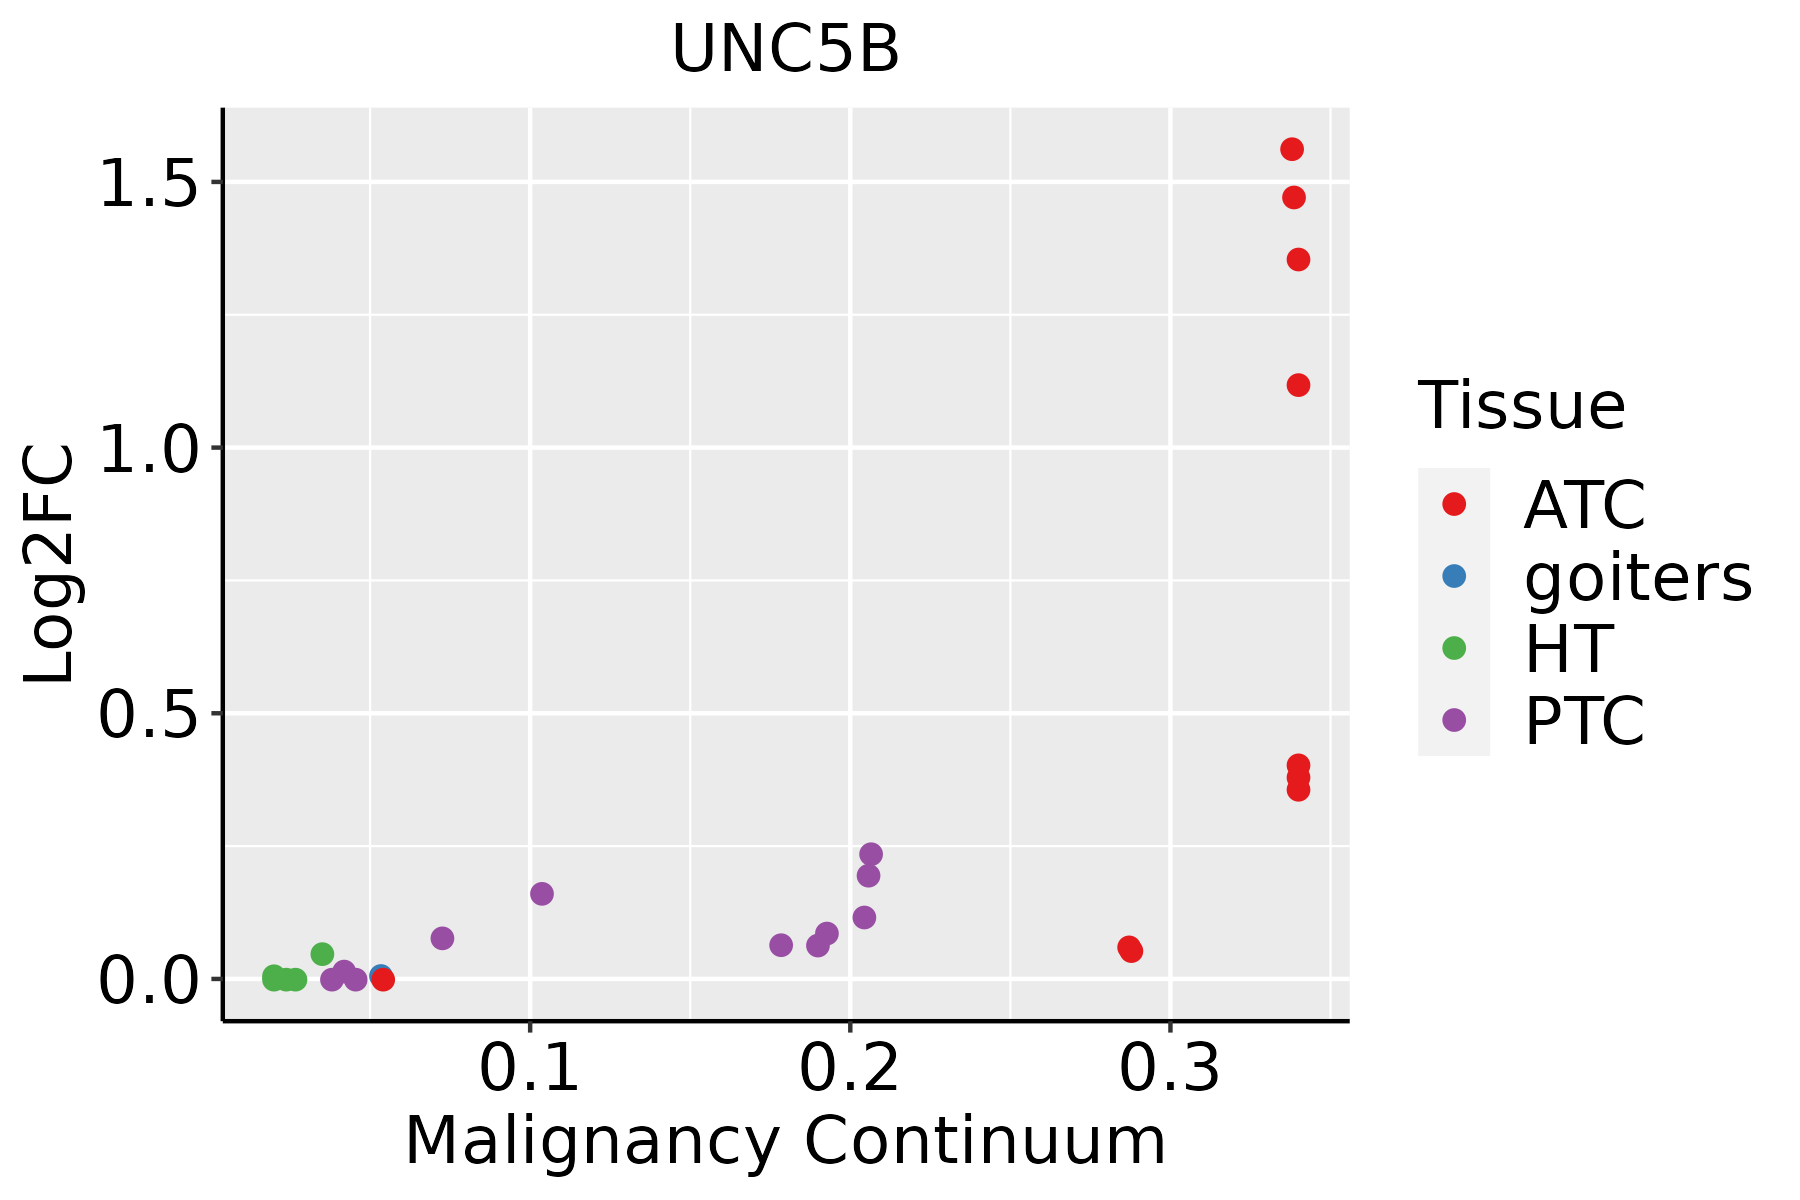 | ATC: Anaplastic thyroid cancer |
| HT: Hashimoto's thyroiditis | ||
| PTC: Papillary thyroid cancer |
| ∗log2FC in expression of this searched gene in stem-like cells from each diseased tissue sample relative to stem-like cells in normal samples in each tissue plotted against the malignancy continuum. Samples are colored based on if they are from different disease stage. |
Top |
Malignant transformation related pathway analysis |
| Find out the enriched GO biological processes and KEGG pathways involved in transition from healthy to precancer to cancer |
| Tissue | Disease Stage | Enriched GO biological Processes |
| Colorectum | AD |  |
| Colorectum | SER |  |
| Colorectum | MSS |  |
| Colorectum | MSI-H |  |
| Colorectum | FAP |  |
| ∗Top 15 enriched GO BP terms are showed in the bar plot of each disease state in each tissue. Each row represents a significant GO biological process which is colored according to the -log10(p.adjust). |
| Page: 1 2 3 4 5 6 7 8 9 |
| GO ID | Tissue | Disease Stage | Description | Gene Ratio | Bg Ratio | pvalue | p.adjust | Count |
| GO:2001233 | Colorectum | AD | regulation of apoptotic signaling pathway | 119/3918 | 356/18723 | 2.14e-08 | 1.21e-06 | 119 |
| GO:0070997 | Colorectum | AD | neuron death | 114/3918 | 361/18723 | 1.13e-06 | 3.72e-05 | 114 |
| GO:1901214 | Colorectum | AD | regulation of neuron death | 99/3918 | 319/18723 | 1.26e-05 | 2.76e-04 | 99 |
| GO:2001234 | Colorectum | AD | negative regulation of apoptotic signaling pathway | 74/3918 | 224/18723 | 1.49e-05 | 3.18e-04 | 74 |
| GO:0007409 | Colorectum | AD | axonogenesis | 122/3918 | 418/18723 | 3.36e-05 | 6.15e-04 | 122 |
| GO:0051402 | Colorectum | AD | neuron apoptotic process | 77/3918 | 246/18723 | 8.07e-05 | 1.28e-03 | 77 |
| GO:0061564 | Colorectum | AD | axon development | 132/3918 | 467/18723 | 8.40e-05 | 1.31e-03 | 132 |
| GO:1901215 | Colorectum | AD | negative regulation of neuron death | 67/3918 | 208/18723 | 8.81e-05 | 1.35e-03 | 67 |
| GO:0097191 | Colorectum | AD | extrinsic apoptotic signaling pathway | 68/3918 | 219/18723 | 2.64e-04 | 3.27e-03 | 68 |
| GO:0043523 | Colorectum | AD | regulation of neuron apoptotic process | 64/3918 | 212/18723 | 8.95e-04 | 8.63e-03 | 64 |
| GO:0048017 | Colorectum | AD | inositol lipid-mediated signaling | 53/3918 | 182/18723 | 5.35e-03 | 3.52e-02 | 53 |
| GO:0048015 | Colorectum | AD | phosphatidylinositol-mediated signaling | 52/3918 | 178/18723 | 5.37e-03 | 3.54e-02 | 52 |
| GO:0007411 | Colorectum | AD | axon guidance | 64/3918 | 227/18723 | 5.41e-03 | 3.55e-02 | 64 |
| GO:0097485 | Colorectum | AD | neuron projection guidance | 64/3918 | 228/18723 | 6.02e-03 | 3.78e-02 | 64 |
| GO:0043524 | Colorectum | AD | negative regulation of neuron apoptotic process | 43/3918 | 145/18723 | 8.04e-03 | 4.73e-02 | 43 |
| GO:20012331 | Colorectum | SER | regulation of apoptotic signaling pathway | 101/2897 | 356/18723 | 3.05e-10 | 4.07e-08 | 101 |
| GO:20012341 | Colorectum | SER | negative regulation of apoptotic signaling pathway | 64/2897 | 224/18723 | 3.98e-07 | 2.06e-05 | 64 |
| GO:00971911 | Colorectum | SER | extrinsic apoptotic signaling pathway | 58/2897 | 219/18723 | 1.76e-05 | 5.22e-04 | 58 |
| GO:00709971 | Colorectum | SER | neuron death | 84/2897 | 361/18723 | 5.76e-05 | 1.35e-03 | 84 |
| GO:00514021 | Colorectum | SER | neuron apoptotic process | 60/2897 | 246/18723 | 1.65e-04 | 3.13e-03 | 60 |
| Page: 1 2 3 4 |
| Pathway ID | Tissue | Disease Stage | Description | Gene Ratio | Bg Ratio | pvalue | p.adjust | qvalue | Count |
| hsa04360 | Colorectum | AD | Axon guidance | 61/2092 | 182/8465 | 4.36e-03 | 2.17e-02 | 1.38e-02 | 61 |
| hsa043601 | Colorectum | AD | Axon guidance | 61/2092 | 182/8465 | 4.36e-03 | 2.17e-02 | 1.38e-02 | 61 |
| hsa0436014 | Oral cavity | OSCC | Axon guidance | 97/3704 | 182/8465 | 5.59e-03 | 1.33e-02 | 6.76e-03 | 97 |
| hsa0436015 | Oral cavity | OSCC | Axon guidance | 97/3704 | 182/8465 | 5.59e-03 | 1.33e-02 | 6.76e-03 | 97 |
| Page: 1 |
Top |
Cell-cell communication analysis |
| Identification of potential cell-cell interactions between two cell types and their ligand-receptor pairs for different disease states |
| Ligand | Receptor | LRpair | Pathway | Tissue | Disease Stage |
| Page: 1 |
Top |
Single-cell gene regulatory network inference analysis |
| Find out the significant the regulons (TFs) and the target genes of each regulon across cell types for different disease states |
| TF | Cell Type | Tissue | Disease Stage | Target Gene | RSS | Regulon Activity |
| ∗The dot plots of a searched regulon are shown for all cell subpopulations in each disease state of each tissue based on the regulon specific score inferred using pySCENIC and by calculating the average expression. |
| Page: 1 |
Top |
Somatic mutation of malignant transformation related genes |
| Annotation of somatic variants for genes involved in malignant transformation |
| Hugo Symbol | Variant Class | Variant Classification | dbSNP RS | HGVSc | HGVSp | HGVSp Short | SWISSPROT | BIOTYPE | SIFT | PolyPhen | Tumor Sample Barcode | Tissue | Histology | Sex | Age | Stage | Therapy Types | Drugs | Outcome |
| UNC5B | SNV | Missense_Mutation | novel | c.358N>A | p.Leu120Ile | p.L120I | Q8IZJ1 | protein_coding | tolerated(0.36) | probably_damaging(0.996) | TCGA-E9-A1RE-01 | Breast | breast invasive carcinoma | Female | >=65 | III/IV | Hormone Therapy | tamoxiphen | SD |
| UNC5B | SNV | Missense_Mutation | novel | c.928A>C | p.Lys310Gln | p.K310Q | Q8IZJ1 | protein_coding | deleterious(0.03) | probably_damaging(0.999) | TCGA-HN-A2NL-01 | Breast | breast invasive carcinoma | Female | <65 | I/II | Chemotherapy | cyclophosphamide | SD |
| UNC5B | insertion | Frame_Shift_Ins | novel | c.1601_1602insACTGA | p.Gly536ThrfsTer68 | p.G536Tfs*68 | Q8IZJ1 | protein_coding | TCGA-A2-A0CM-01 | Breast | breast invasive carcinoma | Female | <65 | I/II | Chemotherapy | adriamycin | PD | ||
| UNC5B | SNV | Missense_Mutation | rs199873525 | c.676G>A | p.Val226Met | p.V226M | Q8IZJ1 | protein_coding | tolerated(0.17) | possibly_damaging(0.463) | TCGA-2W-A8YY-01 | Cervix | cervical & endocervical cancer | Female | <65 | I/II | Chemotherapy | cisplatin | CR |
| UNC5B | SNV | Missense_Mutation | rs759839363 | c.812G>A | p.Arg271Gln | p.R271Q | Q8IZJ1 | protein_coding | deleterious(0) | probably_damaging(0.999) | TCGA-2W-A8YY-01 | Cervix | cervical & endocervical cancer | Female | <65 | I/II | Chemotherapy | cisplatin | CR |
| UNC5B | SNV | Missense_Mutation | rs139601435 | c.1210C>T | p.Arg404Cys | p.R404C | Q8IZJ1 | protein_coding | deleterious(0.01) | probably_damaging(0.998) | TCGA-2W-A8YY-01 | Cervix | cervical & endocervical cancer | Female | <65 | I/II | Chemotherapy | cisplatin | CR |
| UNC5B | SNV | Missense_Mutation | novel | c.541C>T | p.Pro181Ser | p.P181S | Q8IZJ1 | protein_coding | deleterious(0.01) | benign(0.23) | TCGA-EA-A3HS-01 | Cervix | cervical & endocervical cancer | Female | <65 | I/II | Unknown | Unknown | SD |
| UNC5B | SNV | Missense_Mutation | c.169N>T | p.Ala57Ser | p.A57S | Q8IZJ1 | protein_coding | tolerated(0.07) | probably_damaging(0.998) | TCGA-MY-A913-01 | Cervix | cervical & endocervical cancer | Female | <65 | I/II | Chemotherapy | cisplatin | CR | |
| UNC5B | SNV | Missense_Mutation | rs202076199 | c.1540G>A | p.Asp514Asn | p.D514N | Q8IZJ1 | protein_coding | tolerated(0.5) | benign(0.177) | TCGA-A6-2677-01 | Colorectum | colon adenocarcinoma | Female | >=65 | III/IV | Ancillary | leucovorin | SD |
| UNC5B | SNV | Missense_Mutation | novel | c.1349N>A | p.Gly450Asp | p.G450D | Q8IZJ1 | protein_coding | tolerated(0.05) | probably_damaging(1) | TCGA-A6-3809-01 | Colorectum | colon adenocarcinoma | Female | >=65 | I/II | Unknown | Unknown | SD |
| Page: 1 2 3 4 5 6 7 8 9 10 11 |
Top |
Related drugs of malignant transformation related genes |
| Identification of chemicals and drugs interact with genes involved in malignant transfromation |
| (DGIdb 4.0) |
| Entrez ID | Symbol | Category | Interaction Types | Drug Claim Name | Drug Name | PMIDs |
| Page: 1 |

Copyright 2023-Present -The University of Texas Health Science Center at Houston |