
|
|||||
|
 | |
| |
| |
| |
| |
| |
|
Gene: UNC45A |
Gene summary for UNC45A |
| Gene information | Species | Human | Gene symbol | UNC45A | Gene ID | 55898 |
| Gene name | unc-45 myosin chaperone A | |
| Gene Alias | GC-UNC45 | |
| Cytomap | 15q26.1 | |
| Gene Type | protein-coding | GO ID | GO:0006457 | UniProtAcc | Q9H3U1 |
Top |
Malignant transformation analysis |
| Identification of the aberrant gene expression in precancerous and cancerous lesions by comparing the gene expression of stem-like cells in diseased tissues with normal stem cells |
| Entrez ID | Symbol | Replicates | Species | Organ | Tissue | Adj P-value | Log2FC | Malignancy |
| 55898 | UNC45A | LZE4T | Human | Esophagus | ESCC | 7.91e-13 | 4.46e-01 | 0.0811 |
| 55898 | UNC45A | LZE7T | Human | Esophagus | ESCC | 2.76e-06 | 5.60e-01 | 0.0667 |
| 55898 | UNC45A | LZE8T | Human | Esophagus | ESCC | 3.40e-09 | 1.78e-01 | 0.067 |
| 55898 | UNC45A | LZE20T | Human | Esophagus | ESCC | 2.28e-04 | 1.22e-01 | 0.0662 |
| 55898 | UNC45A | LZE22T | Human | Esophagus | ESCC | 1.79e-03 | 1.69e-01 | 0.068 |
| 55898 | UNC45A | LZE24T | Human | Esophagus | ESCC | 5.07e-15 | 1.66e-01 | 0.0596 |
| 55898 | UNC45A | LZE21T | Human | Esophagus | ESCC | 8.43e-03 | 4.28e-01 | 0.0655 |
| 55898 | UNC45A | LZE6T | Human | Esophagus | ESCC | 5.93e-05 | 1.57e-01 | 0.0845 |
| 55898 | UNC45A | P1T-E | Human | Esophagus | ESCC | 4.86e-09 | 7.00e-01 | 0.0875 |
| 55898 | UNC45A | P2T-E | Human | Esophagus | ESCC | 6.32e-26 | 3.43e-01 | 0.1177 |
| 55898 | UNC45A | P4T-E | Human | Esophagus | ESCC | 9.19e-32 | 5.76e-01 | 0.1323 |
| 55898 | UNC45A | P5T-E | Human | Esophagus | ESCC | 2.06e-21 | 1.81e-01 | 0.1327 |
| 55898 | UNC45A | P8T-E | Human | Esophagus | ESCC | 3.33e-31 | 4.58e-01 | 0.0889 |
| 55898 | UNC45A | P9T-E | Human | Esophagus | ESCC | 3.16e-17 | 4.69e-01 | 0.1131 |
| 55898 | UNC45A | P10T-E | Human | Esophagus | ESCC | 6.70e-46 | 8.17e-01 | 0.116 |
| 55898 | UNC45A | P11T-E | Human | Esophagus | ESCC | 5.44e-06 | 5.67e-01 | 0.1426 |
| 55898 | UNC45A | P12T-E | Human | Esophagus | ESCC | 8.15e-40 | 7.14e-01 | 0.1122 |
| 55898 | UNC45A | P15T-E | Human | Esophagus | ESCC | 5.03e-33 | 7.44e-01 | 0.1149 |
| 55898 | UNC45A | P16T-E | Human | Esophagus | ESCC | 3.24e-30 | 6.36e-01 | 0.1153 |
| 55898 | UNC45A | P17T-E | Human | Esophagus | ESCC | 1.28e-05 | 3.31e-01 | 0.1278 |
| Page: 1 2 3 4 5 6 |
| Tissue | Expression Dynamics | Abbreviation |
| Esophagus | 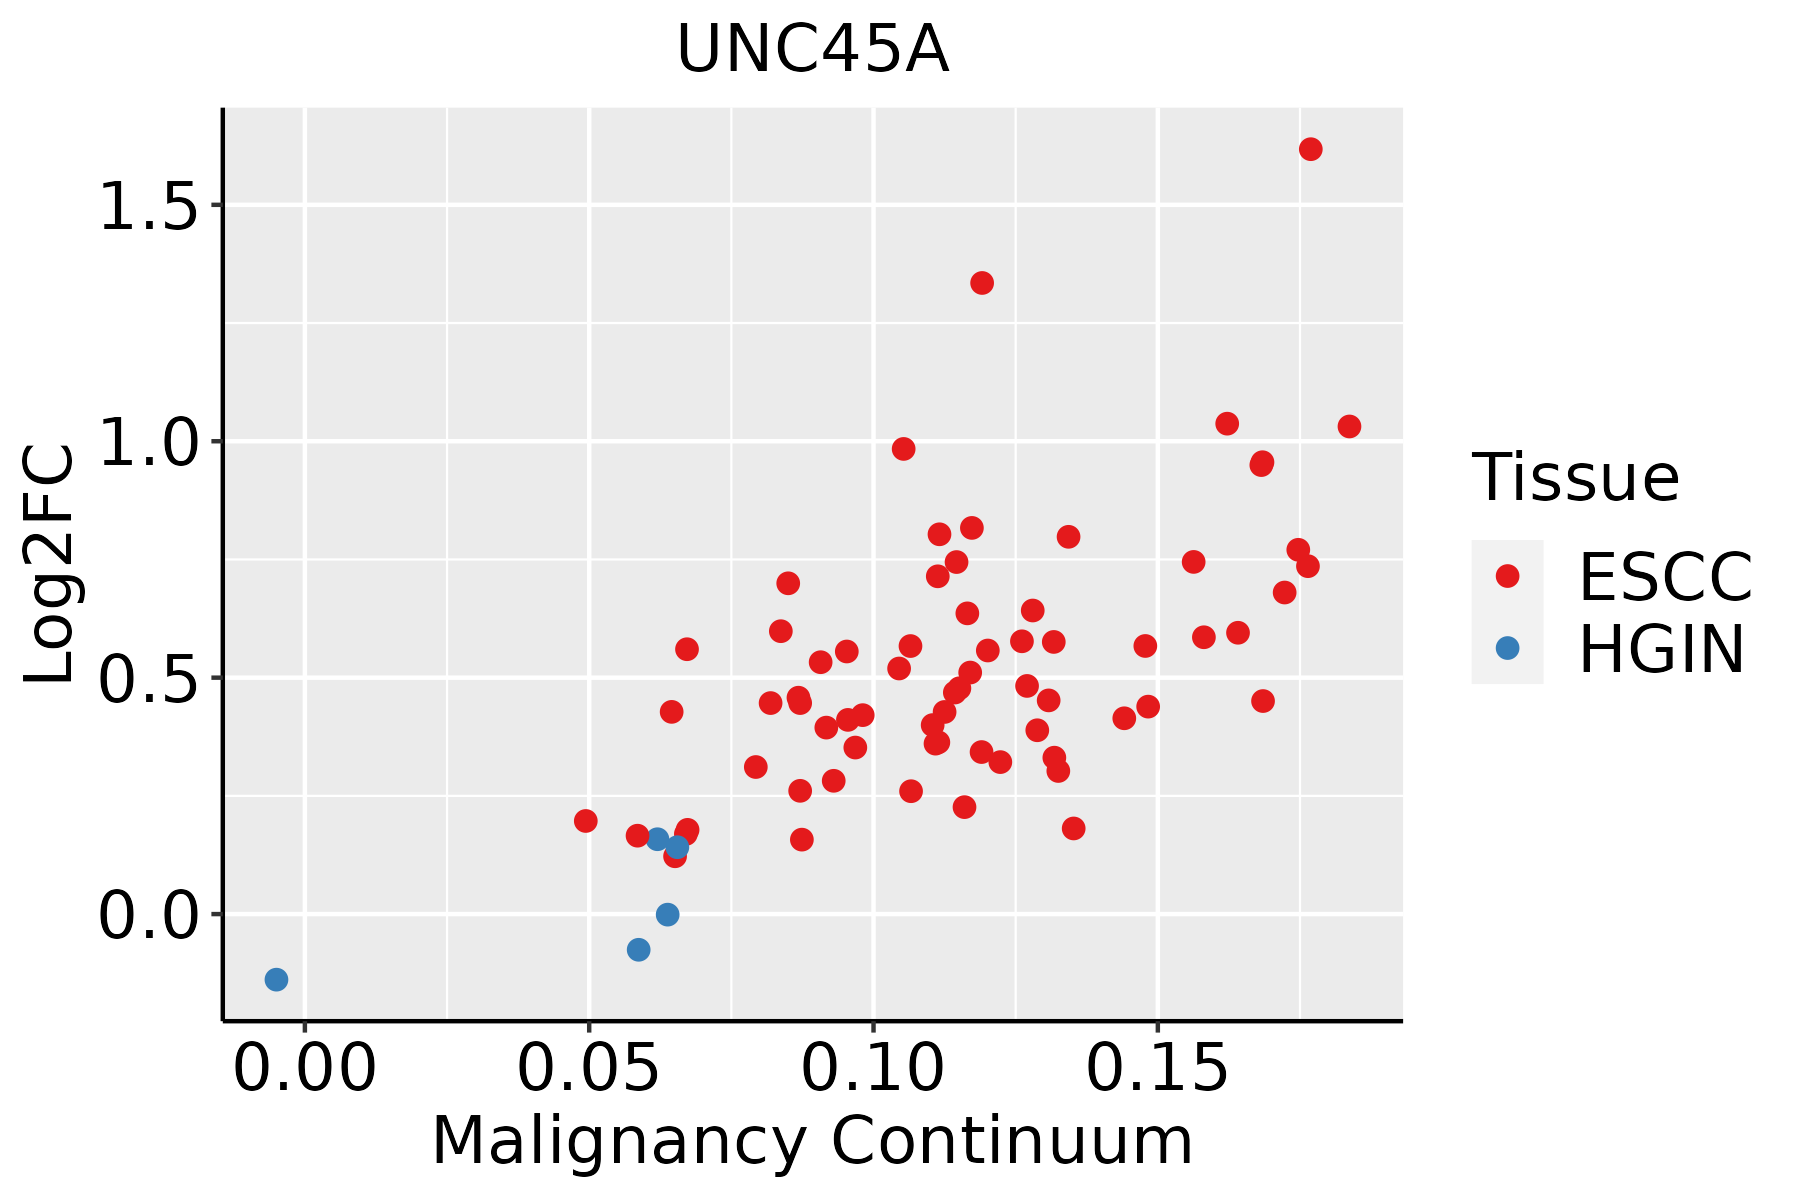 | ESCC: Esophageal squamous cell carcinoma |
| HGIN: High-grade intraepithelial neoplasias | ||
| LGIN: Low-grade intraepithelial neoplasias | ||
| Liver | 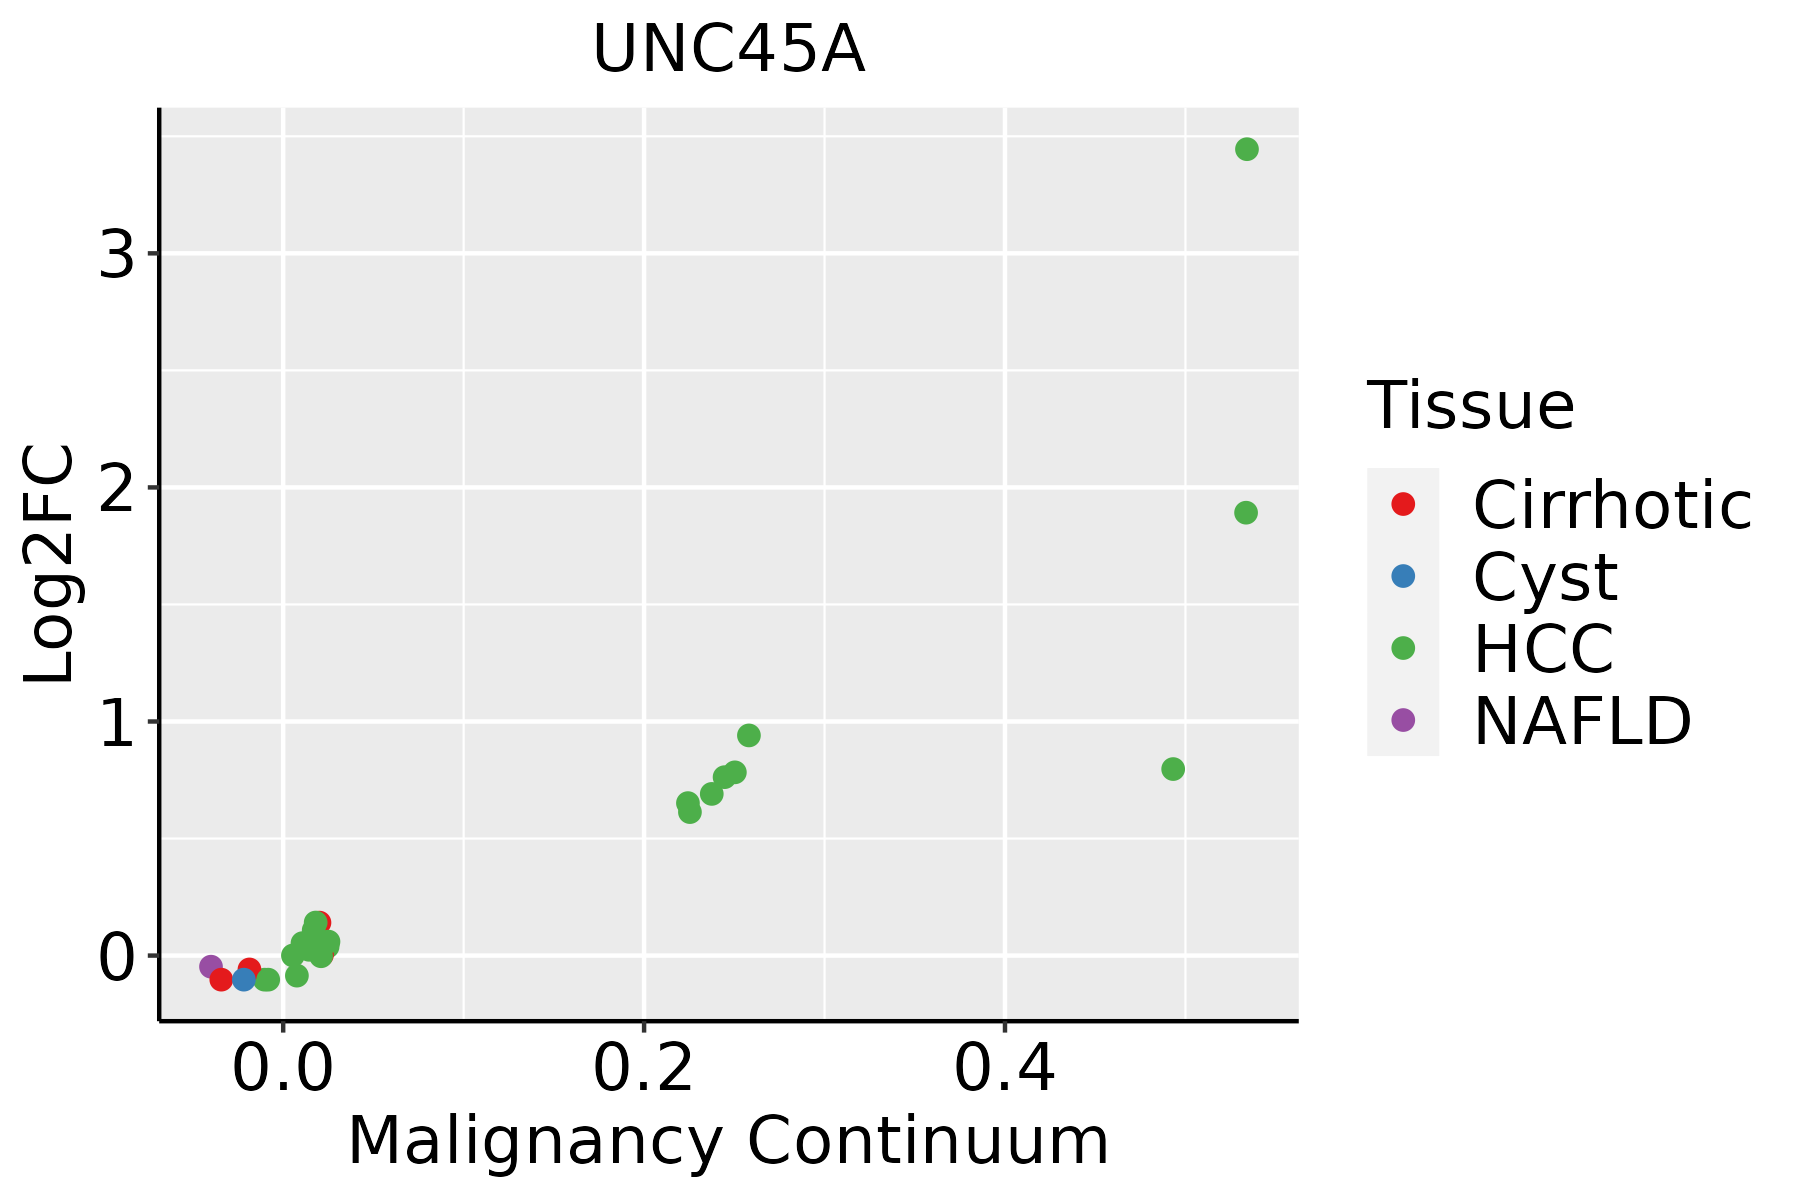 | HCC: Hepatocellular carcinoma |
| NAFLD: Non-alcoholic fatty liver disease | ||
| Oral Cavity | 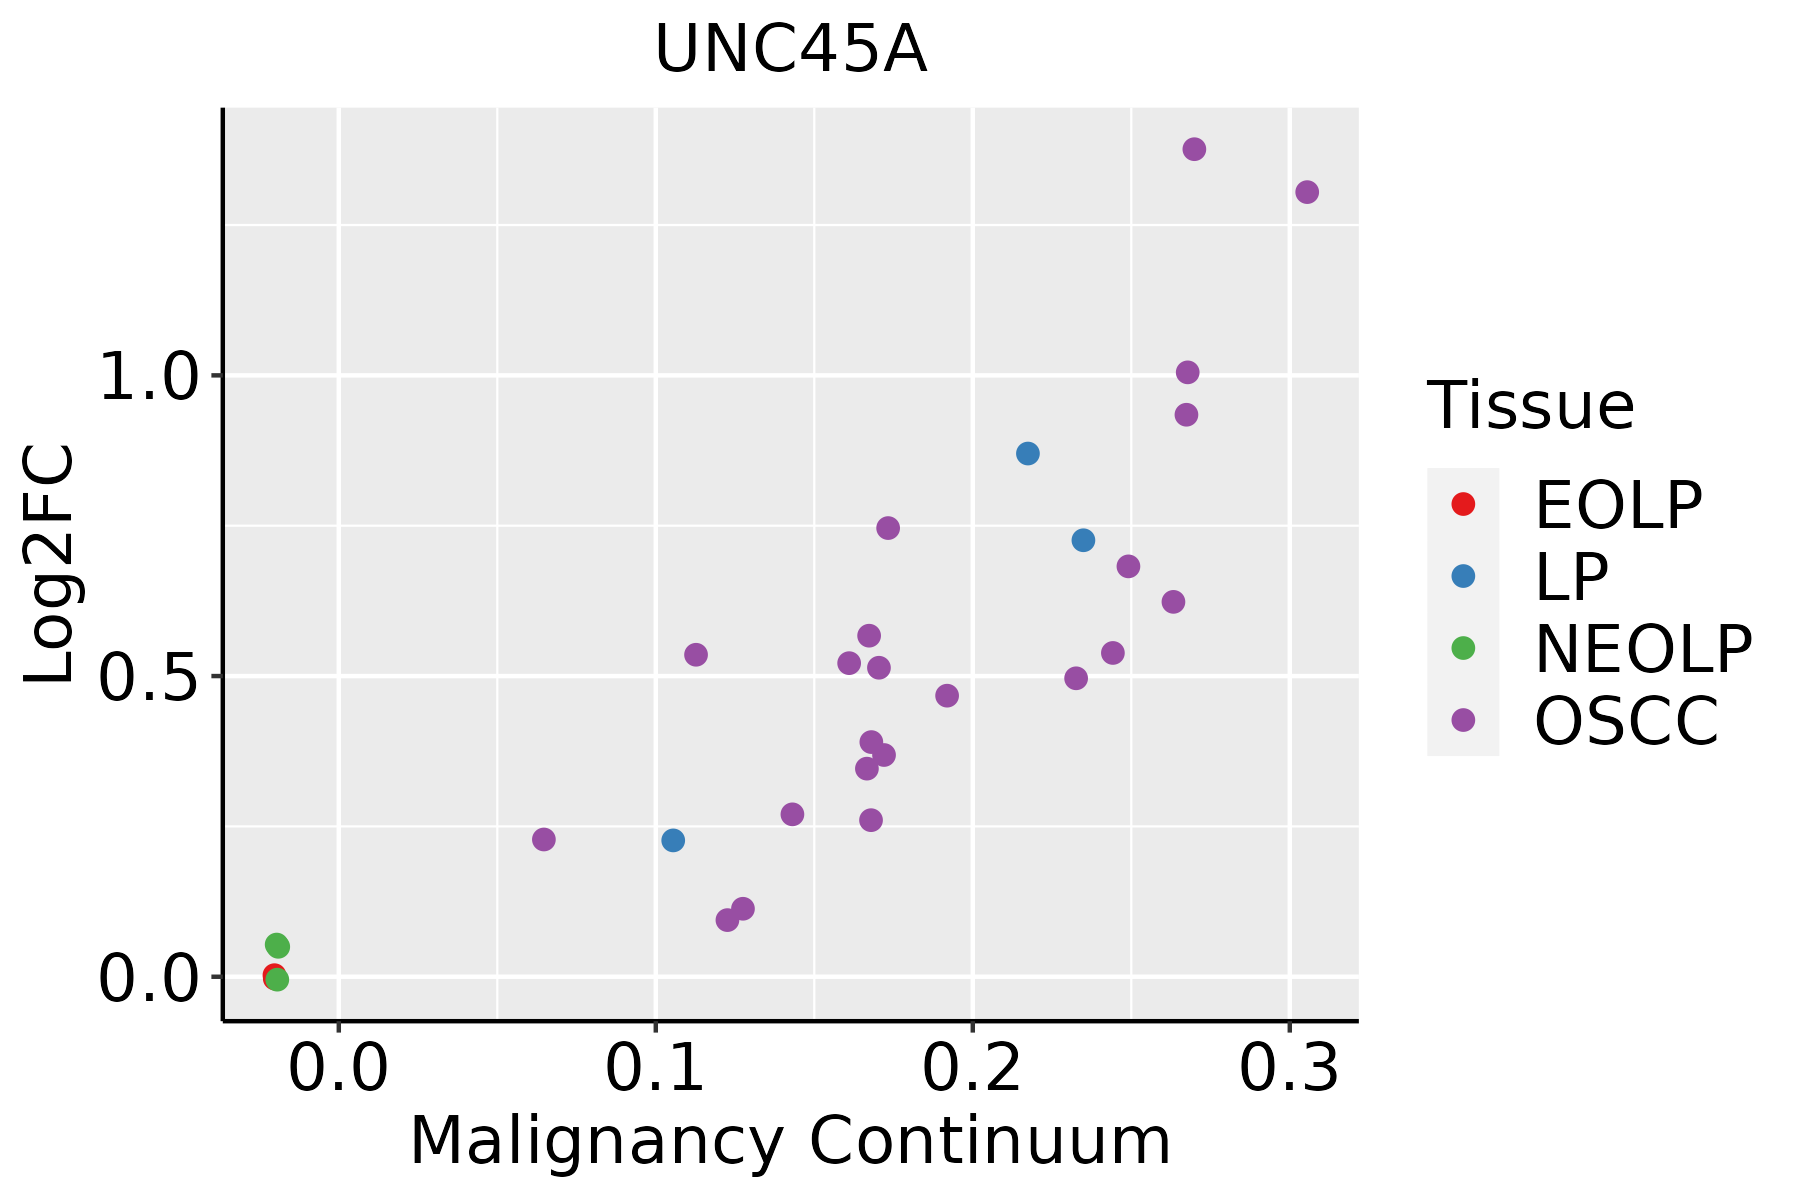 | EOLP: Erosive Oral lichen planus |
| LP: leukoplakia | ||
| NEOLP: Non-erosive oral lichen planus | ||
| OSCC: Oral squamous cell carcinoma | ||
| Skin | 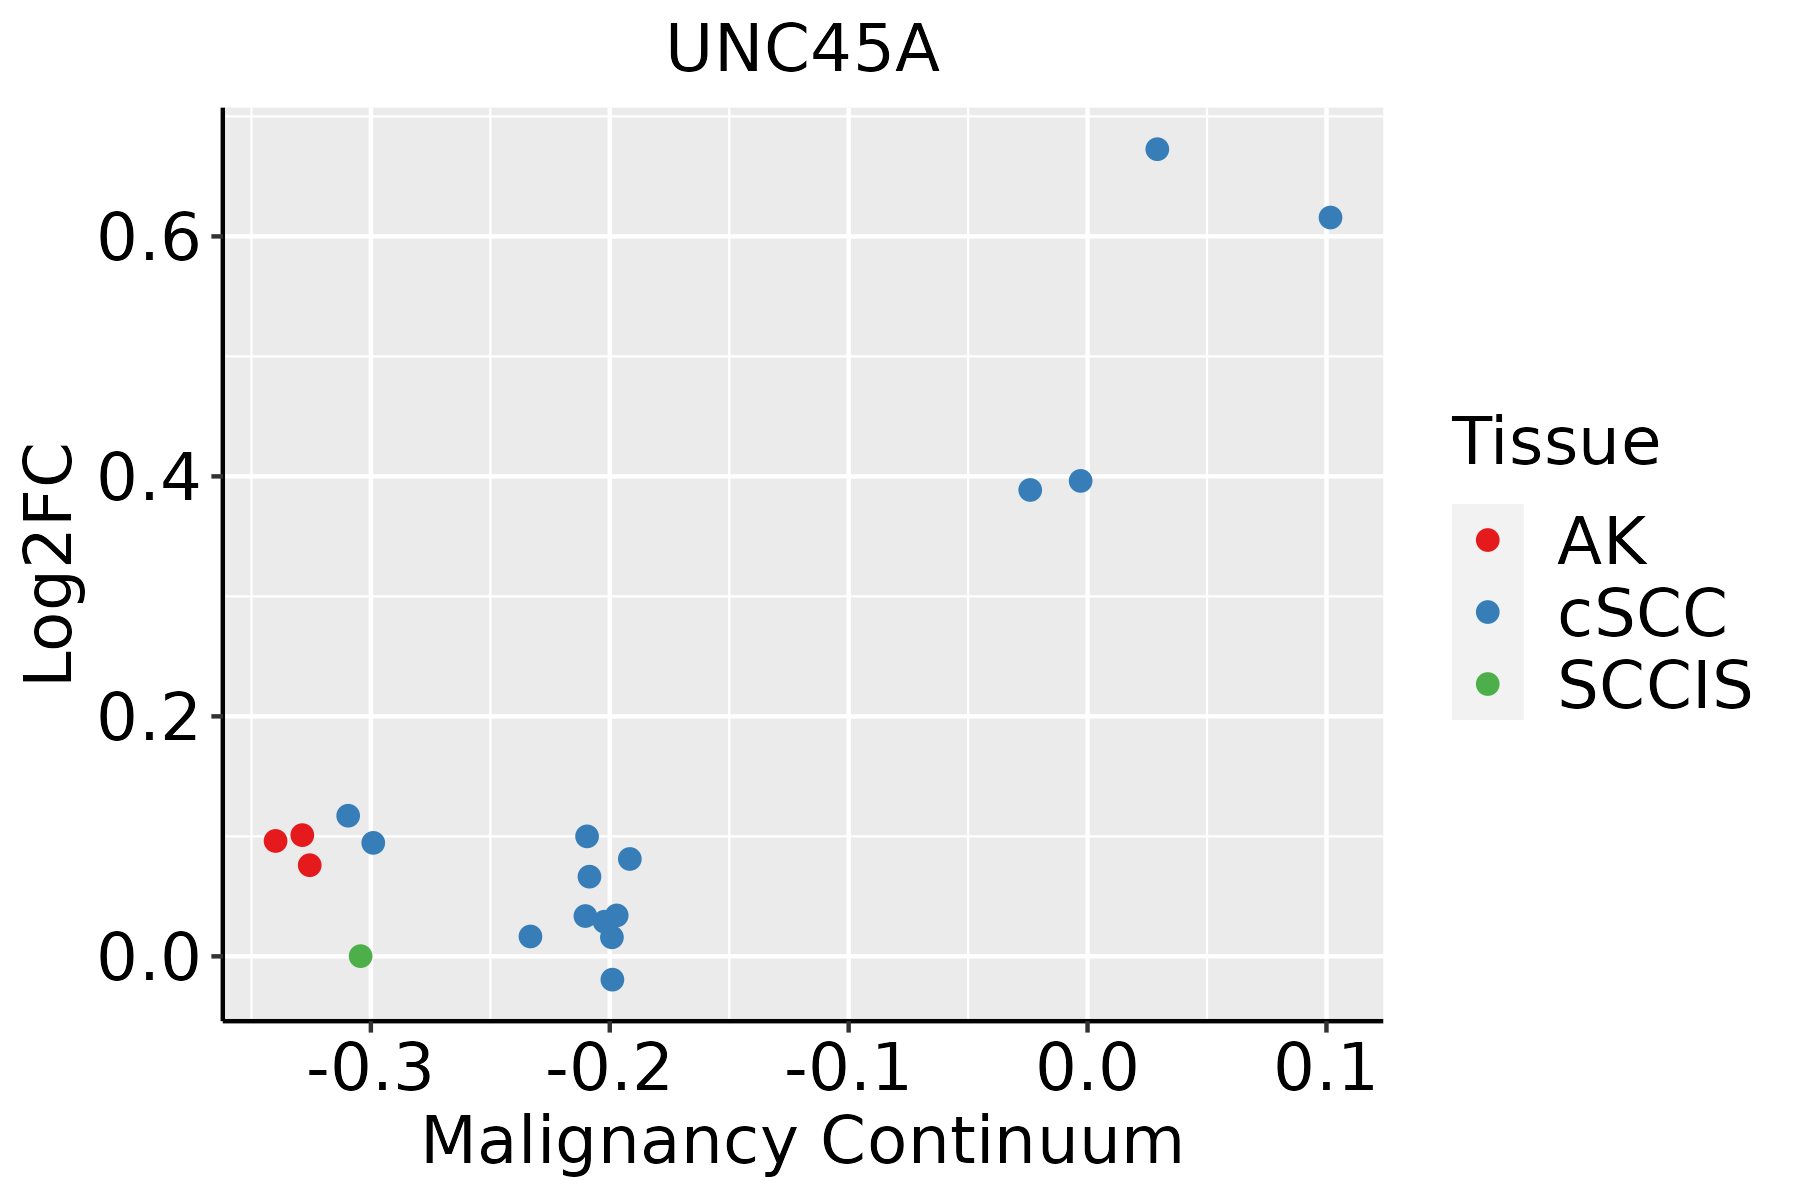 | AK: Actinic keratosis |
| cSCC: Cutaneous squamous cell carcinoma | ||
| SCCIS:squamous cell carcinoma in situ | ||
| Thyroid |  | ATC: Anaplastic thyroid cancer |
| HT: Hashimoto's thyroiditis | ||
| PTC: Papillary thyroid cancer |
| ∗log2FC in expression of this searched gene in stem-like cells from each diseased tissue sample relative to stem-like cells in normal samples in each tissue plotted against the malignancy continuum. Samples are colored based on if they are from different disease stage. |
Top |
Malignant transformation related pathway analysis |
| Find out the enriched GO biological processes and KEGG pathways involved in transition from healthy to precancer to cancer |
| Tissue | Disease Stage | Enriched GO biological Processes |
| Colorectum | AD |  |
| Colorectum | SER |  |
| Colorectum | MSS |  |
| Colorectum | MSI-H |  |
| Colorectum | FAP |  |
| ∗Top 15 enriched GO BP terms are showed in the bar plot of each disease state in each tissue. Each row represents a significant GO biological process which is colored according to the -log10(p.adjust). |
| Page: 1 2 3 4 5 6 7 8 9 |
| GO ID | Tissue | Disease Stage | Description | Gene Ratio | Bg Ratio | pvalue | p.adjust | Count |
| GO:0006457110 | Esophagus | ESCC | protein folding | 163/8552 | 212/18723 | 1.13e-20 | 1.74e-18 | 163 |
| GO:0061077110 | Esophagus | ESCC | chaperone-mediated protein folding | 56/8552 | 67/18723 | 1.52e-10 | 4.36e-09 | 56 |
| GO:00064577 | Liver | Cirrhotic | protein folding | 114/4634 | 212/18723 | 9.23e-20 | 2.31e-17 | 114 |
| GO:00610777 | Liver | Cirrhotic | chaperone-mediated protein folding | 40/4634 | 67/18723 | 1.24e-09 | 5.43e-08 | 40 |
| GO:000645712 | Liver | HCC | protein folding | 160/7958 | 212/18723 | 1.07e-22 | 1.88e-20 | 160 |
| GO:006107712 | Liver | HCC | chaperone-mediated protein folding | 56/7958 | 67/18723 | 4.86e-12 | 2.14e-10 | 56 |
| GO:000645718 | Oral cavity | OSCC | protein folding | 154/7305 | 212/18723 | 1.89e-23 | 4.60e-21 | 154 |
| GO:006107718 | Oral cavity | OSCC | chaperone-mediated protein folding | 54/7305 | 67/18723 | 3.73e-12 | 1.45e-10 | 54 |
| GO:000645719 | Oral cavity | LP | protein folding | 125/4623 | 212/18723 | 1.62e-26 | 8.45e-24 | 125 |
| GO:006107719 | Oral cavity | LP | chaperone-mediated protein folding | 45/4623 | 67/18723 | 2.58e-13 | 2.41e-11 | 45 |
| GO:0006457111 | Skin | cSCC | protein folding | 131/4864 | 212/18723 | 2.96e-28 | 1.32e-25 | 131 |
| GO:0061077111 | Skin | cSCC | chaperone-mediated protein folding | 46/4864 | 67/18723 | 2.93e-13 | 1.75e-11 | 46 |
| GO:0006457112 | Thyroid | PTC | protein folding | 137/5968 | 212/18723 | 8.29e-23 | 2.01e-20 | 137 |
| GO:0061077112 | Thyroid | PTC | chaperone-mediated protein folding | 46/5968 | 67/18723 | 6.91e-10 | 2.08e-08 | 46 |
| GO:000645733 | Thyroid | ATC | protein folding | 140/6293 | 212/18723 | 3.46e-22 | 8.09e-20 | 140 |
| GO:006107733 | Thyroid | ATC | chaperone-mediated protein folding | 47/6293 | 67/18723 | 1.05e-09 | 2.67e-08 | 47 |
| GO:000751716 | Thyroid | ATC | muscle organ development | 139/6293 | 327/18723 | 4.45e-04 | 2.64e-03 | 139 |
| Page: 1 |
| Pathway ID | Tissue | Disease Stage | Description | Gene Ratio | Bg Ratio | pvalue | p.adjust | qvalue | Count |
| Page: 1 |
Top |
Cell-cell communication analysis |
| Identification of potential cell-cell interactions between two cell types and their ligand-receptor pairs for different disease states |
| Ligand | Receptor | LRpair | Pathway | Tissue | Disease Stage |
| Page: 1 |
Top |
Single-cell gene regulatory network inference analysis |
| Find out the significant the regulons (TFs) and the target genes of each regulon across cell types for different disease states |
| TF | Cell Type | Tissue | Disease Stage | Target Gene | RSS | Regulon Activity |
| ∗The dot plots of a searched regulon are shown for all cell subpopulations in each disease state of each tissue based on the regulon specific score inferred using pySCENIC and by calculating the average expression. |
| Page: 1 |
Top |
Somatic mutation of malignant transformation related genes |
| Annotation of somatic variants for genes involved in malignant transformation |
| Hugo Symbol | Variant Class | Variant Classification | dbSNP RS | HGVSc | HGVSp | HGVSp Short | SWISSPROT | BIOTYPE | SIFT | PolyPhen | Tumor Sample Barcode | Tissue | Histology | Sex | Age | Stage | Therapy Types | Drugs | Outcome |
| UNC45A | SNV | Missense_Mutation | novel | c.1193N>C | p.Tyr398Ser | p.Y398S | Q9H3U1 | protein_coding | deleterious(0) | probably_damaging(0.939) | TCGA-AN-A04A-01 | Breast | breast invasive carcinoma | Female | <65 | III/IV | Unknown | Unknown | SD |
| UNC45A | SNV | Missense_Mutation | c.2325N>T | p.Lys775Asn | p.K775N | Q9H3U1 | protein_coding | tolerated(0.09) | benign(0.164) | TCGA-AR-A0U3-01 | Breast | breast invasive carcinoma | Female | <65 | I/II | Chemotherapy | doxorubicin | SD | |
| UNC45A | SNV | Missense_Mutation | rs774657103 | c.2192N>G | p.Tyr731Cys | p.Y731C | Q9H3U1 | protein_coding | tolerated(0.07) | probably_damaging(0.997) | TCGA-AR-A256-01 | Breast | breast invasive carcinoma | Female | <65 | I/II | Chemotherapy | doxorubicin | PD |
| UNC45A | SNV | Missense_Mutation | rs8041417 | c.2506N>T | p.Arg836Trp | p.R836W | Q9H3U1 | protein_coding | deleterious(0.03) | possibly_damaging(0.874) | TCGA-D8-A145-01 | Breast | breast invasive carcinoma | Female | >=65 | I/II | Hormone Therapy | tamoxiphen | SD |
| UNC45A | SNV | Missense_Mutation | rs200736586 | c.443C>T | p.Ser148Leu | p.S148L | Q9H3U1 | protein_coding | deleterious(0.03) | benign(0.265) | TCGA-D8-A1J9-01 | Breast | breast invasive carcinoma | Female | <65 | I/II | Unknown | Unknown | SD |
| UNC45A | SNV | Missense_Mutation | rs765216586 | c.2437G>A | p.Glu813Lys | p.E813K | Q9H3U1 | protein_coding | tolerated(1) | benign(0.02) | TCGA-OK-A5Q2-01 | Breast | breast invasive carcinoma | Female | <65 | I/II | Unknown | Unknown | SD |
| UNC45A | insertion | Nonsense_Mutation | novel | c.559_560insAGTCCTATGTTGAGAAGAATTAGGAAGCAGATTGCCT | p.Gly187GlufsTer8 | p.G187Efs*8 | Q9H3U1 | protein_coding | TCGA-A2-A0CT-01 | Breast | breast invasive carcinoma | Female | >=65 | I/II | Chemotherapy | cytoxan | SD | ||
| UNC45A | insertion | In_Frame_Ins | novel | c.1194_1195insTTCCCG | p.Tyr398_Ile399insPhePro | p.Y398_I399insFP | Q9H3U1 | protein_coding | TCGA-AN-A04A-01 | Breast | breast invasive carcinoma | Female | <65 | III/IV | Unknown | Unknown | SD | ||
| UNC45A | insertion | Frame_Shift_Ins | novel | c.2151_2152insT | p.Thr718TyrfsTer15 | p.T718Yfs*15 | Q9H3U1 | protein_coding | TCGA-AN-A0FN-01 | Breast | breast invasive carcinoma | Female | <65 | I/II | Unknown | Unknown | SD | ||
| UNC45A | insertion | In_Frame_Ins | novel | c.2153_2154insACACCCCTTCCTGATGGCTGAGCCATCAGC | p.Thr718_Ser719insHisProPheLeuMetAlaGluProSerAla | p.T718_S719insHPFLMAEPSA | Q9H3U1 | protein_coding | TCGA-AN-A0FN-01 | Breast | breast invasive carcinoma | Female | <65 | I/II | Unknown | Unknown | SD |
| Page: 1 2 3 4 5 6 7 8 |
Top |
Related drugs of malignant transformation related genes |
| Identification of chemicals and drugs interact with genes involved in malignant transfromation |
| (DGIdb 4.0) |
| Entrez ID | Symbol | Category | Interaction Types | Drug Claim Name | Drug Name | PMIDs |
| Page: 1 |

Copyright 2023-Present -The University of Texas Health Science Center at Houston |