
|
|||||
|
 | |
| |
| |
| |
| |
| |
|
Gene: UNC13D |
Gene summary for UNC13D |
| Gene information | Species | Human | Gene symbol | UNC13D | Gene ID | 201294 |
| Gene name | unc-13 homolog D | |
| Gene Alias | FHL3 | |
| Cytomap | 17q25.1 | |
| Gene Type | protein-coding | GO ID | GO:0000902 | UniProtAcc | Q70J99 |
Top |
Malignant transformation analysis |
| Identification of the aberrant gene expression in precancerous and cancerous lesions by comparing the gene expression of stem-like cells in diseased tissues with normal stem cells |
| Entrez ID | Symbol | Replicates | Species | Organ | Tissue | Adj P-value | Log2FC | Malignancy |
| 201294 | UNC13D | LZE6T | Human | Esophagus | ESCC | 6.36e-03 | 2.71e-01 | 0.0845 |
| 201294 | UNC13D | P5T-E | Human | Esophagus | ESCC | 8.04e-04 | 3.91e-02 | 0.1327 |
| 201294 | UNC13D | P11T-E | Human | Esophagus | ESCC | 9.21e-05 | 3.39e-01 | 0.1426 |
| 201294 | UNC13D | P21T-E | Human | Esophagus | ESCC | 9.10e-11 | 2.46e-01 | 0.1617 |
| 201294 | UNC13D | P26T-E | Human | Esophagus | ESCC | 7.40e-04 | 1.11e-01 | 0.1276 |
| 201294 | UNC13D | P28T-E | Human | Esophagus | ESCC | 1.90e-02 | 5.73e-02 | 0.1149 |
| 201294 | UNC13D | P52T-E | Human | Esophagus | ESCC | 4.51e-02 | 7.60e-02 | 0.1555 |
| 201294 | UNC13D | P61T-E | Human | Esophagus | ESCC | 1.66e-19 | 4.52e-01 | 0.099 |
| 201294 | UNC13D | P76T-E | Human | Esophagus | ESCC | 1.34e-06 | 8.62e-02 | 0.1207 |
| 201294 | UNC13D | P79T-E | Human | Esophagus | ESCC | 1.43e-06 | 1.13e-01 | 0.1154 |
| 201294 | UNC13D | P82T-E | Human | Esophagus | ESCC | 3.98e-12 | 6.11e-01 | 0.1072 |
| 201294 | UNC13D | P89T-E | Human | Esophagus | ESCC | 1.25e-10 | 3.36e-01 | 0.1752 |
| 201294 | UNC13D | P128T-E | Human | Esophagus | ESCC | 3.38e-03 | 1.48e-01 | 0.1241 |
| 201294 | UNC13D | P130T-E | Human | Esophagus | ESCC | 2.53e-64 | 1.03e+00 | 0.1676 |
| 201294 | UNC13D | PTC04 | Human | Thyroid | PTC | 7.31e-03 | 5.17e-02 | 0.1927 |
| 201294 | UNC13D | PTC07 | Human | Thyroid | PTC | 5.59e-03 | 5.86e-02 | 0.2044 |
| 201294 | UNC13D | ATC09 | Human | Thyroid | ATC | 1.88e-17 | 5.42e-01 | 0.2871 |
| 201294 | UNC13D | ATC1 | Human | Thyroid | ATC | 8.17e-17 | 5.85e-01 | 0.2878 |
| Page: 1 |
| Tissue | Expression Dynamics | Abbreviation |
| Esophagus | 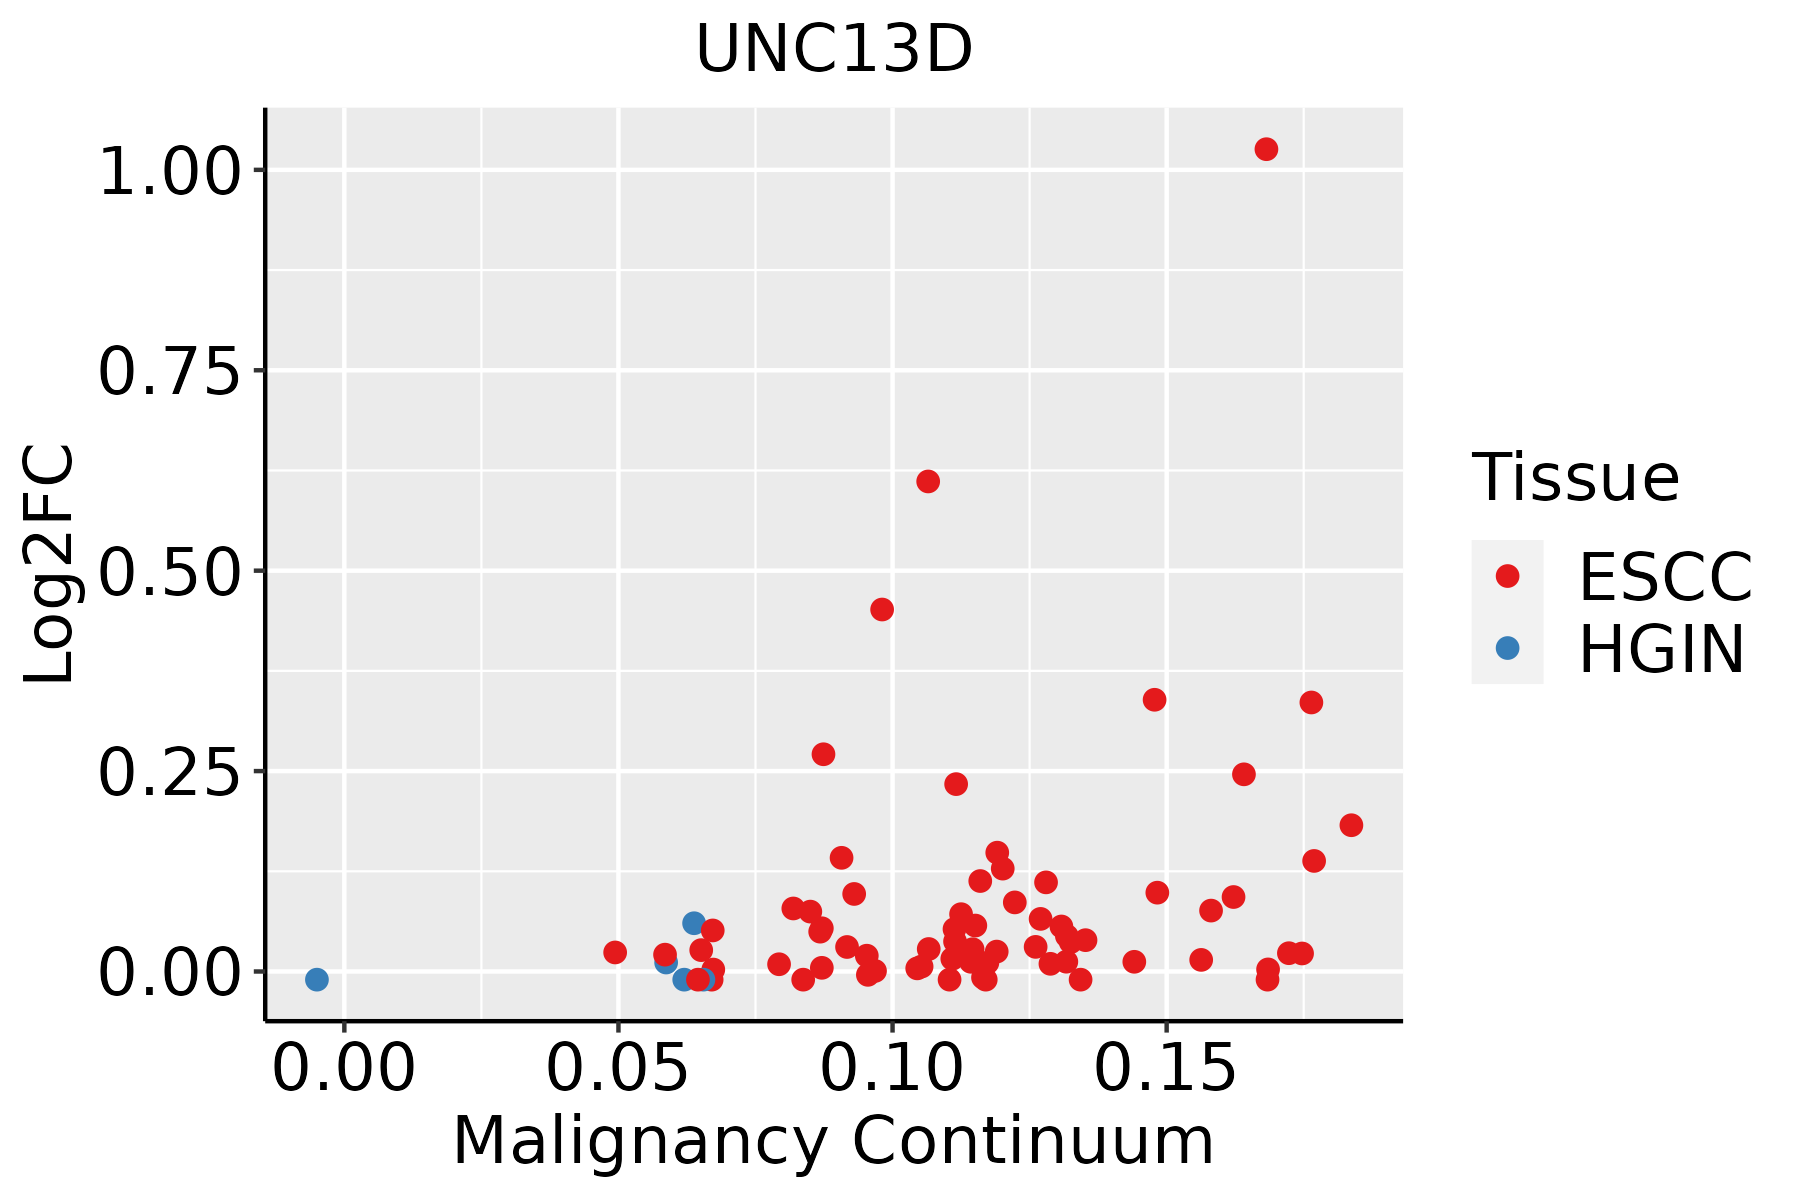 | ESCC: Esophageal squamous cell carcinoma |
| HGIN: High-grade intraepithelial neoplasias | ||
| LGIN: Low-grade intraepithelial neoplasias | ||
| Thyroid | 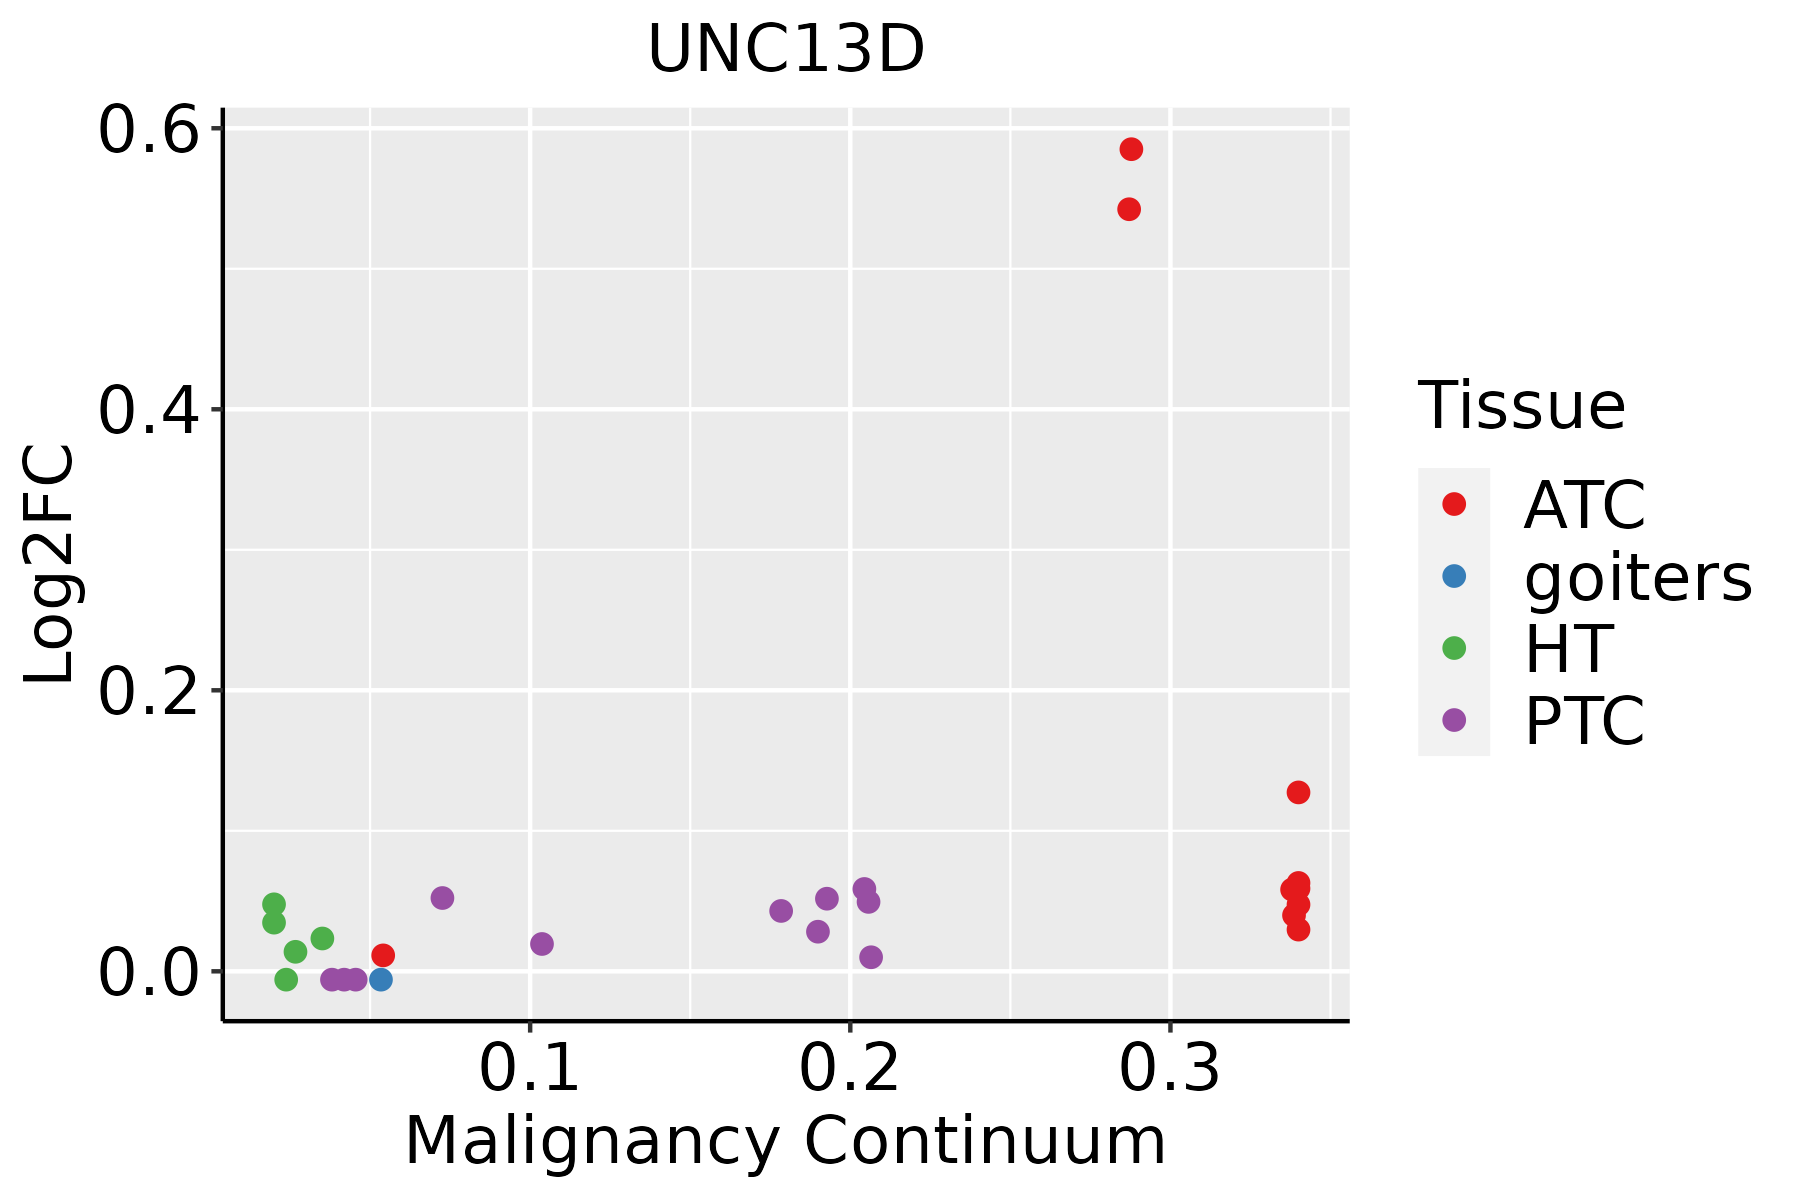 | ATC: Anaplastic thyroid cancer |
| HT: Hashimoto's thyroiditis | ||
| PTC: Papillary thyroid cancer |
| ∗log2FC in expression of this searched gene in stem-like cells from each diseased tissue sample relative to stem-like cells in normal samples in each tissue plotted against the malignancy continuum. Samples are colored based on if they are from different disease stage. |
Top |
Malignant transformation related pathway analysis |
| Find out the enriched GO biological processes and KEGG pathways involved in transition from healthy to precancer to cancer |
| Tissue | Disease Stage | Enriched GO biological Processes |
| Colorectum | AD |  |
| Colorectum | SER |  |
| Colorectum | MSS |  |
| Colorectum | MSI-H |  |
| Colorectum | FAP |  |
| ∗Top 15 enriched GO BP terms are showed in the bar plot of each disease state in each tissue. Each row represents a significant GO biological process which is colored according to the -log10(p.adjust). |
| Page: 1 2 3 4 5 6 7 8 9 |
| GO ID | Tissue | Disease Stage | Description | Gene Ratio | Bg Ratio | pvalue | p.adjust | Count |
| GO:005165617 | Esophagus | ESCC | establishment of organelle localization | 273/8552 | 390/18723 | 9.13e-23 | 1.81e-20 | 273 |
| GO:000961518 | Esophagus | ESCC | response to virus | 238/8552 | 367/18723 | 6.65e-14 | 3.32e-12 | 238 |
| GO:00516075 | Esophagus | ESCC | defense response to virus | 171/8552 | 265/18723 | 3.91e-10 | 1.05e-08 | 171 |
| GO:01405465 | Esophagus | ESCC | defense response to symbiont | 171/8552 | 265/18723 | 3.91e-10 | 1.05e-08 | 171 |
| GO:003158919 | Esophagus | ESCC | cell-substrate adhesion | 221/8552 | 363/18723 | 3.06e-09 | 6.62e-08 | 221 |
| GO:001081020 | Esophagus | ESCC | regulation of cell-substrate adhesion | 144/8552 | 221/18723 | 3.55e-09 | 7.45e-08 | 144 |
| GO:004578527 | Esophagus | ESCC | positive regulation of cell adhesion | 255/8552 | 437/18723 | 5.07e-08 | 9.11e-07 | 255 |
| GO:001081126 | Esophagus | ESCC | positive regulation of cell-substrate adhesion | 84/8552 | 123/18723 | 3.18e-07 | 4.50e-06 | 84 |
| GO:002260420 | Esophagus | ESCC | regulation of cell morphogenesis | 180/8552 | 309/18723 | 5.19e-06 | 5.45e-05 | 180 |
| GO:001072010 | Esophagus | ESCC | positive regulation of cell development | 172/8552 | 298/18723 | 1.74e-05 | 1.55e-04 | 172 |
| GO:001076920 | Esophagus | ESCC | regulation of cell morphogenesis involved in differentiation | 61/8552 | 96/18723 | 3.12e-04 | 1.85e-03 | 61 |
| GO:001077018 | Esophagus | ESCC | positive regulation of cell morphogenesis involved in differentiation | 51/8552 | 79/18723 | 5.48e-04 | 3.00e-03 | 51 |
| GO:190002420 | Esophagus | ESCC | regulation of substrate adhesion-dependent cell spreading | 38/8552 | 57/18723 | 1.11e-03 | 5.56e-03 | 38 |
| GO:00025442 | Esophagus | ESCC | chronic inflammatory response | 15/8552 | 18/18723 | 1.20e-03 | 5.88e-03 | 15 |
| GO:003444620 | Esophagus | ESCC | substrate adhesion-dependent cell spreading | 65/8552 | 108/18723 | 1.67e-03 | 7.72e-03 | 65 |
| GO:0002467 | Esophagus | ESCC | germinal center formation | 12/8552 | 14/18723 | 2.51e-03 | 1.08e-02 | 12 |
| GO:190002620 | Esophagus | ESCC | positive regulation of substrate adhesion-dependent cell spreading | 28/8552 | 41/18723 | 2.88e-03 | 1.21e-02 | 28 |
| GO:0022604112 | Thyroid | PTC | regulation of cell morphogenesis | 165/5968 | 309/18723 | 2.60e-15 | 1.82e-13 | 165 |
| GO:005165620 | Thyroid | PTC | establishment of organelle localization | 193/5968 | 390/18723 | 2.21e-13 | 1.15e-11 | 193 |
| GO:0010810112 | Thyroid | PTC | regulation of cell-substrate adhesion | 113/5968 | 221/18723 | 1.87e-09 | 5.28e-08 | 113 |
| Page: 1 2 3 |
| Pathway ID | Tissue | Disease Stage | Description | Gene Ratio | Bg Ratio | pvalue | p.adjust | qvalue | Count |
| Page: 1 |
Top |
Cell-cell communication analysis |
| Identification of potential cell-cell interactions between two cell types and their ligand-receptor pairs for different disease states |
| Ligand | Receptor | LRpair | Pathway | Tissue | Disease Stage |
| Page: 1 |
Top |
Single-cell gene regulatory network inference analysis |
| Find out the significant the regulons (TFs) and the target genes of each regulon across cell types for different disease states |
| TF | Cell Type | Tissue | Disease Stage | Target Gene | RSS | Regulon Activity |
| ∗The dot plots of a searched regulon are shown for all cell subpopulations in each disease state of each tissue based on the regulon specific score inferred using pySCENIC and by calculating the average expression. |
| Page: 1 |
Top |
Somatic mutation of malignant transformation related genes |
| Annotation of somatic variants for genes involved in malignant transformation |
| Hugo Symbol | Variant Class | Variant Classification | dbSNP RS | HGVSc | HGVSp | HGVSp Short | SWISSPROT | BIOTYPE | SIFT | PolyPhen | Tumor Sample Barcode | Tissue | Histology | Sex | Age | Stage | Therapy Types | Drugs | Outcome |
| UNC13D | SNV | Missense_Mutation | c.736N>A | p.Val246Met | p.V246M | Q70J99 | protein_coding | deleterious(0) | possibly_damaging(0.724) | TCGA-A8-A09Z-01 | Breast | breast invasive carcinoma | Female | >=65 | I/II | Unknown | Unknown | SD | |
| UNC13D | SNV | Missense_Mutation | c.1244N>T | p.Ser415Phe | p.S415F | Q70J99 | protein_coding | deleterious(0.04) | possibly_damaging(0.503) | TCGA-C8-A26X-01 | Breast | breast invasive carcinoma | Female | <65 | I/II | Chemotherapy | 5-fluorouracil | CR | |
| UNC13D | SNV | Missense_Mutation | rs560279707 | c.3230N>A | p.Arg1077Gln | p.R1077Q | Q70J99 | protein_coding | deleterious(0) | probably_damaging(0.998) | TCGA-C8-A8HR-01 | Breast | breast invasive carcinoma | Female | <65 | III/IV | Chemotherapy | 5-fluorouracil | CR |
| UNC13D | SNV | Missense_Mutation | rs774176637 | c.761G>A | p.Arg254His | p.R254H | Q70J99 | protein_coding | tolerated(0.9) | benign(0) | TCGA-D8-A1XK-01 | Breast | breast invasive carcinoma | Female | <65 | I/II | Chemotherapy | doxorubicine+cyclophosphamide | SD |
| UNC13D | SNV | Missense_Mutation | novel | c.2823N>A | p.Asp941Glu | p.D941E | Q70J99 | protein_coding | deleterious(0) | probably_damaging(0.989) | TCGA-GM-A2DN-01 | Breast | breast invasive carcinoma | Female | <65 | I/II | Chemotherapy | taxol | CR |
| UNC13D | insertion | Frame_Shift_Ins | novel | c.612_613insGGTGGAATGGTGGTGCGGCTGGAGAC | p.Trp205GlyfsTer53 | p.W205Gfs*53 | Q70J99 | protein_coding | TCGA-A8-A09D-01 | Breast | breast invasive carcinoma | Female | <65 | I/II | Chemotherapy | doxorubicin | CR | ||
| UNC13D | deletion | Frame_Shift_Del | novel | c.498delN | p.Glu167ArgfsTer82 | p.E167Rfs*82 | Q70J99 | protein_coding | TCGA-D8-A27V-01 | Breast | breast invasive carcinoma | Female | <65 | I/II | Hormone Therapy | tamoxiphen | SD | ||
| UNC13D | SNV | Missense_Mutation | c.421N>C | p.Glu141Gln | p.E141Q | Q70J99 | protein_coding | tolerated(0.38) | possibly_damaging(0.772) | TCGA-EK-A2PG-01 | Cervix | cervical & endocervical cancer | Female | >=65 | I/II | Unknown | Unknown | SD | |
| UNC13D | SNV | Missense_Mutation | rs776737156 | c.3049G>A | p.Glu1017Lys | p.E1017K | Q70J99 | protein_coding | deleterious(0) | probably_damaging(0.996) | TCGA-JW-A5VL-01 | Cervix | cervical & endocervical cancer | Female | <65 | I/II | Unknown | Unknown | SD |
| UNC13D | SNV | Missense_Mutation | novel | c.787N>A | p.Leu263Met | p.L263M | Q70J99 | protein_coding | deleterious(0) | probably_damaging(0.997) | TCGA-UC-A7PG-06 | Cervix | cervical & endocervical cancer | Female | <65 | III/IV | Chemotherapy | cisplatin | PD |
| Page: 1 2 3 4 5 6 7 8 9 |
Top |
Related drugs of malignant transformation related genes |
| Identification of chemicals and drugs interact with genes involved in malignant transfromation |
| (DGIdb 4.0) |
| Entrez ID | Symbol | Category | Interaction Types | Drug Claim Name | Drug Name | PMIDs |
| 201294 | UNC13D | NA | emapalumab | EMAPALUMAB | ||
| 201294 | UNC13D | NA | Emapalumab-lzsg | EMAPALUMAB |
| Page: 1 |

Copyright 2023-Present -The University of Texas Health Science Center at Houston |