
|
|||||
|
 | |
| |
| |
| |
| |
| |
|
Gene: UNC13B |
Gene summary for UNC13B |
| Gene information | Species | Human | Gene symbol | UNC13B | Gene ID | 10497 |
| Gene name | unc-13 homolog B | |
| Gene Alias | MUNC13 | |
| Cytomap | 9p13.3 | |
| Gene Type | protein-coding | GO ID | GO:0000003 | UniProtAcc | O14795 |
Top |
Malignant transformation analysis |
| Identification of the aberrant gene expression in precancerous and cancerous lesions by comparing the gene expression of stem-like cells in diseased tissues with normal stem cells |
| Entrez ID | Symbol | Replicates | Species | Organ | Tissue | Adj P-value | Log2FC | Malignancy |
| 10497 | UNC13B | HTA11_3410_2000001011 | Human | Colorectum | AD | 4.83e-05 | -3.14e-01 | 0.0155 |
| 10497 | UNC13B | HTA11_99999970781_79442 | Human | Colorectum | MSS | 1.03e-07 | -3.71e-01 | 0.294 |
| 10497 | UNC13B | HTA11_99999973899_84307 | Human | Colorectum | MSS | 7.16e-09 | -7.30e-01 | 0.2585 |
| 10497 | UNC13B | HTA11_99999974143_84620 | Human | Colorectum | MSS | 1.22e-26 | -7.24e-01 | 0.3005 |
| 10497 | UNC13B | A015-C-203 | Human | Colorectum | FAP | 4.12e-27 | -5.02e-01 | -0.1294 |
| 10497 | UNC13B | A015-C-204 | Human | Colorectum | FAP | 6.25e-06 | -2.65e-01 | -0.0228 |
| 10497 | UNC13B | A014-C-040 | Human | Colorectum | FAP | 8.84e-04 | -2.28e-01 | -0.1184 |
| 10497 | UNC13B | A002-C-201 | Human | Colorectum | FAP | 8.75e-14 | -2.92e-01 | 0.0324 |
| 10497 | UNC13B | A001-C-119 | Human | Colorectum | FAP | 1.06e-08 | -4.90e-01 | -0.1557 |
| 10497 | UNC13B | A001-C-108 | Human | Colorectum | FAP | 8.99e-12 | -1.36e-01 | -0.0272 |
| 10497 | UNC13B | A002-C-205 | Human | Colorectum | FAP | 6.59e-26 | -5.56e-01 | -0.1236 |
| 10497 | UNC13B | A015-C-005 | Human | Colorectum | FAP | 1.57e-03 | -2.05e-01 | -0.0336 |
| 10497 | UNC13B | A015-C-006 | Human | Colorectum | FAP | 2.93e-19 | -5.00e-01 | -0.0994 |
| 10497 | UNC13B | A015-C-106 | Human | Colorectum | FAP | 1.66e-06 | -2.47e-01 | -0.0511 |
| 10497 | UNC13B | A002-C-114 | Human | Colorectum | FAP | 1.10e-20 | -4.82e-01 | -0.1561 |
| 10497 | UNC13B | A015-C-104 | Human | Colorectum | FAP | 1.66e-30 | -4.18e-01 | -0.1899 |
| 10497 | UNC13B | A001-C-014 | Human | Colorectum | FAP | 1.21e-09 | -2.52e-01 | 0.0135 |
| 10497 | UNC13B | A002-C-016 | Human | Colorectum | FAP | 3.22e-22 | -4.07e-01 | 0.0521 |
| 10497 | UNC13B | A015-C-002 | Human | Colorectum | FAP | 3.99e-13 | -3.56e-01 | -0.0763 |
| 10497 | UNC13B | A001-C-007 | Human | Colorectum | CRC | 2.53e-05 | -5.85e-01 | 0.1899 |
| Page: 1 2 3 4 5 |
| Tissue | Expression Dynamics | Abbreviation |
| Colorectum (GSE201348) | 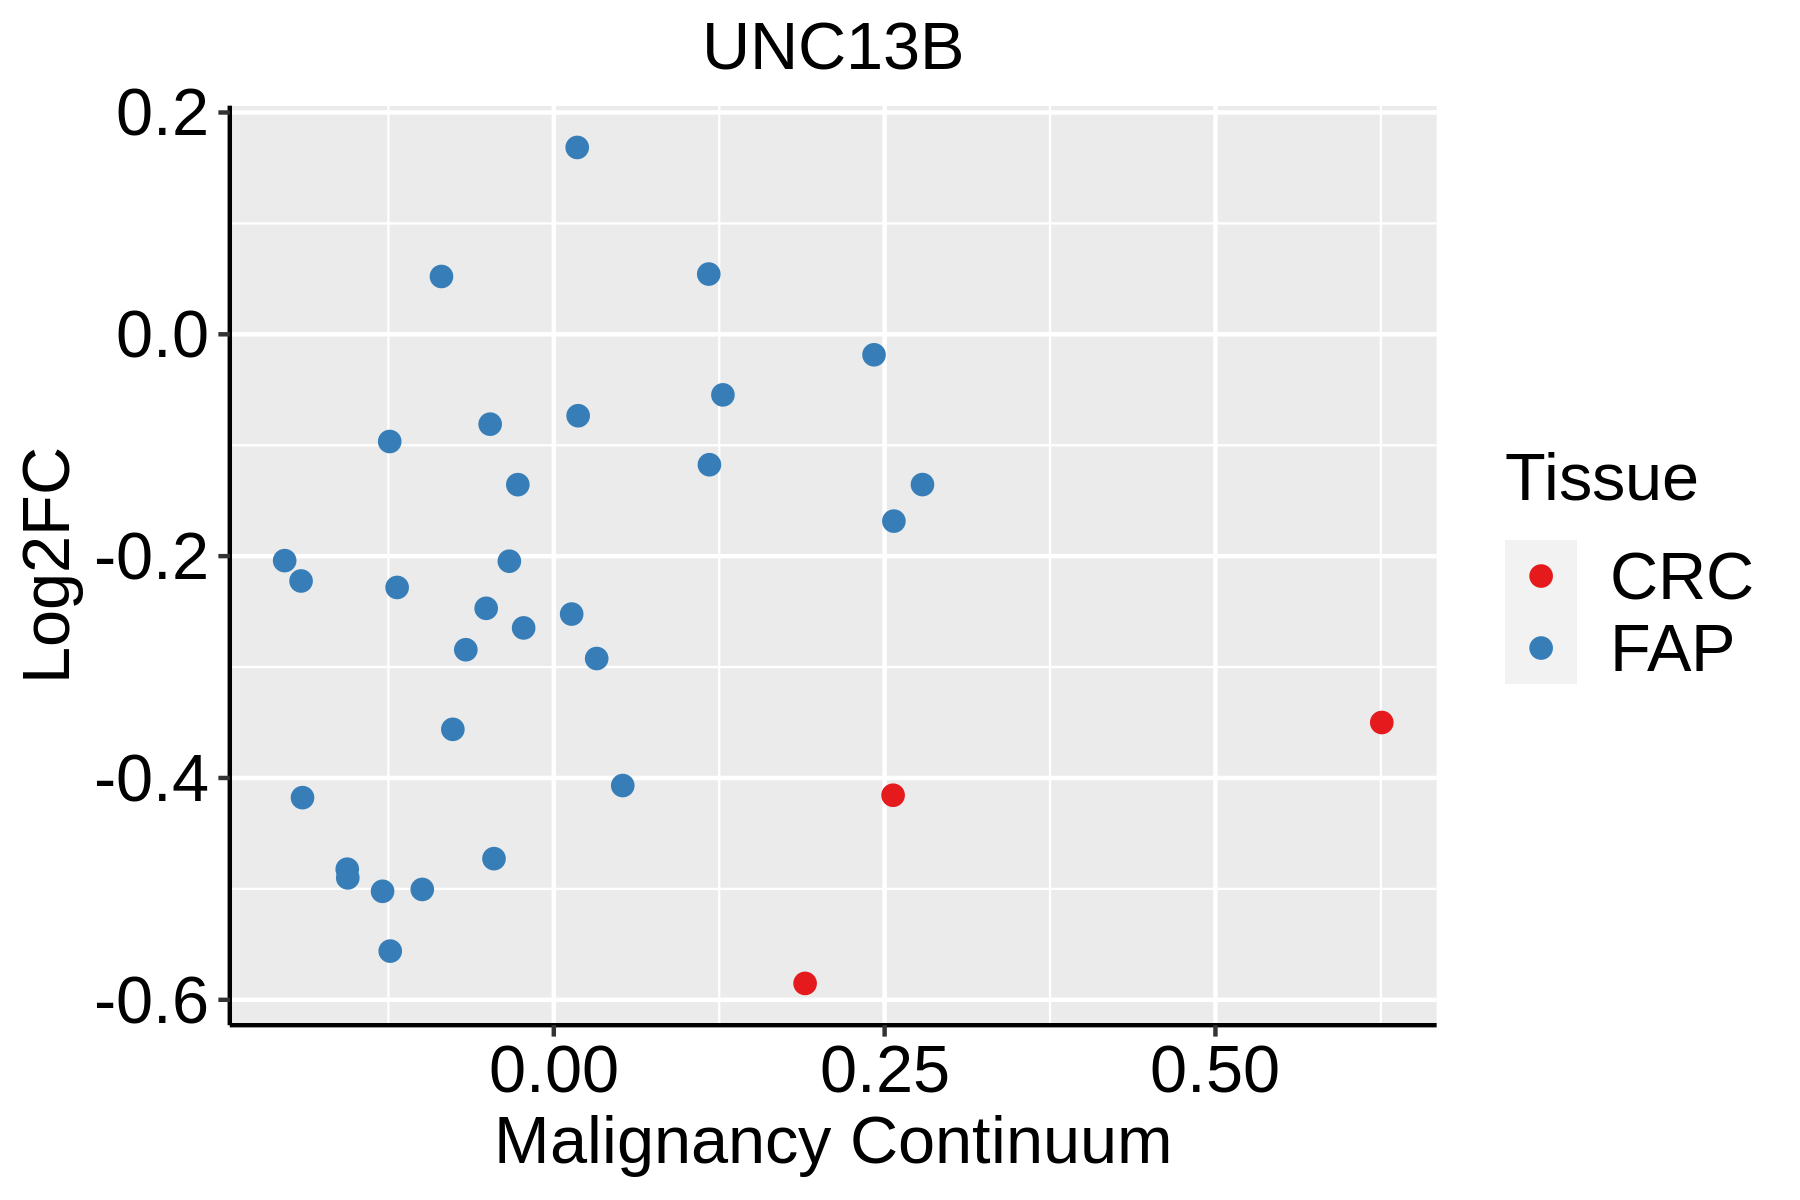 | FAP: Familial adenomatous polyposis |
| CRC: Colorectal cancer | ||
| Colorectum (HTA11) |  | AD: Adenomas |
| SER: Sessile serrated lesions | ||
| MSI-H: Microsatellite-high colorectal cancer | ||
| MSS: Microsatellite stable colorectal cancer | ||
| Esophagus |  | ESCC: Esophageal squamous cell carcinoma |
| HGIN: High-grade intraepithelial neoplasias | ||
| LGIN: Low-grade intraepithelial neoplasias | ||
| Lung |  | AAH: Atypical adenomatous hyperplasia |
| AIS: Adenocarcinoma in situ | ||
| IAC: Invasive lung adenocarcinoma | ||
| MIA: Minimally invasive adenocarcinoma |
| ∗log2FC in expression of this searched gene in stem-like cells from each diseased tissue sample relative to stem-like cells in normal samples in each tissue plotted against the malignancy continuum. Samples are colored based on if they are from different disease stage. |
Top |
Malignant transformation related pathway analysis |
| Find out the enriched GO biological processes and KEGG pathways involved in transition from healthy to precancer to cancer |
| Tissue | Disease Stage | Enriched GO biological Processes |
| Colorectum | AD |  |
| Colorectum | SER |  |
| Colorectum | MSS |  |
| Colorectum | MSI-H |  |
| Colorectum | FAP |  |
| ∗Top 15 enriched GO BP terms are showed in the bar plot of each disease state in each tissue. Each row represents a significant GO biological process which is colored according to the -log10(p.adjust). |
| Page: 1 2 3 4 5 6 7 8 9 |
| GO ID | Tissue | Disease Stage | Description | Gene Ratio | Bg Ratio | pvalue | p.adjust | Count |
| GO:0043254 | Colorectum | AD | regulation of protein-containing complex assembly | 148/3918 | 428/18723 | 2.64e-11 | 3.18e-09 | 148 |
| GO:0031334 | Colorectum | AD | positive regulation of protein-containing complex assembly | 91/3918 | 237/18723 | 4.78e-10 | 3.99e-08 | 91 |
| GO:1904951 | Colorectum | AD | positive regulation of establishment of protein localization | 112/3918 | 319/18723 | 2.55e-09 | 1.80e-07 | 112 |
| GO:0051222 | Colorectum | AD | positive regulation of protein transport | 106/3918 | 303/18723 | 8.45e-09 | 5.08e-07 | 106 |
| GO:0016050 | Colorectum | AD | vesicle organization | 101/3918 | 300/18723 | 1.65e-07 | 7.17e-06 | 101 |
| GO:0009743 | Colorectum | AD | response to carbohydrate | 86/3918 | 253/18723 | 8.43e-07 | 2.90e-05 | 86 |
| GO:0034284 | Colorectum | AD | response to monosaccharide | 76/3918 | 225/18723 | 4.64e-06 | 1.23e-04 | 76 |
| GO:0033500 | Colorectum | AD | carbohydrate homeostasis | 84/3918 | 259/18723 | 9.10e-06 | 2.15e-04 | 84 |
| GO:0009746 | Colorectum | AD | response to hexose | 73/3918 | 219/18723 | 1.20e-05 | 2.65e-04 | 73 |
| GO:0009749 | Colorectum | AD | response to glucose | 71/3918 | 212/18723 | 1.31e-05 | 2.85e-04 | 71 |
| GO:0042593 | Colorectum | AD | glucose homeostasis | 83/3918 | 258/18723 | 1.44e-05 | 3.11e-04 | 83 |
| GO:0001678 | Colorectum | AD | cellular glucose homeostasis | 60/3918 | 172/18723 | 1.49e-05 | 3.18e-04 | 60 |
| GO:0071322 | Colorectum | AD | cellular response to carbohydrate stimulus | 56/3918 | 163/18723 | 4.61e-05 | 7.97e-04 | 56 |
| GO:0050708 | Colorectum | AD | regulation of protein secretion | 83/3918 | 268/18723 | 6.59e-05 | 1.07e-03 | 83 |
| GO:0071333 | Colorectum | AD | cellular response to glucose stimulus | 52/3918 | 151/18723 | 7.88e-05 | 1.25e-03 | 52 |
| GO:0009306 | Colorectum | AD | protein secretion | 105/3918 | 359/18723 | 1.05e-04 | 1.57e-03 | 105 |
| GO:0071331 | Colorectum | AD | cellular response to hexose stimulus | 52/3918 | 153/18723 | 1.16e-04 | 1.71e-03 | 52 |
| GO:0035592 | Colorectum | AD | establishment of protein localization to extracellular region | 105/3918 | 360/18723 | 1.18e-04 | 1.73e-03 | 105 |
| GO:0071326 | Colorectum | AD | cellular response to monosaccharide stimulus | 52/3918 | 154/18723 | 1.40e-04 | 1.98e-03 | 52 |
| GO:0071692 | Colorectum | AD | protein localization to extracellular region | 106/3918 | 368/18723 | 1.86e-04 | 2.49e-03 | 106 |
| Page: 1 2 3 4 5 6 7 8 |
| Pathway ID | Tissue | Disease Stage | Description | Gene Ratio | Bg Ratio | pvalue | p.adjust | qvalue | Count |
| Page: 1 |
Top |
Cell-cell communication analysis |
| Identification of potential cell-cell interactions between two cell types and their ligand-receptor pairs for different disease states |
| Ligand | Receptor | LRpair | Pathway | Tissue | Disease Stage |
| Page: 1 |
Top |
Single-cell gene regulatory network inference analysis |
| Find out the significant the regulons (TFs) and the target genes of each regulon across cell types for different disease states |
| TF | Cell Type | Tissue | Disease Stage | Target Gene | RSS | Regulon Activity |
| ∗The dot plots of a searched regulon are shown for all cell subpopulations in each disease state of each tissue based on the regulon specific score inferred using pySCENIC and by calculating the average expression. |
| Page: 1 |
Top |
Somatic mutation of malignant transformation related genes |
| Annotation of somatic variants for genes involved in malignant transformation |
| Hugo Symbol | Variant Class | Variant Classification | dbSNP RS | HGVSc | HGVSp | HGVSp Short | SWISSPROT | BIOTYPE | SIFT | PolyPhen | Tumor Sample Barcode | Tissue | Histology | Sex | Age | Stage | Therapy Types | Drugs | Outcome |
| UNC13B | SNV | Missense_Mutation | novel | c.3284N>C | p.Gly1095Ala | p.G1095A | O14795 | protein_coding | deleterious(0) | probably_damaging(0.999) | TCGA-5L-AAT1-01 | Breast | breast invasive carcinoma | Female | <65 | III/IV | Hormone Therapy | letrozol | SD |
| UNC13B | SNV | Missense_Mutation | c.74C>T | p.Thr25Ile | p.T25I | O14795 | protein_coding | deleterious_low_confidence(0) | probably_damaging(0.985) | TCGA-A2-A0D1-01 | Breast | breast invasive carcinoma | Female | >=65 | I/II | Chemotherapy | taxotere | SD | |
| UNC13B | SNV | Missense_Mutation | c.2542N>T | p.Ala848Ser | p.A848S | O14795 | protein_coding | tolerated(0.18) | benign(0.067) | TCGA-A2-A0D4-01 | Breast | breast invasive carcinoma | Female | <65 | I/II | Chemotherapy | adriamycin | SD | |
| UNC13B | SNV | Missense_Mutation | c.202N>C | p.Gly68Arg | p.G68R | O14795 | protein_coding | deleterious_low_confidence(0) | probably_damaging(1) | TCGA-AC-A23H-01 | Breast | breast invasive carcinoma | Female | >=65 | I/II | Unknown | Unknown | PD | |
| UNC13B | SNV | Missense_Mutation | c.1477N>A | p.Glu493Lys | p.E493K | O14795 | protein_coding | deleterious(0) | probably_damaging(0.964) | TCGA-AC-A23H-01 | Breast | breast invasive carcinoma | Female | >=65 | I/II | Unknown | Unknown | PD | |
| UNC13B | SNV | Missense_Mutation | rs770226679 | c.665C>T | p.Ser222Leu | p.S222L | O14795 | protein_coding | tolerated_low_confidence(0.69) | benign(0) | TCGA-AO-A128-01 | Breast | breast invasive carcinoma | Female | <65 | I/II | Chemotherapy | doxorubicin | SD |
| UNC13B | SNV | Missense_Mutation | rs542947932 | c.1462C>G | p.Pro488Ala | p.P488A | O14795 | protein_coding | deleterious(0) | probably_damaging(0.999) | TCGA-B6-A0IM-01 | Breast | breast invasive carcinoma | Female | >=65 | I/II | Unknown | Unknown | SD |
| UNC13B | SNV | Missense_Mutation | rs576351913 | c.4543N>T | p.His1515Tyr | p.H1515Y | O14795 | protein_coding | tolerated(0.32) | possibly_damaging(0.616) | TCGA-BH-A0B4-01 | Breast | breast invasive carcinoma | Male | >=65 | III/IV | Hormone Therapy | tamoxiphen | SD |
| UNC13B | SNV | Missense_Mutation | novel | c.3157G>C | p.Val1053Leu | p.V1053L | O14795 | protein_coding | tolerated(0.05) | benign(0.007) | TCGA-BH-A1FC-01 | Breast | breast invasive carcinoma | Female | >=65 | I/II | Unknown | Unknown | SD |
| UNC13B | SNV | Missense_Mutation | c.355N>T | p.His119Tyr | p.H119Y | O14795 | protein_coding | deleterious_low_confidence(0) | probably_damaging(0.996) | TCGA-D8-A1J8-01 | Breast | breast invasive carcinoma | Female | >=65 | I/II | Hormone Therapy | nolvadex | SD |
| Page: 1 2 3 4 5 6 7 8 9 10 11 12 13 14 15 16 17 |
Top |
Related drugs of malignant transformation related genes |
| Identification of chemicals and drugs interact with genes involved in malignant transfromation |
| (DGIdb 4.0) |
| Entrez ID | Symbol | Category | Interaction Types | Drug Claim Name | Drug Name | PMIDs |
| Page: 1 |

Copyright 2023-Present -The University of Texas Health Science Center at Houston |