
|
|||||
|
 | |
| |
| |
| |
| |
| |
|
Gene: UNC119 |
Gene summary for UNC119 |
| Gene information | Species | Human | Gene symbol | UNC119 | Gene ID | 9094 |
| Gene name | unc-119 lipid binding chaperone | |
| Gene Alias | HRG4 | |
| Cytomap | 17q11.2 | |
| Gene Type | protein-coding | GO ID | GO:0000278 | UniProtAcc | K7EN86 |
Top |
Malignant transformation analysis |
| Identification of the aberrant gene expression in precancerous and cancerous lesions by comparing the gene expression of stem-like cells in diseased tissues with normal stem cells |
| Entrez ID | Symbol | Replicates | Species | Organ | Tissue | Adj P-value | Log2FC | Malignancy |
| 9094 | UNC119 | LZE2T | Human | Esophagus | ESCC | 5.80e-03 | 4.14e-01 | 0.082 |
| 9094 | UNC119 | LZE4T | Human | Esophagus | ESCC | 2.01e-12 | 4.06e-01 | 0.0811 |
| 9094 | UNC119 | LZE7T | Human | Esophagus | ESCC | 2.29e-16 | 7.82e-01 | 0.0667 |
| 9094 | UNC119 | LZE8T | Human | Esophagus | ESCC | 1.82e-07 | 2.34e-01 | 0.067 |
| 9094 | UNC119 | LZE22T | Human | Esophagus | ESCC | 1.12e-04 | 2.56e-01 | 0.068 |
| 9094 | UNC119 | LZE24T | Human | Esophagus | ESCC | 2.38e-23 | 6.95e-01 | 0.0596 |
| 9094 | UNC119 | LZE21T | Human | Esophagus | ESCC | 6.11e-05 | 5.33e-01 | 0.0655 |
| 9094 | UNC119 | LZE6T | Human | Esophagus | ESCC | 7.80e-05 | 3.17e-01 | 0.0845 |
| 9094 | UNC119 | P1T-E | Human | Esophagus | ESCC | 1.32e-12 | 7.37e-01 | 0.0875 |
| 9094 | UNC119 | P2T-E | Human | Esophagus | ESCC | 2.83e-33 | 6.00e-01 | 0.1177 |
| 9094 | UNC119 | P4T-E | Human | Esophagus | ESCC | 2.04e-45 | 1.03e+00 | 0.1323 |
| 9094 | UNC119 | P5T-E | Human | Esophagus | ESCC | 7.33e-30 | 5.03e-01 | 0.1327 |
| 9094 | UNC119 | P8T-E | Human | Esophagus | ESCC | 9.59e-32 | 5.41e-01 | 0.0889 |
| 9094 | UNC119 | P9T-E | Human | Esophagus | ESCC | 1.01e-18 | 4.59e-01 | 0.1131 |
| 9094 | UNC119 | P10T-E | Human | Esophagus | ESCC | 1.20e-49 | 8.91e-01 | 0.116 |
| 9094 | UNC119 | P11T-E | Human | Esophagus | ESCC | 1.27e-15 | 7.75e-01 | 0.1426 |
| 9094 | UNC119 | P12T-E | Human | Esophagus | ESCC | 2.10e-30 | 6.24e-01 | 0.1122 |
| 9094 | UNC119 | P15T-E | Human | Esophagus | ESCC | 1.62e-37 | 7.78e-01 | 0.1149 |
| 9094 | UNC119 | P16T-E | Human | Esophagus | ESCC | 8.81e-34 | 6.17e-01 | 0.1153 |
| 9094 | UNC119 | P17T-E | Human | Esophagus | ESCC | 1.77e-09 | 3.07e-01 | 0.1278 |
| Page: 1 2 3 4 5 |
| Tissue | Expression Dynamics | Abbreviation |
| Esophagus | 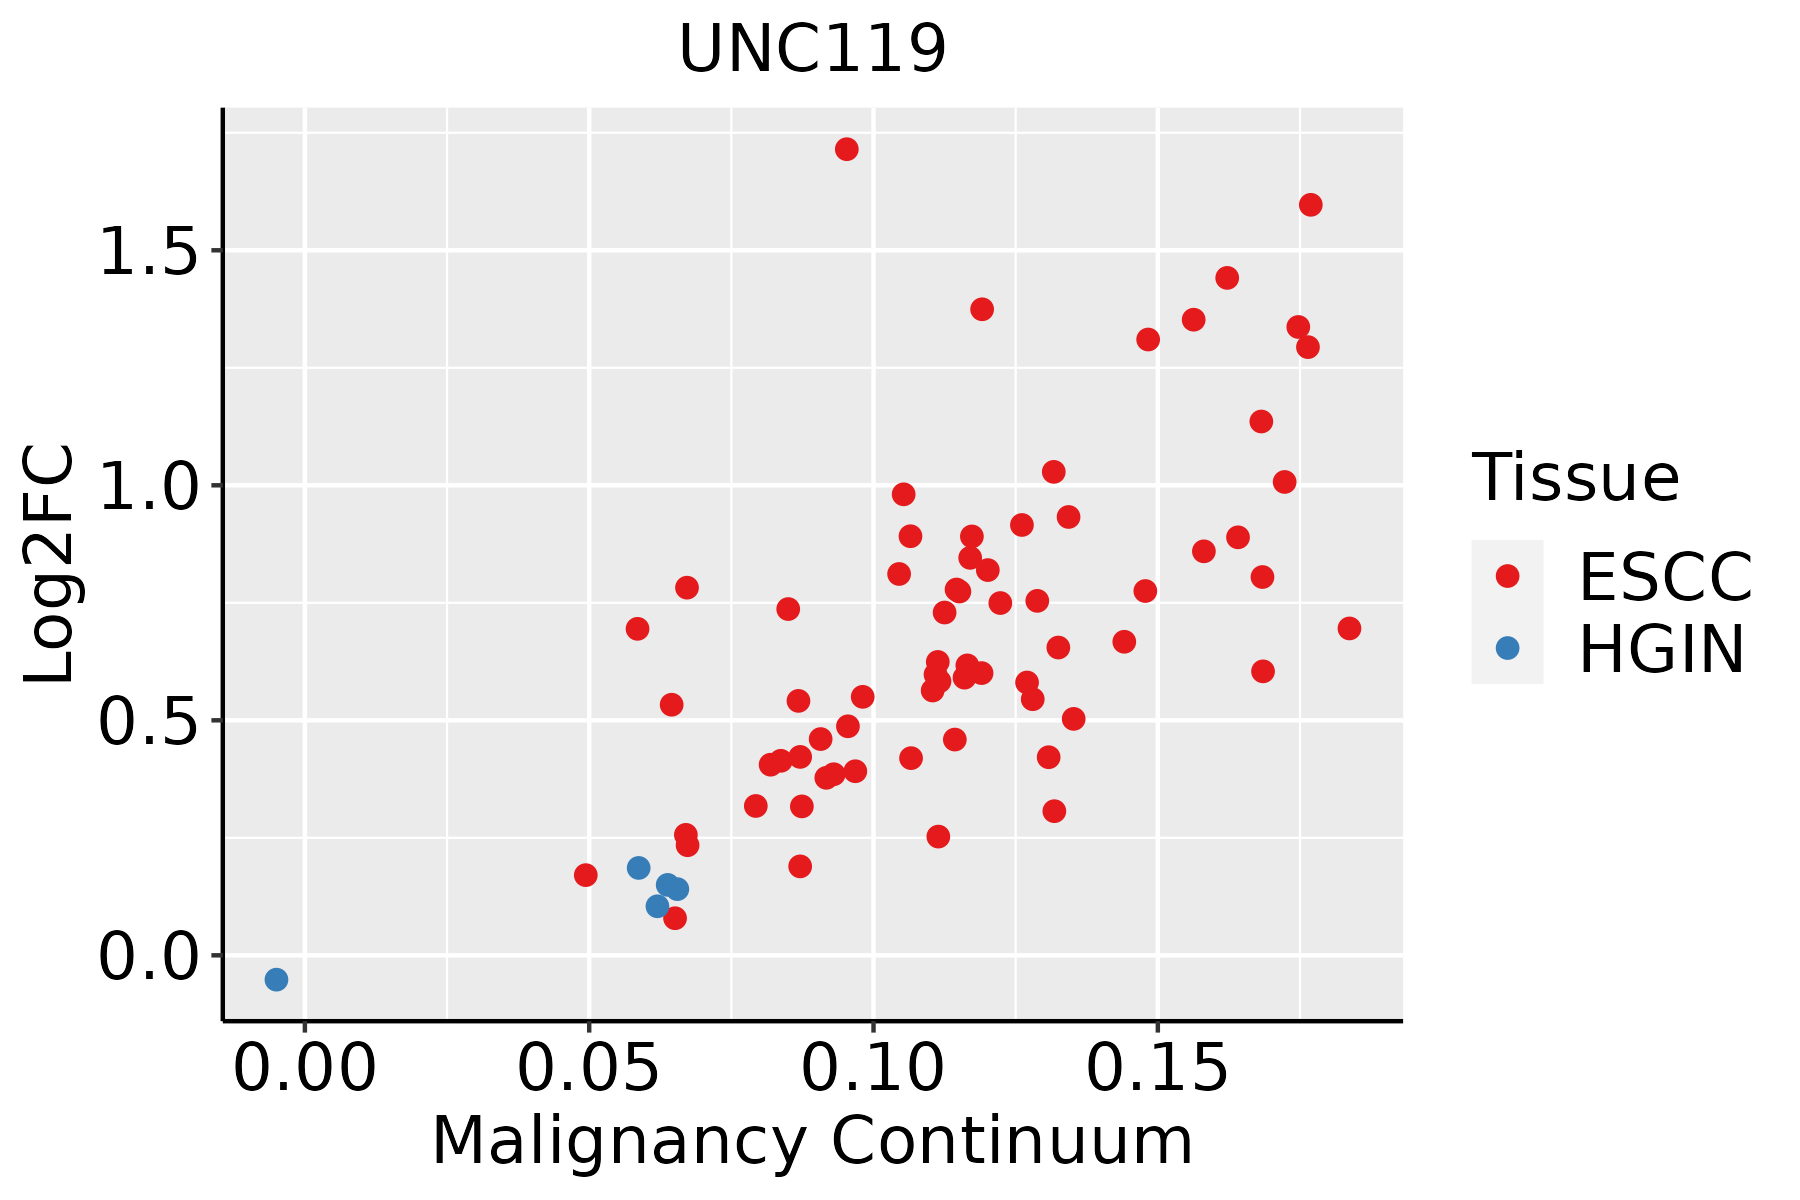 | ESCC: Esophageal squamous cell carcinoma |
| HGIN: High-grade intraepithelial neoplasias | ||
| LGIN: Low-grade intraepithelial neoplasias | ||
| Liver |  | HCC: Hepatocellular carcinoma |
| NAFLD: Non-alcoholic fatty liver disease | ||
| Oral Cavity | 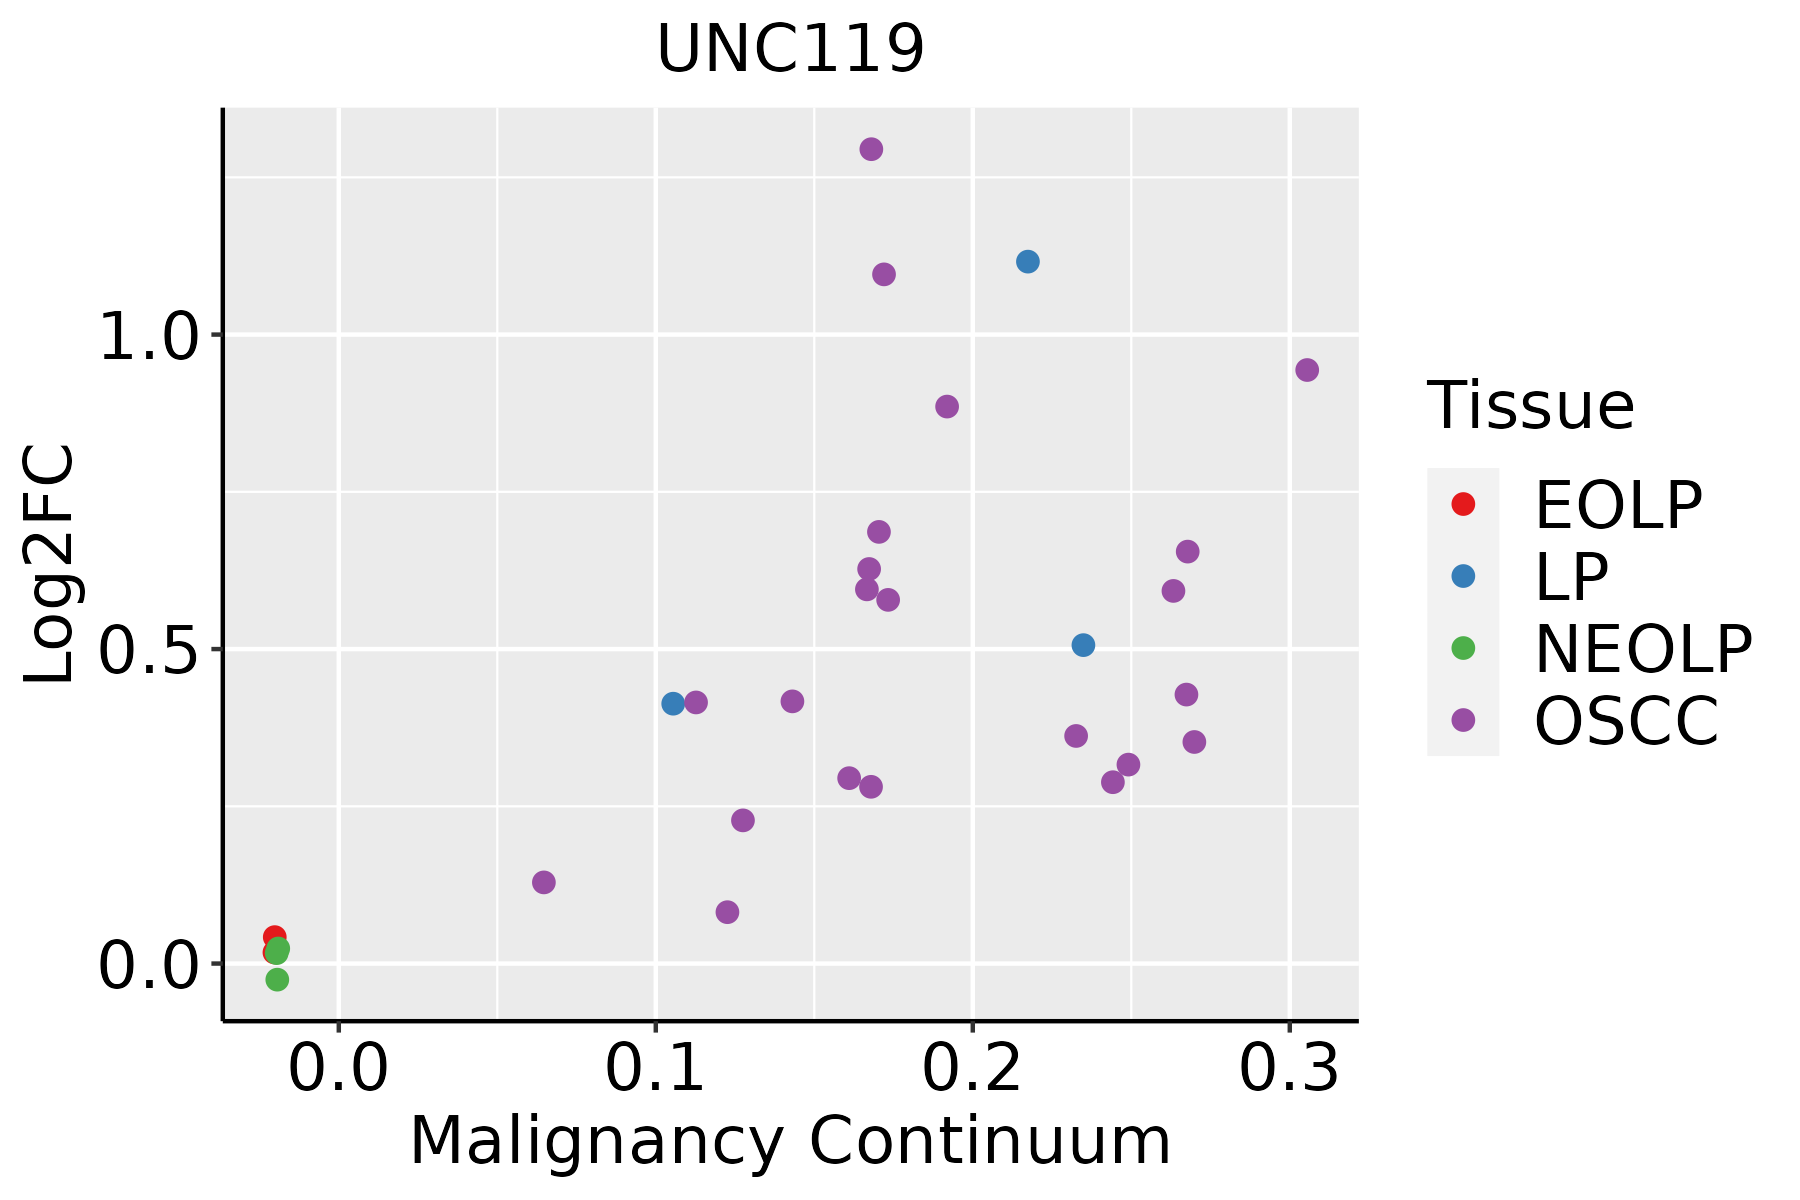 | EOLP: Erosive Oral lichen planus |
| LP: leukoplakia | ||
| NEOLP: Non-erosive oral lichen planus | ||
| OSCC: Oral squamous cell carcinoma |
| ∗log2FC in expression of this searched gene in stem-like cells from each diseased tissue sample relative to stem-like cells in normal samples in each tissue plotted against the malignancy continuum. Samples are colored based on if they are from different disease stage. |
Top |
Malignant transformation related pathway analysis |
| Find out the enriched GO biological processes and KEGG pathways involved in transition from healthy to precancer to cancer |
| Tissue | Disease Stage | Enriched GO biological Processes |
| Colorectum | AD |  |
| Colorectum | SER |  |
| Colorectum | MSS |  |
| Colorectum | MSI-H |  |
| Colorectum | FAP |  |
| ∗Top 15 enriched GO BP terms are showed in the bar plot of each disease state in each tissue. Each row represents a significant GO biological process which is colored according to the -log10(p.adjust). |
| Page: 1 2 3 4 5 6 7 8 9 |
| GO ID | Tissue | Disease Stage | Description | Gene Ratio | Bg Ratio | pvalue | p.adjust | Count |
| GO:000931419 | Esophagus | ESCC | response to radiation | 277/8552 | 456/18723 | 4.42e-11 | 1.43e-09 | 277 |
| GO:000028115 | Esophagus | ESCC | mitotic cytokinesis | 58/8552 | 71/18723 | 4.34e-10 | 1.15e-08 | 58 |
| GO:000091016 | Esophagus | ESCC | cytokinesis | 115/8552 | 173/18723 | 2.48e-08 | 4.68e-07 | 115 |
| GO:003010018 | Esophagus | ESCC | regulation of endocytosis | 135/8552 | 211/18723 | 5.75e-08 | 1.02e-06 | 135 |
| GO:006164015 | Esophagus | ESCC | cytoskeleton-dependent cytokinesis | 72/8552 | 100/18723 | 8.10e-08 | 1.39e-06 | 72 |
| GO:004586018 | Esophagus | ESCC | positive regulation of protein kinase activity | 219/8552 | 386/18723 | 6.91e-06 | 6.97e-05 | 219 |
| GO:003367420 | Esophagus | ESCC | positive regulation of kinase activity | 260/8552 | 467/18723 | 7.26e-06 | 7.22e-05 | 260 |
| GO:000941611 | Esophagus | ESCC | response to light stimulus | 183/8552 | 320/18723 | 2.03e-05 | 1.76e-04 | 183 |
| GO:000689818 | Esophagus | ESCC | receptor-mediated endocytosis | 142/8552 | 244/18723 | 5.22e-05 | 4.05e-04 | 142 |
| GO:007258314 | Esophagus | ESCC | clathrin-dependent endocytosis | 34/8552 | 47/18723 | 1.91e-04 | 1.21e-03 | 34 |
| GO:00182124 | Esophagus | ESCC | peptidyl-tyrosine modification | 202/8552 | 378/18723 | 1.34e-03 | 6.39e-03 | 202 |
| GO:00181084 | Esophagus | ESCC | peptidyl-tyrosine phosphorylation | 200/8552 | 375/18723 | 1.60e-03 | 7.45e-03 | 200 |
| GO:004825916 | Esophagus | ESCC | regulation of receptor-mediated endocytosis | 66/8552 | 110/18723 | 1.72e-03 | 7.96e-03 | 66 |
| GO:00507303 | Esophagus | ESCC | regulation of peptidyl-tyrosine phosphorylation | 144/8552 | 264/18723 | 2.22e-03 | 9.78e-03 | 144 |
| GO:00610972 | Esophagus | ESCC | regulation of protein tyrosine kinase activity | 55/8552 | 90/18723 | 2.27e-03 | 9.99e-03 | 55 |
| GO:00725841 | Esophagus | ESCC | caveolin-mediated endocytosis | 10/8552 | 12/18723 | 8.94e-03 | 3.12e-02 | 10 |
| GO:000028111 | Liver | HCC | mitotic cytokinesis | 51/7958 | 71/18723 | 5.20e-07 | 8.38e-06 | 51 |
| GO:000091011 | Liver | HCC | cytokinesis | 100/7958 | 173/18723 | 3.38e-05 | 3.39e-04 | 100 |
| GO:000689821 | Liver | HCC | receptor-mediated endocytosis | 134/7958 | 244/18723 | 5.73e-05 | 5.31e-04 | 134 |
| GO:003010021 | Liver | HCC | regulation of endocytosis | 117/7958 | 211/18723 | 9.56e-05 | 8.32e-04 | 117 |
| Page: 1 2 3 |
| Pathway ID | Tissue | Disease Stage | Description | Gene Ratio | Bg Ratio | pvalue | p.adjust | qvalue | Count |
| Page: 1 |
Top |
Cell-cell communication analysis |
| Identification of potential cell-cell interactions between two cell types and their ligand-receptor pairs for different disease states |
| Ligand | Receptor | LRpair | Pathway | Tissue | Disease Stage |
| Page: 1 |
Top |
Single-cell gene regulatory network inference analysis |
| Find out the significant the regulons (TFs) and the target genes of each regulon across cell types for different disease states |
| TF | Cell Type | Tissue | Disease Stage | Target Gene | RSS | Regulon Activity |
| ∗The dot plots of a searched regulon are shown for all cell subpopulations in each disease state of each tissue based on the regulon specific score inferred using pySCENIC and by calculating the average expression. |
| Page: 1 |
Top |
Somatic mutation of malignant transformation related genes |
| Annotation of somatic variants for genes involved in malignant transformation |
| Hugo Symbol | Variant Class | Variant Classification | dbSNP RS | HGVSc | HGVSp | HGVSp Short | SWISSPROT | BIOTYPE | SIFT | PolyPhen | Tumor Sample Barcode | Tissue | Histology | Sex | Age | Stage | Therapy Types | Drugs | Outcome |
| UNC119 | SNV | Missense_Mutation | c.253N>G | p.Lys85Glu | p.K85E | Q13432 | protein_coding | tolerated(0.4) | benign(0.007) | TCGA-A2-A0YJ-01 | Breast | breast invasive carcinoma | Female | <65 | III/IV | Chemotherapy | cytoxan | PD | |
| UNC119 | insertion | Frame_Shift_Ins | novel | c.226_227insGCCACCCGTATGAGACCCAGTCTGACAGCTTCTACTTCGTG | p.Leu76ArgfsTer79 | p.L76Rfs*79 | Q13432 | protein_coding | TCGA-A8-A06X-01 | Breast | breast invasive carcinoma | Female | >=65 | I/II | Unknown | Unknown | SD | ||
| UNC119 | SNV | Missense_Mutation | rs761823478 | c.379N>T | p.Arg127Cys | p.R127C | Q13432 | protein_coding | deleterious(0.02) | probably_damaging(0.998) | TCGA-AZ-4315-01 | Colorectum | colon adenocarcinoma | Male | <65 | I/II | Unknown | Unknown | SD |
| UNC119 | SNV | Missense_Mutation | rs772710984 | c.526N>A | p.Asp176Asn | p.D176N | Q13432 | protein_coding | deleterious(0) | probably_damaging(1) | TCGA-A5-A0G1-01 | Endometrium | uterine corpus endometrioid carcinoma | Female | >=65 | I/II | Unknown | Unknown | SD |
| UNC119 | SNV | Missense_Mutation | c.479N>A | p.Arg160His | p.R160H | Q13432 | protein_coding | deleterious(0.01) | probably_damaging(1) | TCGA-AX-A05Z-01 | Endometrium | uterine corpus endometrioid carcinoma | Female | <65 | III/IV | Chemotherapy | adriamycin | SD | |
| UNC119 | SNV | Missense_Mutation | rs749424586 | c.632N>T | p.Pro211Leu | p.P211L | Q13432 | protein_coding | deleterious(0) | probably_damaging(1) | TCGA-AX-A2HD-01 | Endometrium | uterine corpus endometrioid carcinoma | Female | >=65 | III/IV | Unknown | Unknown | SD |
| UNC119 | SNV | Missense_Mutation | c.694G>T | p.Ala232Ser | p.A232S | Q13432 | protein_coding | deleterious(0) | probably_damaging(1) | TCGA-B5-A0JY-01 | Endometrium | uterine corpus endometrioid carcinoma | Female | <65 | III/IV | Chemotherapy | doxorubicin | SD | |
| UNC119 | SNV | Missense_Mutation | novel | c.487G>A | p.Glu163Lys | p.E163K | Q13432 | protein_coding | deleterious(0) | probably_damaging(0.998) | TCGA-B5-A3FC-01 | Endometrium | uterine corpus endometrioid carcinoma | Female | <65 | I/II | Unknown | Unknown | SD |
| UNC119 | SNV | Missense_Mutation | rs761823478 | c.379C>T | p.Arg127Cys | p.R127C | Q13432 | protein_coding | deleterious(0.02) | probably_damaging(0.998) | TCGA-BK-A6W3-01 | Endometrium | uterine corpus endometrioid carcinoma | Female | <65 | I/II | Unknown | Unknown | SD |
| UNC119 | SNV | Missense_Mutation | novel | c.481N>G | p.Met161Val | p.M161V | Q13432 | protein_coding | deleterious(0) | probably_damaging(0.979) | TCGA-BS-A0TJ-01 | Endometrium | uterine corpus endometrioid carcinoma | Female | <65 | I/II | Unknown | Unknown | SD |
| Page: 1 2 |
Top |
Related drugs of malignant transformation related genes |
| Identification of chemicals and drugs interact with genes involved in malignant transfromation |
| (DGIdb 4.0) |
| Entrez ID | Symbol | Category | Interaction Types | Drug Claim Name | Drug Name | PMIDs |
| 9094 | UNC119 | KINASE | 374883853 |
| Page: 1 |

Copyright 2023-Present -The University of Texas Health Science Center at Houston |