
|
|||||
|
 | |
| |
| |
| |
| |
| |
|
Gene: UMPS |
Gene summary for UMPS |
| Gene information | Species | Human | Gene symbol | UMPS | Gene ID | 7372 |
| Gene name | uridine monophosphate synthetase | |
| Gene Alias | OPRT | |
| Cytomap | 3q21.2 | |
| Gene Type | protein-coding | GO ID | GO:0000003 | UniProtAcc | A8K5J1 |
Top |
Malignant transformation analysis |
| Identification of the aberrant gene expression in precancerous and cancerous lesions by comparing the gene expression of stem-like cells in diseased tissues with normal stem cells |
| Entrez ID | Symbol | Replicates | Species | Organ | Tissue | Adj P-value | Log2FC | Malignancy |
| 7372 | UMPS | CCI_3 | Human | Cervix | CC | 5.69e-06 | 5.19e-01 | 0.516 |
| 7372 | UMPS | LZE2T | Human | Esophagus | ESCC | 5.60e-06 | 5.95e-01 | 0.082 |
| 7372 | UMPS | LZE4T | Human | Esophagus | ESCC | 1.79e-07 | 2.54e-01 | 0.0811 |
| 7372 | UMPS | LZE7T | Human | Esophagus | ESCC | 3.31e-12 | 5.86e-01 | 0.0667 |
| 7372 | UMPS | LZE24T | Human | Esophagus | ESCC | 2.44e-08 | 2.30e-01 | 0.0596 |
| 7372 | UMPS | P1T-E | Human | Esophagus | ESCC | 1.28e-06 | 3.95e-01 | 0.0875 |
| 7372 | UMPS | P2T-E | Human | Esophagus | ESCC | 3.23e-15 | 4.56e-01 | 0.1177 |
| 7372 | UMPS | P4T-E | Human | Esophagus | ESCC | 1.21e-13 | 3.04e-01 | 0.1323 |
| 7372 | UMPS | P5T-E | Human | Esophagus | ESCC | 1.41e-23 | 5.70e-01 | 0.1327 |
| 7372 | UMPS | P8T-E | Human | Esophagus | ESCC | 2.22e-17 | 3.98e-01 | 0.0889 |
| 7372 | UMPS | P9T-E | Human | Esophagus | ESCC | 1.09e-21 | 4.78e-01 | 0.1131 |
| 7372 | UMPS | P10T-E | Human | Esophagus | ESCC | 6.34e-37 | 6.73e-01 | 0.116 |
| 7372 | UMPS | P11T-E | Human | Esophagus | ESCC | 2.35e-10 | 4.50e-01 | 0.1426 |
| 7372 | UMPS | P12T-E | Human | Esophagus | ESCC | 2.32e-21 | 3.96e-01 | 0.1122 |
| 7372 | UMPS | P15T-E | Human | Esophagus | ESCC | 1.41e-32 | 6.56e-01 | 0.1149 |
| 7372 | UMPS | P16T-E | Human | Esophagus | ESCC | 1.44e-31 | 6.14e-01 | 0.1153 |
| 7372 | UMPS | P17T-E | Human | Esophagus | ESCC | 5.60e-07 | 3.43e-01 | 0.1278 |
| 7372 | UMPS | P19T-E | Human | Esophagus | ESCC | 2.19e-04 | 4.72e-01 | 0.1662 |
| 7372 | UMPS | P20T-E | Human | Esophagus | ESCC | 3.39e-15 | 3.33e-01 | 0.1124 |
| 7372 | UMPS | P21T-E | Human | Esophagus | ESCC | 3.07e-21 | 4.58e-01 | 0.1617 |
| Page: 1 2 3 4 5 |
| Tissue | Expression Dynamics | Abbreviation |
| Cervix | 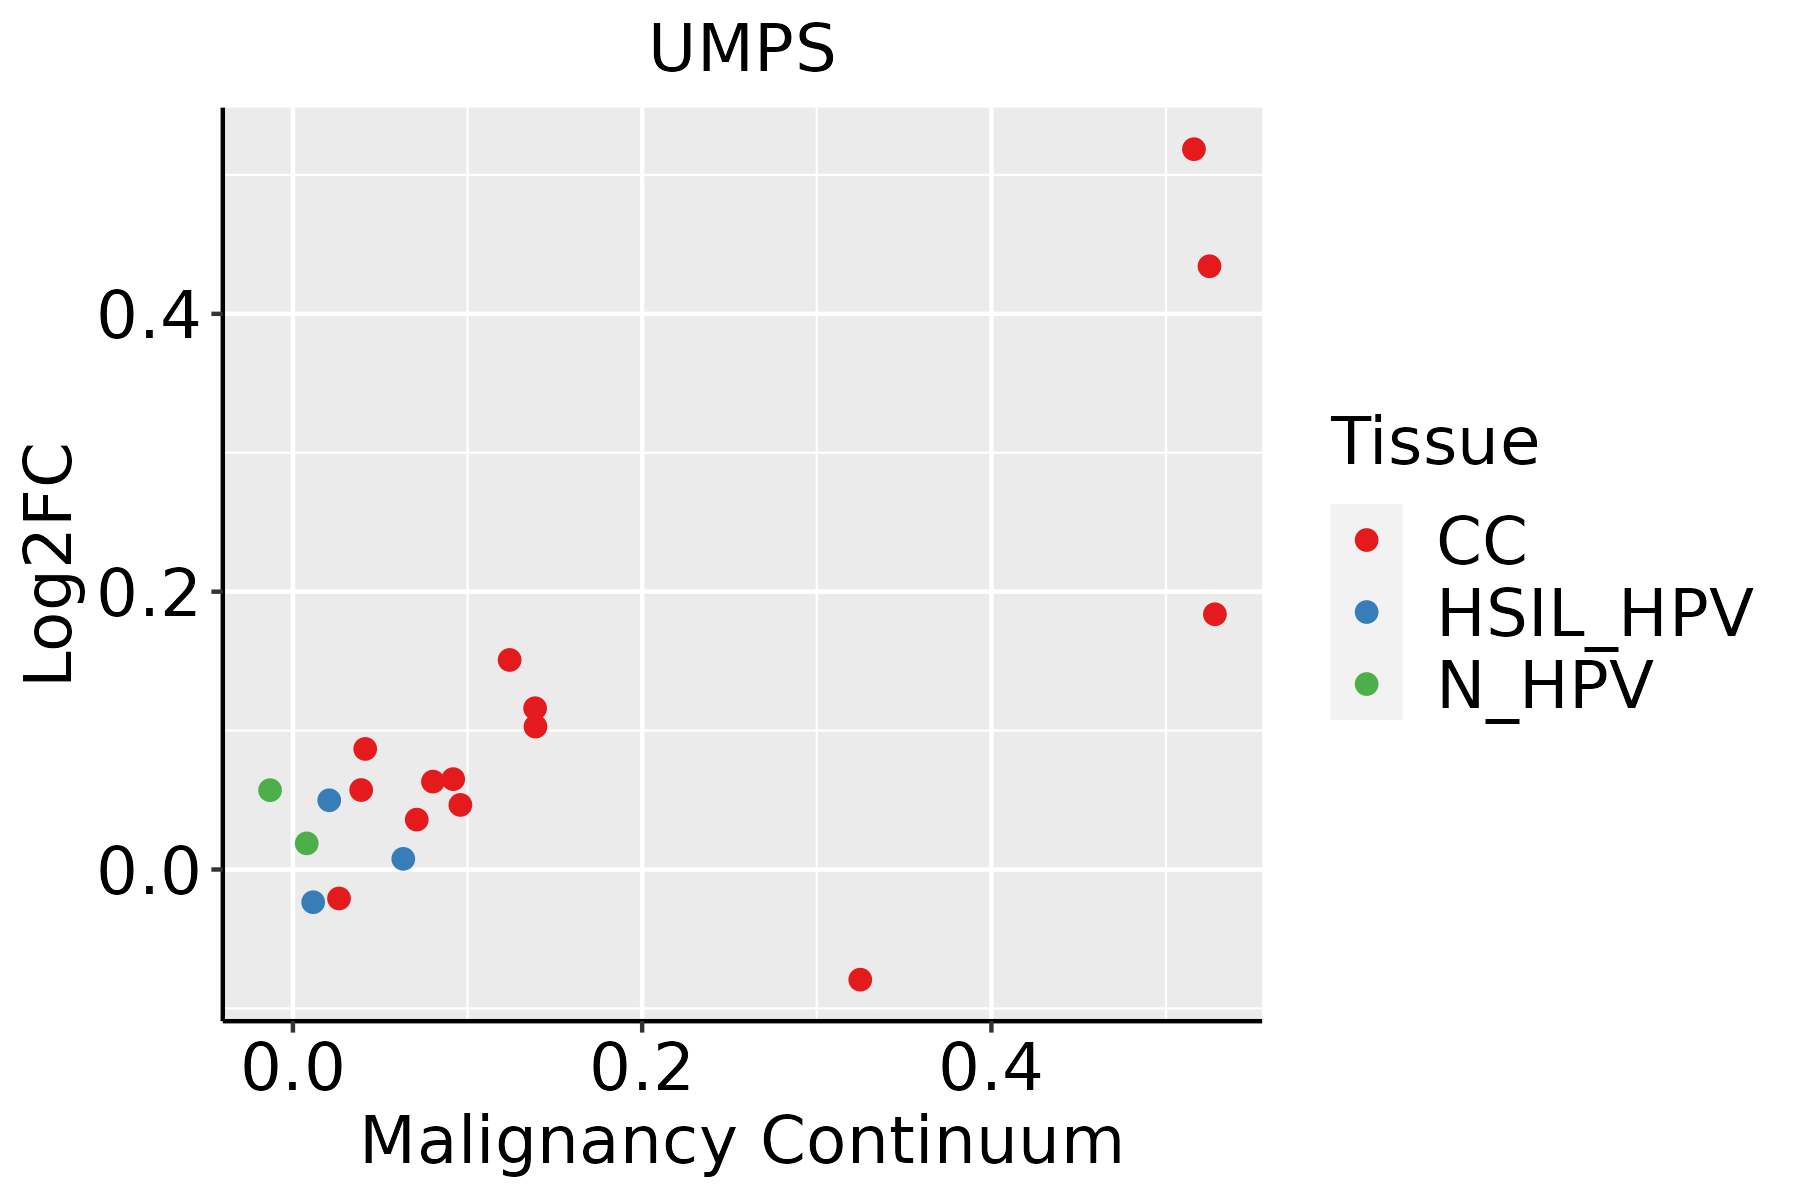 | CC: Cervix cancer |
| HSIL_HPV: HPV-infected high-grade squamous intraepithelial lesions | ||
| N_HPV: HPV-infected normal cervix | ||
| Esophagus | 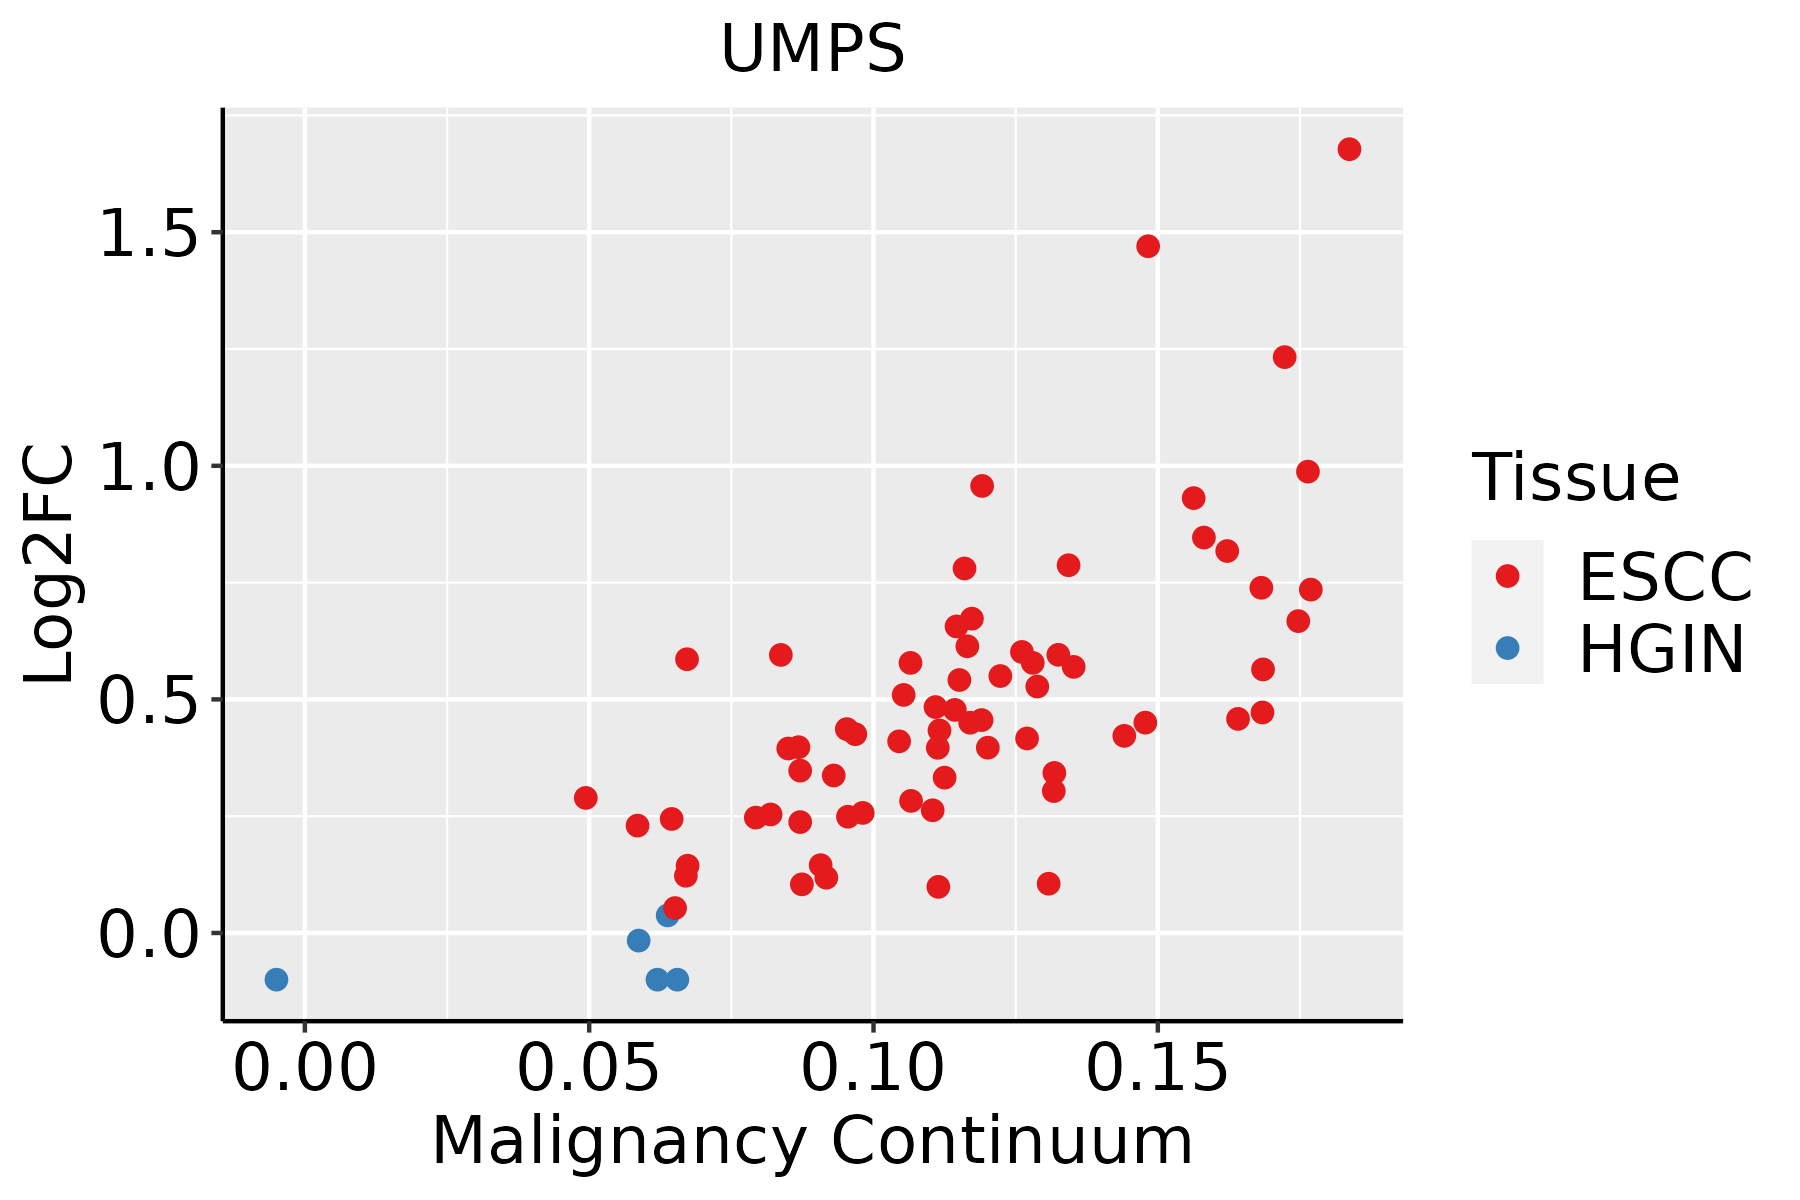 | ESCC: Esophageal squamous cell carcinoma |
| HGIN: High-grade intraepithelial neoplasias | ||
| LGIN: Low-grade intraepithelial neoplasias | ||
| Liver |  | HCC: Hepatocellular carcinoma |
| NAFLD: Non-alcoholic fatty liver disease | ||
| Oral Cavity |  | EOLP: Erosive Oral lichen planus |
| LP: leukoplakia | ||
| NEOLP: Non-erosive oral lichen planus | ||
| OSCC: Oral squamous cell carcinoma | ||
| Skin | 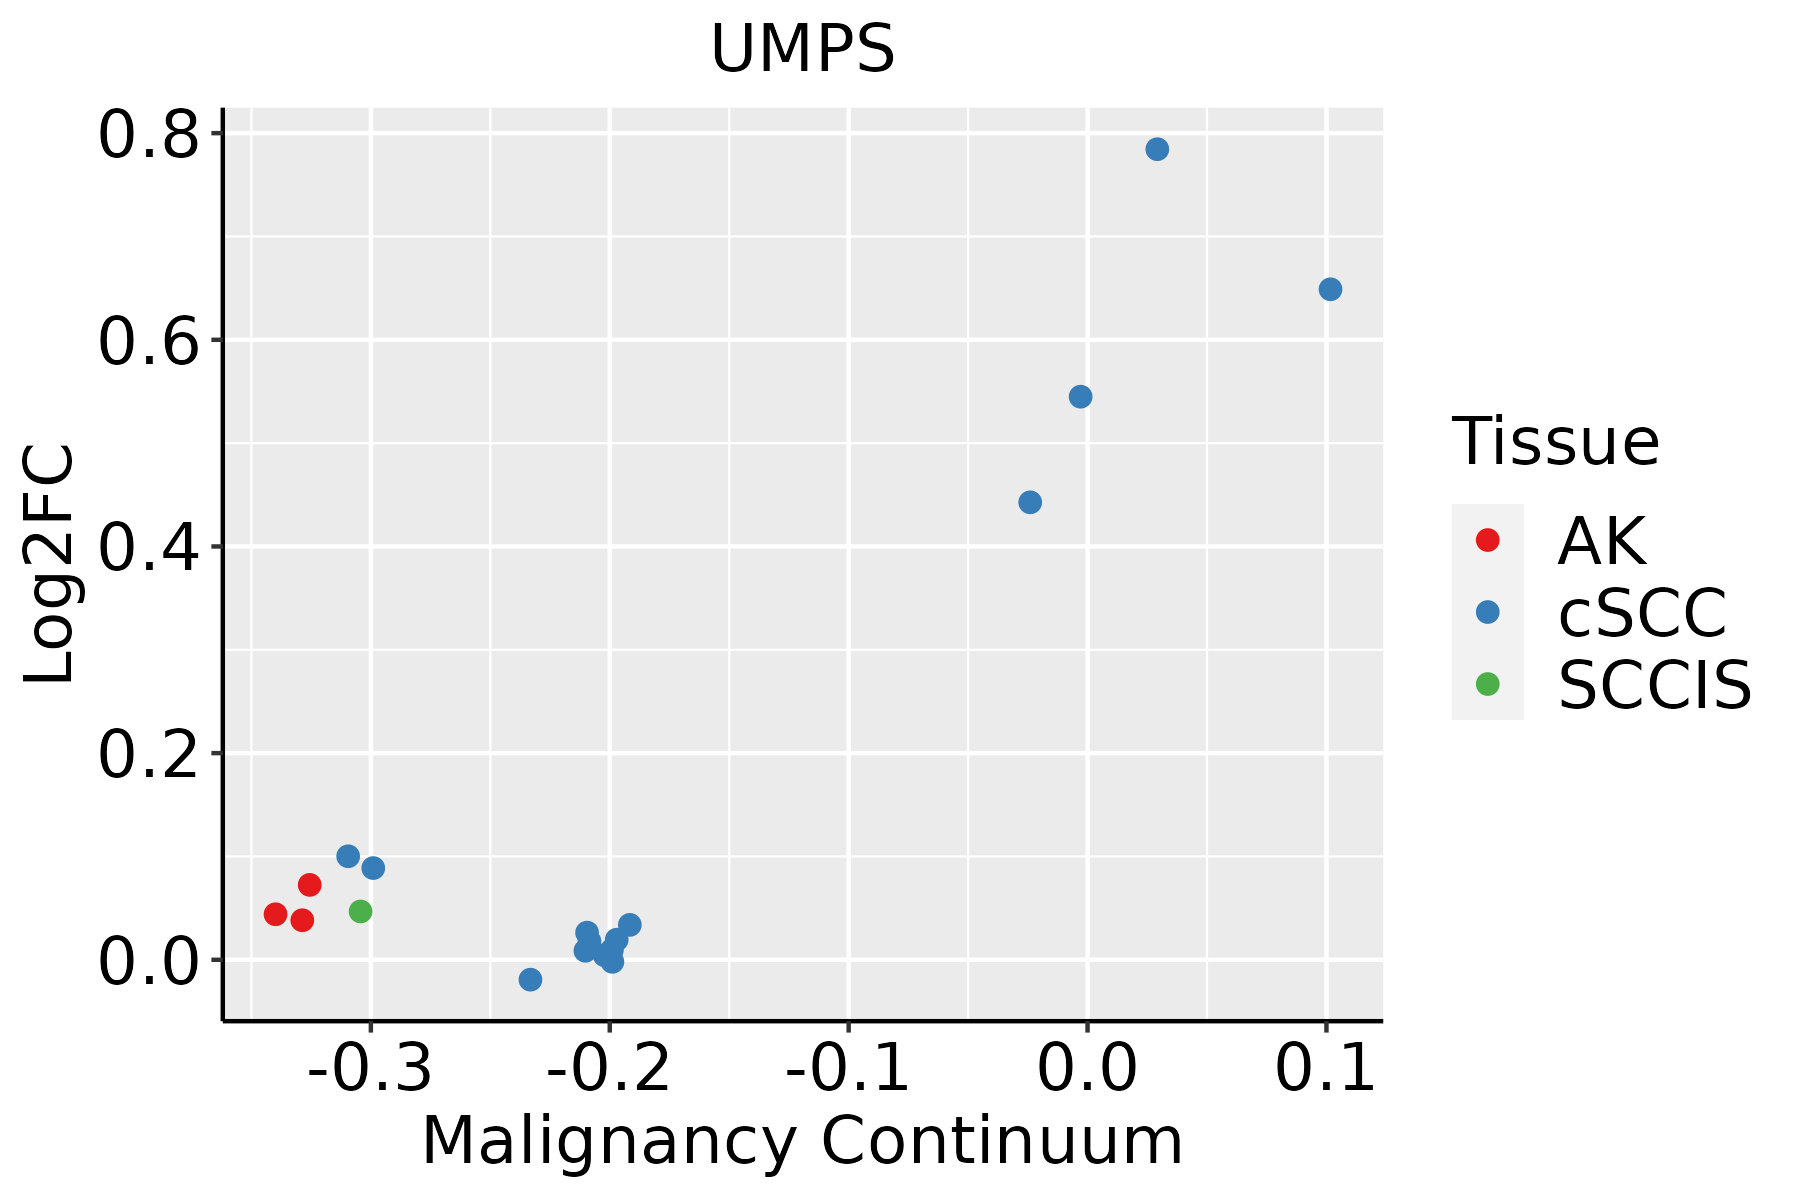 | AK: Actinic keratosis |
| cSCC: Cutaneous squamous cell carcinoma | ||
| SCCIS:squamous cell carcinoma in situ |
| ∗log2FC in expression of this searched gene in stem-like cells from each diseased tissue sample relative to stem-like cells in normal samples in each tissue plotted against the malignancy continuum. Samples are colored based on if they are from different disease stage. |
Top |
Malignant transformation related pathway analysis |
| Find out the enriched GO biological processes and KEGG pathways involved in transition from healthy to precancer to cancer |
| Tissue | Disease Stage | Enriched GO biological Processes |
| Colorectum | AD |  |
| Colorectum | SER |  |
| Colorectum | MSS |  |
| Colorectum | MSI-H |  |
| Colorectum | FAP |  |
| ∗Top 15 enriched GO BP terms are showed in the bar plot of each disease state in each tissue. Each row represents a significant GO biological process which is colored according to the -log10(p.adjust). |
| Page: 1 2 3 4 5 6 7 8 9 |
| GO ID | Tissue | Disease Stage | Description | Gene Ratio | Bg Ratio | pvalue | p.adjust | Count |
| GO:005087810 | Cervix | CC | regulation of body fluid levels | 78/2311 | 379/18723 | 3.20e-06 | 8.77e-05 | 78 |
| GO:004873210 | Cervix | CC | gland development | 84/2311 | 436/18723 | 1.93e-05 | 3.54e-04 | 84 |
| GO:00075654 | Cervix | CC | female pregnancy | 43/2311 | 193/18723 | 7.62e-05 | 1.04e-03 | 43 |
| GO:00447064 | Cervix | CC | multi-multicellular organism process | 45/2311 | 220/18723 | 4.14e-04 | 4.21e-03 | 45 |
| GO:00196939 | Cervix | CC | ribose phosphate metabolic process | 72/2311 | 396/18723 | 4.49e-04 | 4.48e-03 | 72 |
| GO:00092599 | Cervix | CC | ribonucleotide metabolic process | 70/2311 | 385/18723 | 5.35e-04 | 5.18e-03 | 70 |
| GO:00463908 | Cervix | CC | ribose phosphate biosynthetic process | 39/2311 | 190/18723 | 9.02e-04 | 7.77e-03 | 39 |
| GO:00092608 | Cervix | CC | ribonucleotide biosynthetic process | 37/2311 | 182/18723 | 1.44e-03 | 1.13e-02 | 37 |
| GO:00094109 | Cervix | CC | response to xenobiotic stimulus | 78/2311 | 462/18723 | 2.39e-03 | 1.70e-02 | 78 |
| GO:00308797 | Cervix | CC | mammary gland development | 28/2311 | 137/18723 | 4.74e-03 | 2.83e-02 | 28 |
| GO:000911710 | Cervix | CC | nucleotide metabolic process | 79/2311 | 489/18723 | 7.16e-03 | 3.85e-02 | 79 |
| GO:0048732111 | Esophagus | ESCC | gland development | 269/8552 | 436/18723 | 7.81e-12 | 2.95e-10 | 269 |
| GO:0006753110 | Esophagus | ESCC | nucleoside phosphate metabolic process | 288/8552 | 497/18723 | 1.80e-08 | 3.50e-07 | 288 |
| GO:0019693111 | Esophagus | ESCC | ribose phosphate metabolic process | 234/8552 | 396/18723 | 4.24e-08 | 7.76e-07 | 234 |
| GO:0009117111 | Esophagus | ESCC | nucleotide metabolic process | 282/8552 | 489/18723 | 4.70e-08 | 8.50e-07 | 282 |
| GO:0009259111 | Esophagus | ESCC | ribonucleotide metabolic process | 224/8552 | 385/18723 | 4.41e-07 | 6.00e-06 | 224 |
| GO:0046390110 | Esophagus | ESCC | ribose phosphate biosynthetic process | 119/8552 | 190/18723 | 1.73e-06 | 2.06e-05 | 119 |
| GO:000916516 | Esophagus | ESCC | nucleotide biosynthetic process | 150/8552 | 254/18723 | 1.12e-05 | 1.06e-04 | 150 |
| GO:0009260110 | Esophagus | ESCC | ribonucleotide biosynthetic process | 112/8552 | 182/18723 | 1.12e-05 | 1.06e-04 | 112 |
| GO:190129316 | Esophagus | ESCC | nucleoside phosphate biosynthetic process | 151/8552 | 256/18723 | 1.15e-05 | 1.08e-04 | 151 |
| Page: 1 2 3 4 5 6 7 8 9 |
| Pathway ID | Tissue | Disease Stage | Description | Gene Ratio | Bg Ratio | pvalue | p.adjust | qvalue | Count |
| hsa012405 | Esophagus | ESCC | Biosynthesis of cofactors | 97/4205 | 153/8465 | 3.88e-04 | 1.35e-03 | 6.94e-04 | 97 |
| hsa002405 | Esophagus | ESCC | Pyrimidine metabolism | 41/4205 | 58/8465 | 9.14e-04 | 2.92e-03 | 1.49e-03 | 41 |
| hsa0124012 | Esophagus | ESCC | Biosynthesis of cofactors | 97/4205 | 153/8465 | 3.88e-04 | 1.35e-03 | 6.94e-04 | 97 |
| hsa0024012 | Esophagus | ESCC | Pyrimidine metabolism | 41/4205 | 58/8465 | 9.14e-04 | 2.92e-03 | 1.49e-03 | 41 |
| hsa01240 | Liver | Cirrhotic | Biosynthesis of cofactors | 66/2530 | 153/8465 | 3.11e-04 | 1.99e-03 | 1.23e-03 | 66 |
| hsa00240 | Liver | Cirrhotic | Pyrimidine metabolism | 27/2530 | 58/8465 | 5.31e-03 | 1.88e-02 | 1.16e-02 | 27 |
| hsa00983 | Liver | Cirrhotic | Drug metabolism - other enzymes | 34/2530 | 80/8465 | 1.08e-02 | 3.57e-02 | 2.20e-02 | 34 |
| hsa012401 | Liver | Cirrhotic | Biosynthesis of cofactors | 66/2530 | 153/8465 | 3.11e-04 | 1.99e-03 | 1.23e-03 | 66 |
| hsa002401 | Liver | Cirrhotic | Pyrimidine metabolism | 27/2530 | 58/8465 | 5.31e-03 | 1.88e-02 | 1.16e-02 | 27 |
| hsa009831 | Liver | Cirrhotic | Drug metabolism - other enzymes | 34/2530 | 80/8465 | 1.08e-02 | 3.57e-02 | 2.20e-02 | 34 |
| hsa012402 | Liver | HCC | Biosynthesis of cofactors | 103/4020 | 153/8465 | 4.67e-07 | 5.05e-06 | 2.81e-06 | 103 |
| hsa002402 | Liver | HCC | Pyrimidine metabolism | 44/4020 | 58/8465 | 9.34e-06 | 7.11e-05 | 3.95e-05 | 44 |
| hsa009832 | Liver | HCC | Drug metabolism - other enzymes | 54/4020 | 80/8465 | 2.25e-04 | 1.09e-03 | 6.08e-04 | 54 |
| hsa012403 | Liver | HCC | Biosynthesis of cofactors | 103/4020 | 153/8465 | 4.67e-07 | 5.05e-06 | 2.81e-06 | 103 |
| hsa002403 | Liver | HCC | Pyrimidine metabolism | 44/4020 | 58/8465 | 9.34e-06 | 7.11e-05 | 3.95e-05 | 44 |
| hsa009833 | Liver | HCC | Drug metabolism - other enzymes | 54/4020 | 80/8465 | 2.25e-04 | 1.09e-03 | 6.08e-04 | 54 |
| hsa012404 | Oral cavity | OSCC | Biosynthesis of cofactors | 88/3704 | 153/8465 | 3.84e-04 | 1.20e-03 | 6.12e-04 | 88 |
| hsa002404 | Oral cavity | OSCC | Pyrimidine metabolism | 37/3704 | 58/8465 | 1.62e-03 | 4.45e-03 | 2.26e-03 | 37 |
| hsa0124011 | Oral cavity | OSCC | Biosynthesis of cofactors | 88/3704 | 153/8465 | 3.84e-04 | 1.20e-03 | 6.12e-04 | 88 |
| hsa0024011 | Oral cavity | OSCC | Pyrimidine metabolism | 37/3704 | 58/8465 | 1.62e-03 | 4.45e-03 | 2.26e-03 | 37 |
| Page: 1 2 |
Top |
Cell-cell communication analysis |
| Identification of potential cell-cell interactions between two cell types and their ligand-receptor pairs for different disease states |
| Ligand | Receptor | LRpair | Pathway | Tissue | Disease Stage |
| Page: 1 |
Top |
Single-cell gene regulatory network inference analysis |
| Find out the significant the regulons (TFs) and the target genes of each regulon across cell types for different disease states |
| TF | Cell Type | Tissue | Disease Stage | Target Gene | RSS | Regulon Activity |
| ∗The dot plots of a searched regulon are shown for all cell subpopulations in each disease state of each tissue based on the regulon specific score inferred using pySCENIC and by calculating the average expression. |
| Page: 1 |
Top |
Somatic mutation of malignant transformation related genes |
| Annotation of somatic variants for genes involved in malignant transformation |
| Hugo Symbol | Variant Class | Variant Classification | dbSNP RS | HGVSc | HGVSp | HGVSp Short | SWISSPROT | BIOTYPE | SIFT | PolyPhen | Tumor Sample Barcode | Tissue | Histology | Sex | Age | Stage | Therapy Types | Drugs | Outcome |
| UMPS | SNV | Missense_Mutation | c.894N>C | p.Leu298Phe | p.L298F | P11172 | protein_coding | deleterious(0) | probably_damaging(0.975) | TCGA-A2-A0SY-01 | Breast | breast invasive carcinoma | Female | <65 | III/IV | Hormone Therapy | arimidex | SD | |
| UMPS | SNV | Missense_Mutation | c.459G>C | p.Leu153Phe | p.L153F | P11172 | protein_coding | deleterious(0.01) | possibly_damaging(0.864) | TCGA-A8-A08R-01 | Breast | breast invasive carcinoma | Female | <65 | I/II | Unknown | Unknown | SD | |
| UMPS | SNV | Missense_Mutation | rs779077289 | c.811N>C | p.Asp271His | p.D271H | P11172 | protein_coding | deleterious(0.01) | possibly_damaging(0.834) | TCGA-BH-A18V-01 | Breast | breast invasive carcinoma | Female | <65 | I/II | Unknown | Unknown | SD |
| UMPS | SNV | Missense_Mutation | c.1171G>A | p.Glu391Lys | p.E391K | P11172 | protein_coding | tolerated(0.15) | benign(0.096) | TCGA-LD-A74U-01 | Breast | breast invasive carcinoma | Female | >=65 | III/IV | Chemotherapy | taxotere | SD | |
| UMPS | SNV | Missense_Mutation | novel | c.688C>T | p.Arg230Cys | p.R230C | P11172 | protein_coding | deleterious(0) | probably_damaging(1) | TCGA-2W-A8YY-01 | Cervix | cervical & endocervical cancer | Female | <65 | I/II | Chemotherapy | cisplatin | CR |
| UMPS | SNV | Missense_Mutation | c.1171N>A | p.Glu391Lys | p.E391K | P11172 | protein_coding | tolerated(0.15) | benign(0.096) | TCGA-FU-A23L-01 | Cervix | cervical & endocervical cancer | Female | <65 | I/II | Chemotherapy | cisplatin | CR | |
| UMPS | SNV | Missense_Mutation | novel | c.20C>T | p.Ala7Val | p.A7V | P11172 | protein_coding | tolerated(0.08) | benign(0.001) | TCGA-AG-3892-01 | Colorectum | rectum adenocarcinoma | Female | <65 | I/II | Unknown | Unknown | SD |
| UMPS | SNV | Missense_Mutation | c.941A>C | p.Lys314Thr | p.K314T | P11172 | protein_coding | deleterious(0) | probably_damaging(1) | TCGA-AG-3892-01 | Colorectum | rectum adenocarcinoma | Female | <65 | I/II | Unknown | Unknown | SD | |
| UMPS | SNV | Missense_Mutation | novel | c.1267N>A | p.Ala423Thr | p.A423T | P11172 | protein_coding | tolerated(0.38) | benign(0.006) | TCGA-A5-A0G2-01 | Endometrium | uterine corpus endometrioid carcinoma | Female | <65 | III/IV | Unknown | Unknown | SD |
| UMPS | SNV | Missense_Mutation | novel | c.340N>G | p.Asn114Asp | p.N114D | P11172 | protein_coding | tolerated(0.33) | benign(0.035) | TCGA-A5-A1OF-01 | Endometrium | uterine corpus endometrioid carcinoma | Female | <65 | I/II | Unknown | Unknown | SD |
| Page: 1 2 3 4 5 |
Top |
Related drugs of malignant transformation related genes |
| Identification of chemicals and drugs interact with genes involved in malignant transfromation |
| (DGIdb 4.0) |
| Entrez ID | Symbol | Category | Interaction Types | Drug Claim Name | Drug Name | PMIDs |
| 7372 | UMPS | ENZYME, DRUGGABLE GENOME, CLINICALLY ACTIONABLE | capecitabine | CAPECITABINE | 20647221,28347776,16818689 | |
| 7372 | UMPS | ENZYME, DRUGGABLE GENOME, CLINICALLY ACTIONABLE | fluorouracil | FLUOROURACIL | 20647221,16818689 | |
| 7372 | UMPS | ENZYME, DRUGGABLE GENOME, CLINICALLY ACTIONABLE | 5-FLUORO-6-AMIDO-UMP | CHEMBL1164954 | 20452222 | |
| 7372 | UMPS | ENZYME, DRUGGABLE GENOME, CLINICALLY ACTIONABLE | tegafur | TEGAFUR | 20647221,16818689 | |
| 7372 | UMPS | ENZYME, DRUGGABLE GENOME, CLINICALLY ACTIONABLE | leucovorin | LEUCOVORIN | 20647221,16818689 |
| Page: 1 |

Copyright 2023-Present -The University of Texas Health Science Center at Houston |