
|
|||||
|
 | |
| |
| |
| |
| |
| |
|
Gene: ULK3 |
Gene summary for ULK3 |
| Gene information | Species | Human | Gene symbol | ULK3 | Gene ID | 25989 |
| Gene name | unc-51 like kinase 3 | |
| Gene Alias | ULK3 | |
| Cytomap | 15q24.1 | |
| Gene Type | protein-coding | GO ID | GO:0001775 | UniProtAcc | B4DDG2 |
Top |
Malignant transformation analysis |
| Identification of the aberrant gene expression in precancerous and cancerous lesions by comparing the gene expression of stem-like cells in diseased tissues with normal stem cells |
| Entrez ID | Symbol | Replicates | Species | Organ | Tissue | Adj P-value | Log2FC | Malignancy |
| 25989 | ULK3 | LZE7T | Human | Esophagus | ESCC | 1.89e-09 | 3.43e-01 | 0.0667 |
| 25989 | ULK3 | LZE22D1 | Human | Esophagus | HGIN | 3.66e-02 | 1.61e-01 | 0.0595 |
| 25989 | ULK3 | LZE24T | Human | Esophagus | ESCC | 5.11e-11 | 2.90e-01 | 0.0596 |
| 25989 | ULK3 | LZE21T | Human | Esophagus | ESCC | 3.28e-05 | 2.14e-01 | 0.0655 |
| 25989 | ULK3 | P1T-E | Human | Esophagus | ESCC | 2.57e-11 | 4.07e-01 | 0.0875 |
| 25989 | ULK3 | P2T-E | Human | Esophagus | ESCC | 9.88e-12 | 2.19e-01 | 0.1177 |
| 25989 | ULK3 | P4T-E | Human | Esophagus | ESCC | 5.52e-21 | 3.12e-01 | 0.1323 |
| 25989 | ULK3 | P5T-E | Human | Esophagus | ESCC | 3.31e-05 | 4.01e-02 | 0.1327 |
| 25989 | ULK3 | P8T-E | Human | Esophagus | ESCC | 5.90e-18 | 3.57e-01 | 0.0889 |
| 25989 | ULK3 | P9T-E | Human | Esophagus | ESCC | 6.28e-18 | 3.22e-01 | 0.1131 |
| 25989 | ULK3 | P10T-E | Human | Esophagus | ESCC | 9.18e-28 | 4.94e-01 | 0.116 |
| 25989 | ULK3 | P11T-E | Human | Esophagus | ESCC | 3.79e-06 | 3.75e-01 | 0.1426 |
| 25989 | ULK3 | P12T-E | Human | Esophagus | ESCC | 4.31e-33 | 5.72e-01 | 0.1122 |
| 25989 | ULK3 | P15T-E | Human | Esophagus | ESCC | 4.69e-08 | 2.75e-01 | 0.1149 |
| 25989 | ULK3 | P16T-E | Human | Esophagus | ESCC | 3.92e-24 | 4.54e-01 | 0.1153 |
| 25989 | ULK3 | P17T-E | Human | Esophagus | ESCC | 3.17e-03 | 1.82e-01 | 0.1278 |
| 25989 | ULK3 | P19T-E | Human | Esophagus | ESCC | 4.22e-08 | 3.35e-01 | 0.1662 |
| 25989 | ULK3 | P20T-E | Human | Esophagus | ESCC | 9.69e-19 | 2.28e-01 | 0.1124 |
| 25989 | ULK3 | P21T-E | Human | Esophagus | ESCC | 6.16e-13 | 2.46e-01 | 0.1617 |
| 25989 | ULK3 | P22T-E | Human | Esophagus | ESCC | 2.79e-12 | 1.17e-01 | 0.1236 |
| Page: 1 2 3 4 |
| Tissue | Expression Dynamics | Abbreviation |
| Esophagus |  | ESCC: Esophageal squamous cell carcinoma |
| HGIN: High-grade intraepithelial neoplasias | ||
| LGIN: Low-grade intraepithelial neoplasias | ||
| Liver | 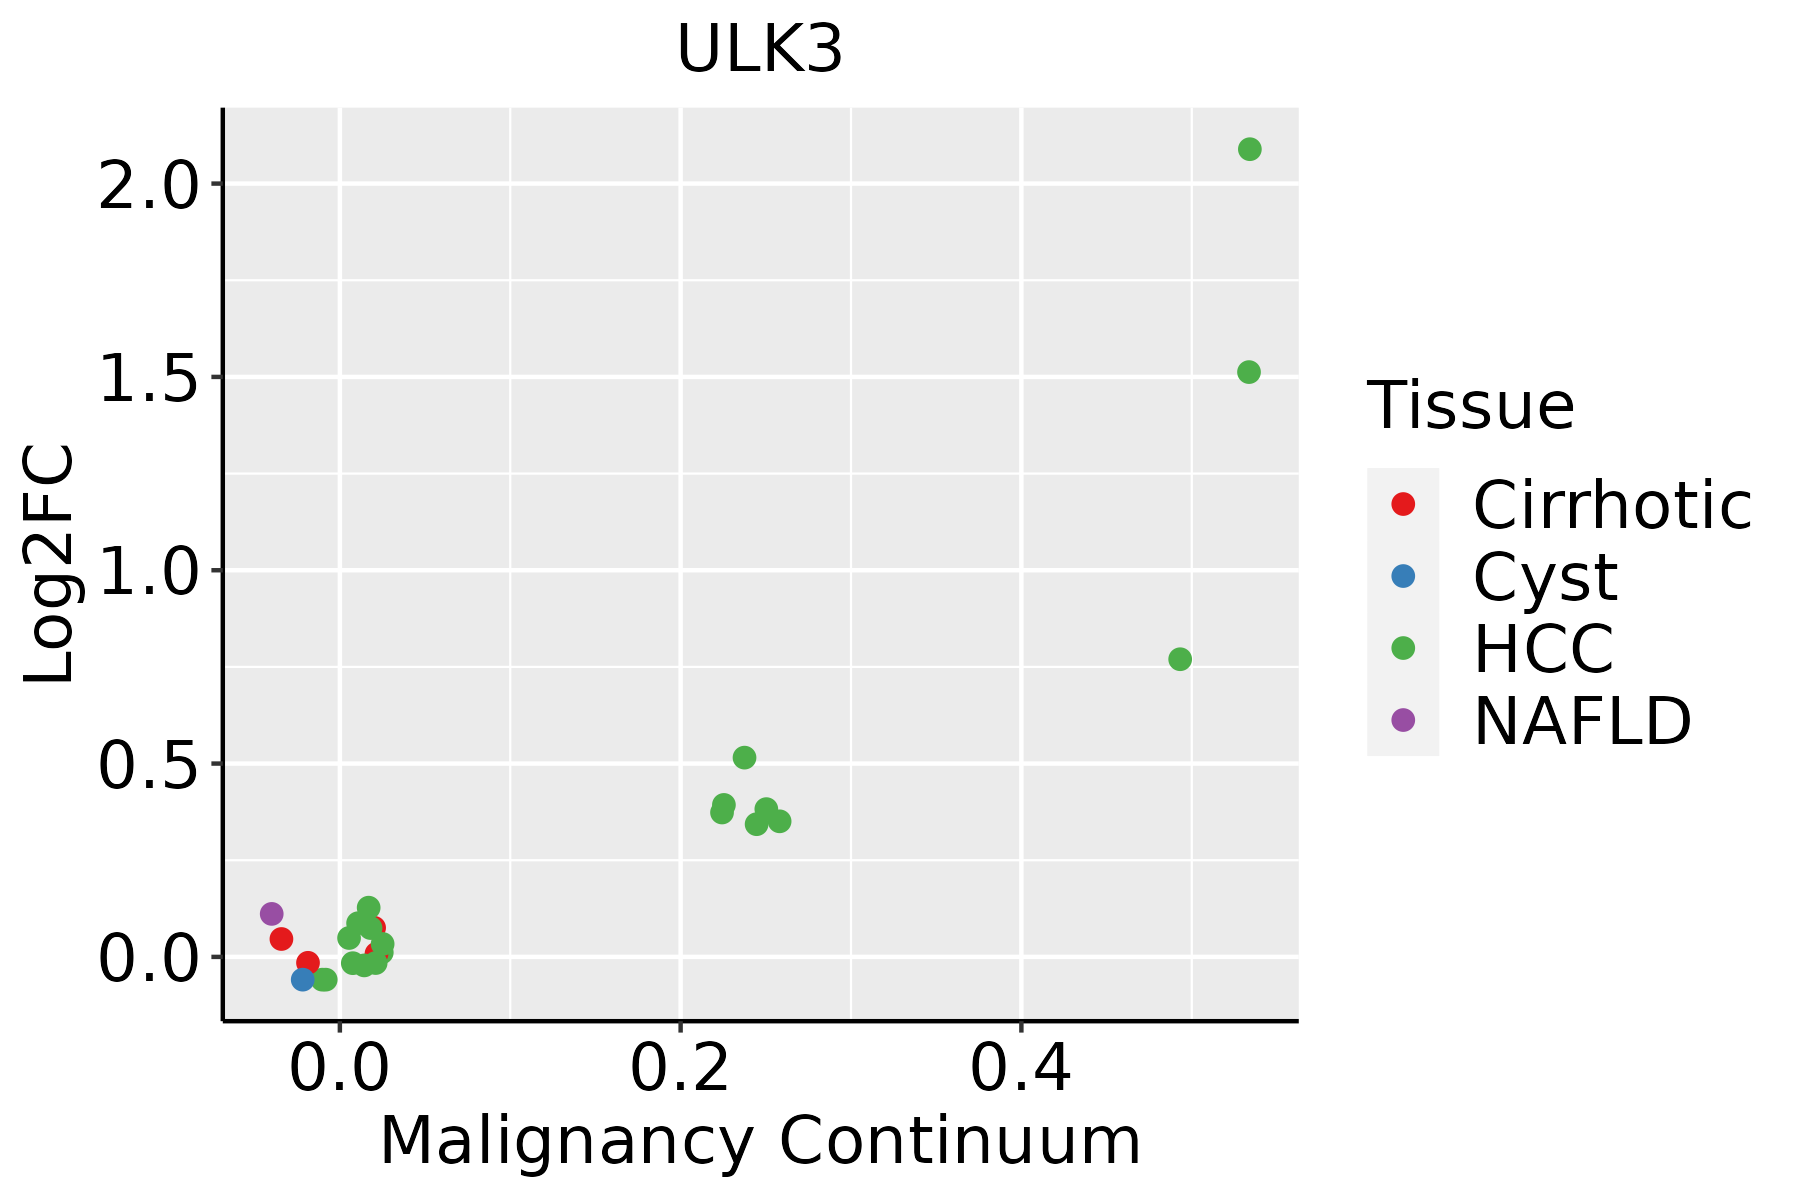 | HCC: Hepatocellular carcinoma |
| NAFLD: Non-alcoholic fatty liver disease |
| ∗log2FC in expression of this searched gene in stem-like cells from each diseased tissue sample relative to stem-like cells in normal samples in each tissue plotted against the malignancy continuum. Samples are colored based on if they are from different disease stage. |
Top |
Malignant transformation related pathway analysis |
| Find out the enriched GO biological processes and KEGG pathways involved in transition from healthy to precancer to cancer |
| Tissue | Disease Stage | Enriched GO biological Processes |
| Colorectum | AD |  |
| Colorectum | SER |  |
| Colorectum | MSS |  |
| Colorectum | MSI-H |  |
| Colorectum | FAP |  |
| ∗Top 15 enriched GO BP terms are showed in the bar plot of each disease state in each tissue. Each row represents a significant GO biological process which is colored according to the -log10(p.adjust). |
| Page: 1 2 3 4 5 6 7 8 9 |
| GO ID | Tissue | Disease Stage | Description | Gene Ratio | Bg Ratio | pvalue | p.adjust | Count |
| GO:001623616 | Esophagus | HGIN | macroautophagy | 77/2587 | 291/18723 | 7.15e-09 | 4.61e-07 | 77 |
| GO:00070336 | Esophagus | HGIN | vacuole organization | 44/2587 | 180/18723 | 8.97e-05 | 1.96e-03 | 44 |
| GO:19050375 | Esophagus | HGIN | autophagosome organization | 28/2587 | 103/18723 | 2.58e-04 | 4.53e-03 | 28 |
| GO:001623617 | Esophagus | ESCC | macroautophagy | 216/8552 | 291/18723 | 1.94e-23 | 4.57e-21 | 216 |
| GO:000703314 | Esophagus | ESCC | vacuole organization | 127/8552 | 180/18723 | 1.04e-11 | 3.85e-10 | 127 |
| GO:190503712 | Esophagus | ESCC | autophagosome organization | 73/8552 | 103/18723 | 1.88e-07 | 2.93e-06 | 73 |
| GO:000756820 | Esophagus | ESCC | aging | 201/8552 | 339/18723 | 2.64e-07 | 3.94e-06 | 201 |
| GO:004677710 | Esophagus | ESCC | protein autophosphorylation | 138/8552 | 227/18723 | 2.98e-06 | 3.38e-05 | 138 |
| GO:00182099 | Esophagus | ESCC | peptidyl-serine modification | 196/8552 | 338/18723 | 3.07e-06 | 3.47e-05 | 196 |
| GO:001810515 | Esophagus | ESCC | peptidyl-serine phosphorylation | 184/8552 | 315/18723 | 3.22e-06 | 3.61e-05 | 184 |
| GO:00075699 | Esophagus | ESCC | cell aging | 81/8552 | 132/18723 | 2.00e-04 | 1.27e-03 | 81 |
| GO:00903984 | Esophagus | ESCC | cellular senescence | 54/8552 | 93/18723 | 1.08e-02 | 3.67e-02 | 54 |
| GO:001623621 | Liver | HCC | macroautophagy | 204/7958 | 291/18723 | 8.66e-22 | 1.41e-19 | 204 |
| GO:000703311 | Liver | HCC | vacuole organization | 119/7958 | 180/18723 | 1.22e-10 | 4.25e-09 | 119 |
| GO:19050371 | Liver | HCC | autophagosome organization | 70/7958 | 103/18723 | 1.52e-07 | 2.82e-06 | 70 |
| GO:000756822 | Liver | HCC | aging | 185/7958 | 339/18723 | 4.28e-06 | 5.50e-05 | 185 |
| GO:001810511 | Liver | HCC | peptidyl-serine phosphorylation | 169/7958 | 315/18723 | 3.86e-05 | 3.81e-04 | 169 |
| GO:001820911 | Liver | HCC | peptidyl-serine modification | 177/7958 | 338/18723 | 1.45e-04 | 1.17e-03 | 177 |
| GO:00467775 | Liver | HCC | protein autophosphorylation | 123/7958 | 227/18723 | 2.40e-04 | 1.80e-03 | 123 |
| GO:00075691 | Liver | HCC | cell aging | 73/7958 | 132/18723 | 2.00e-03 | 1.01e-02 | 73 |
| Page: 1 |
| Pathway ID | Tissue | Disease Stage | Description | Gene Ratio | Bg Ratio | pvalue | p.adjust | qvalue | Count |
| Page: 1 |
Top |
Cell-cell communication analysis |
| Identification of potential cell-cell interactions between two cell types and their ligand-receptor pairs for different disease states |
| Ligand | Receptor | LRpair | Pathway | Tissue | Disease Stage |
| Page: 1 |
Top |
Single-cell gene regulatory network inference analysis |
| Find out the significant the regulons (TFs) and the target genes of each regulon across cell types for different disease states |
| TF | Cell Type | Tissue | Disease Stage | Target Gene | RSS | Regulon Activity |
| ∗The dot plots of a searched regulon are shown for all cell subpopulations in each disease state of each tissue based on the regulon specific score inferred using pySCENIC and by calculating the average expression. |
| Page: 1 |
Top |
Somatic mutation of malignant transformation related genes |
| Annotation of somatic variants for genes involved in malignant transformation |
| Hugo Symbol | Variant Class | Variant Classification | dbSNP RS | HGVSc | HGVSp | HGVSp Short | SWISSPROT | BIOTYPE | SIFT | PolyPhen | Tumor Sample Barcode | Tissue | Histology | Sex | Age | Stage | Therapy Types | Drugs | Outcome |
| ULK3 | SNV | Missense_Mutation | rs753772870 | c.1055N>G | p.Asn352Ser | p.N352S | Q6PHR2 | protein_coding | tolerated(0.29) | benign(0.006) | TCGA-A2-A1FZ-01 | Breast | breast invasive carcinoma | Female | <65 | I/II | Unspecific | Arimidex | SD |
| ULK3 | SNV | Missense_Mutation | c.1027G>A | p.Glu343Lys | p.E343K | Q6PHR2 | protein_coding | tolerated(0.13) | possibly_damaging(0.601) | TCGA-AC-A23H-01 | Breast | breast invasive carcinoma | Female | >=65 | I/II | Unknown | Unknown | PD | |
| ULK3 | SNV | Missense_Mutation | c.1022N>T | p.Ala341Val | p.A341V | Q6PHR2 | protein_coding | deleterious(0) | probably_damaging(0.989) | TCGA-EW-A1PB-01 | Breast | breast invasive carcinoma | Female | >=65 | III/IV | Unknown | Unknown | SD | |
| ULK3 | SNV | Missense_Mutation | c.186N>T | p.Glu62Asp | p.E62D | Q6PHR2 | protein_coding | deleterious(0) | probably_damaging(0.999) | TCGA-AA-A00N-01 | Colorectum | colon adenocarcinoma | Male | >=65 | I/II | Unknown | Unknown | PD | |
| ULK3 | SNV | Missense_Mutation | c.391N>T | p.Arg131Trp | p.R131W | Q6PHR2 | protein_coding | deleterious(0.01) | possibly_damaging(0.892) | TCGA-AA-A022-01 | Colorectum | colon adenocarcinoma | Female | >=65 | I/II | Unknown | Unknown | SD | |
| ULK3 | SNV | Missense_Mutation | c.481N>A | p.Ala161Thr | p.A161T | Q6PHR2 | protein_coding | deleterious(0) | probably_damaging(0.997) | TCGA-AD-5900-01 | Colorectum | colon adenocarcinoma | Male | >=65 | I/II | Unknown | Unknown | SD | |
| ULK3 | SNV | Missense_Mutation | c.85N>A | p.Tyr29Asn | p.Y29N | Q6PHR2 | protein_coding | deleterious(0) | probably_damaging(0.967) | TCGA-AD-6895-01 | Colorectum | colon adenocarcinoma | Male | >=65 | III/IV | Unknown | Unknown | SD | |
| ULK3 | SNV | Missense_Mutation | novel | c.616N>A | p.Ala206Thr | p.A206T | Q6PHR2 | protein_coding | tolerated(0.11) | benign(0.043) | TCGA-F4-6856-01 | Colorectum | colon adenocarcinoma | Male | <65 | I/II | Ancillary | leucovorin | CR |
| ULK3 | SNV | Missense_Mutation | rs757280306 | c.574N>A | p.Ala192Thr | p.A192T | Q6PHR2 | protein_coding | deleterious(0.01) | possibly_damaging(0.523) | TCGA-EI-6507-01 | Colorectum | rectum adenocarcinoma | Male | <65 | I/II | Unknown | Unknown | SD |
| ULK3 | SNV | Missense_Mutation | novel | c.134N>A | p.Cys45Tyr | p.C45Y | Q6PHR2 | protein_coding | tolerated(0.11) | benign(0.378) | TCGA-A5-A0G2-01 | Endometrium | uterine corpus endometrioid carcinoma | Female | <65 | III/IV | Unknown | Unknown | SD |
| Page: 1 2 3 4 |
Top |
Related drugs of malignant transformation related genes |
| Identification of chemicals and drugs interact with genes involved in malignant transfromation |
| (DGIdb 4.0) |
| Entrez ID | Symbol | Category | Interaction Types | Drug Claim Name | Drug Name | PMIDs |
| 25989 | ULK3 | DRUGGABLE GENOME, KINASE, ENZYME, SERINE THREONINE KINASE | inhibitor | 249565900 | ||
| 25989 | ULK3 | DRUGGABLE GENOME, KINASE, ENZYME, SERINE THREONINE KINASE | imatinib | IMATINIB | 15073101 | |
| 25989 | ULK3 | DRUGGABLE GENOME, KINASE, ENZYME, SERINE THREONINE KINASE | inhibitor | HESPERADIN | HESPERADIN | 19035792 |
| Page: 1 |

Copyright 2023-Present -The University of Texas Health Science Center at Houston |