
|
|||||
|
 | |
| |
| |
| |
| |
| |
|
Gene: ULK1 |
Gene summary for ULK1 |
| Gene information | Species | Human | Gene symbol | ULK1 | Gene ID | 8408 |
| Gene name | unc-51 like autophagy activating kinase 1 | |
| Gene Alias | ATG1 | |
| Cytomap | 12q24.33 | |
| Gene Type | protein-coding | GO ID | GO:0000045 | UniProtAcc | O75385 |
Top |
Malignant transformation analysis |
| Identification of the aberrant gene expression in precancerous and cancerous lesions by comparing the gene expression of stem-like cells in diseased tissues with normal stem cells |
| Entrez ID | Symbol | Replicates | Species | Organ | Tissue | Adj P-value | Log2FC | Malignancy |
| 8408 | ULK1 | HCC1_Meng | Human | Liver | HCC | 1.92e-22 | 5.09e-03 | 0.0246 |
| 8408 | ULK1 | HCC2_Meng | Human | Liver | HCC | 3.18e-08 | 4.85e-02 | 0.0107 |
| 8408 | ULK1 | HCC1 | Human | Liver | HCC | 2.70e-02 | 3.02e+00 | 0.5336 |
| 8408 | ULK1 | HCC2 | Human | Liver | HCC | 6.07e-10 | 2.67e+00 | 0.5341 |
| 8408 | ULK1 | S014 | Human | Liver | HCC | 1.58e-04 | 4.24e-01 | 0.2254 |
| 8408 | ULK1 | S015 | Human | Liver | HCC | 2.96e-05 | 4.89e-01 | 0.2375 |
| 8408 | ULK1 | S016 | Human | Liver | HCC | 1.62e-03 | 3.27e-01 | 0.2243 |
| 8408 | ULK1 | S027 | Human | Liver | HCC | 1.68e-07 | 8.42e-01 | 0.2446 |
| 8408 | ULK1 | S028 | Human | Liver | HCC | 1.30e-11 | 6.24e-01 | 0.2503 |
| 8408 | ULK1 | S029 | Human | Liver | HCC | 1.11e-06 | 5.11e-01 | 0.2581 |
| 8408 | ULK1 | C30 | Human | Oral cavity | OSCC | 2.30e-11 | 6.00e-01 | 0.3055 |
| 8408 | ULK1 | C38 | Human | Oral cavity | OSCC | 1.51e-06 | 9.25e-01 | 0.172 |
| 8408 | ULK1 | C43 | Human | Oral cavity | OSCC | 2.39e-15 | 2.66e-01 | 0.1704 |
| 8408 | ULK1 | C51 | Human | Oral cavity | OSCC | 5.20e-09 | 5.87e-01 | 0.2674 |
| 8408 | ULK1 | C57 | Human | Oral cavity | OSCC | 2.88e-02 | 2.63e-01 | 0.1679 |
| 8408 | ULK1 | C08 | Human | Oral cavity | OSCC | 3.18e-05 | 1.53e-01 | 0.1919 |
| 8408 | ULK1 | LN22 | Human | Oral cavity | OSCC | 2.98e-03 | 6.13e-01 | 0.1733 |
| 8408 | ULK1 | EOLP-1 | Human | Oral cavity | EOLP | 4.01e-04 | 1.27e-01 | -0.0202 |
| 8408 | ULK1 | SYSMH1 | Human | Oral cavity | OSCC | 6.71e-15 | 2.94e-01 | 0.1127 |
| 8408 | ULK1 | SYSMH2 | Human | Oral cavity | OSCC | 1.85e-06 | 1.58e-01 | 0.2326 |
| Page: 1 2 |
| Tissue | Expression Dynamics | Abbreviation |
| Liver | 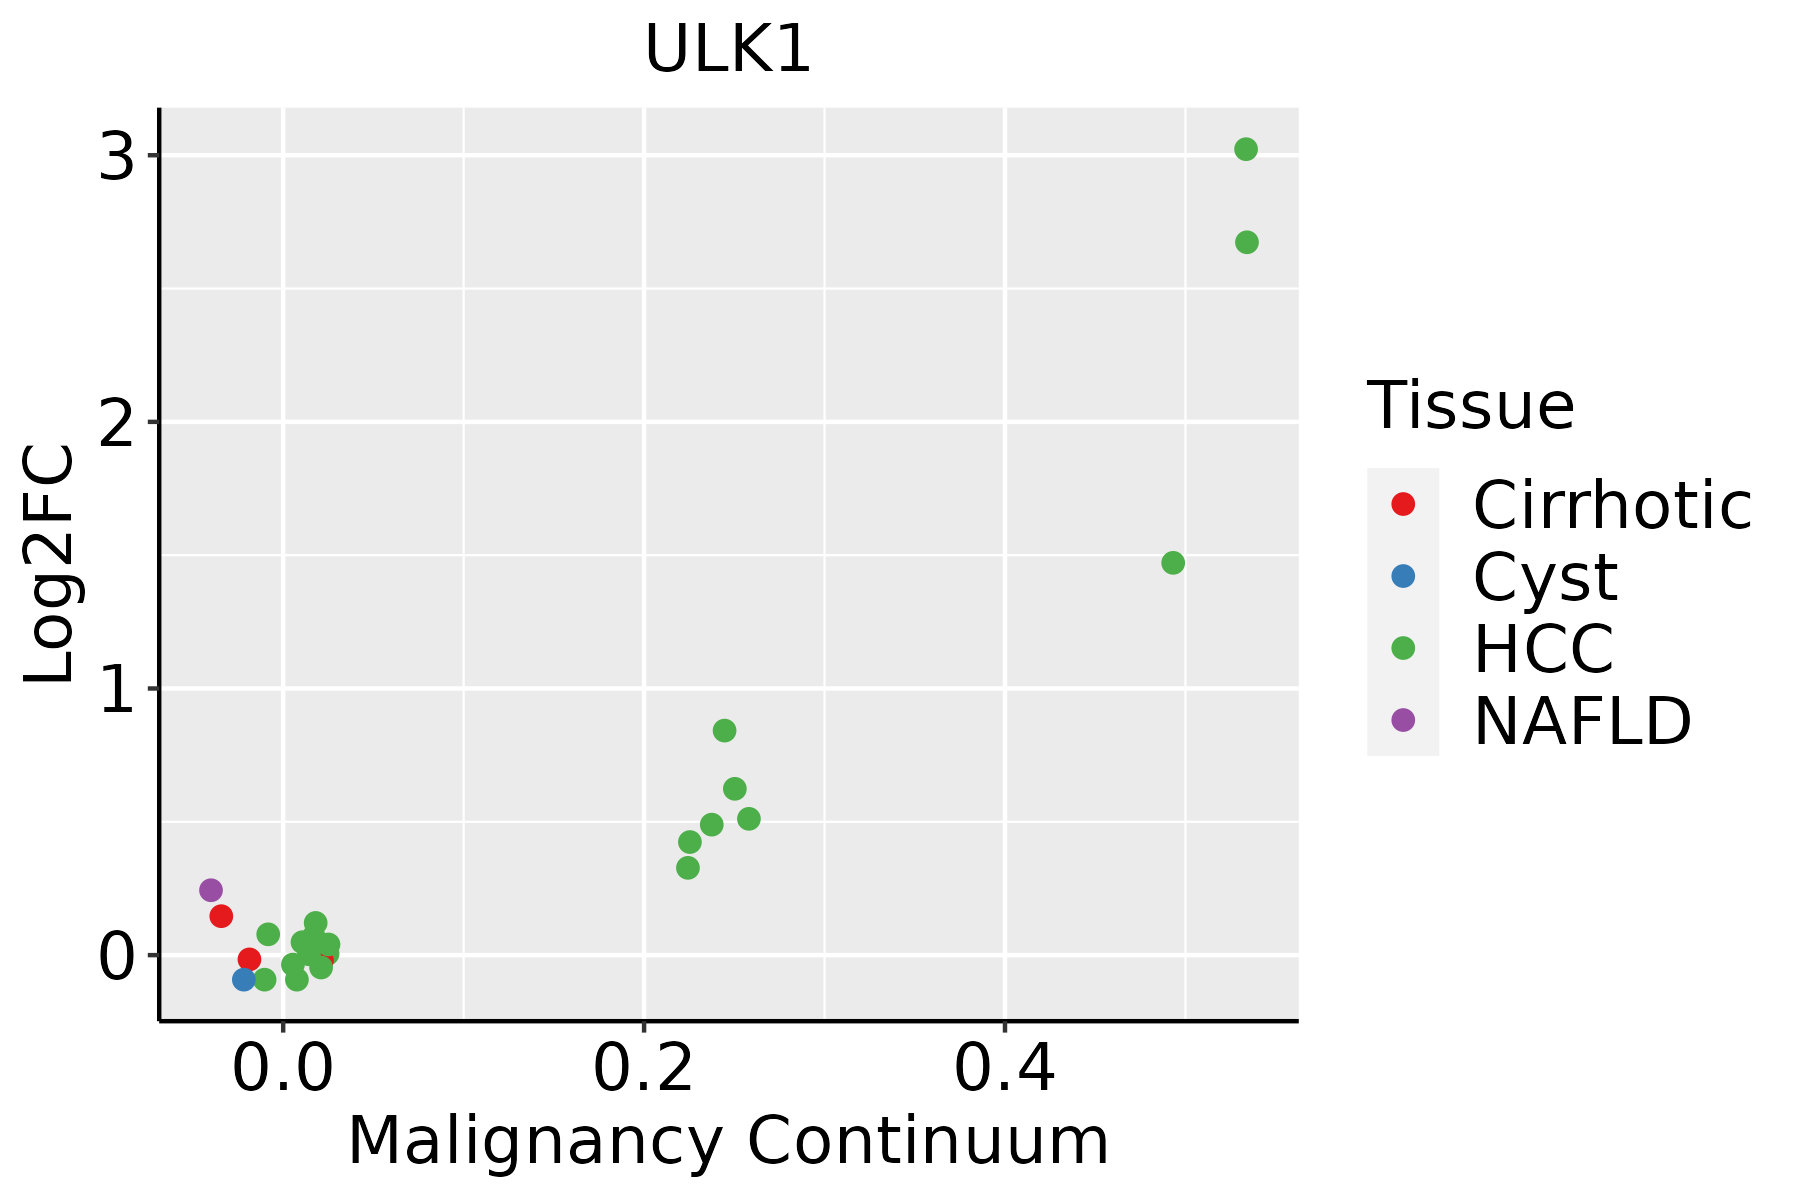 | HCC: Hepatocellular carcinoma |
| NAFLD: Non-alcoholic fatty liver disease | ||
| Oral Cavity | 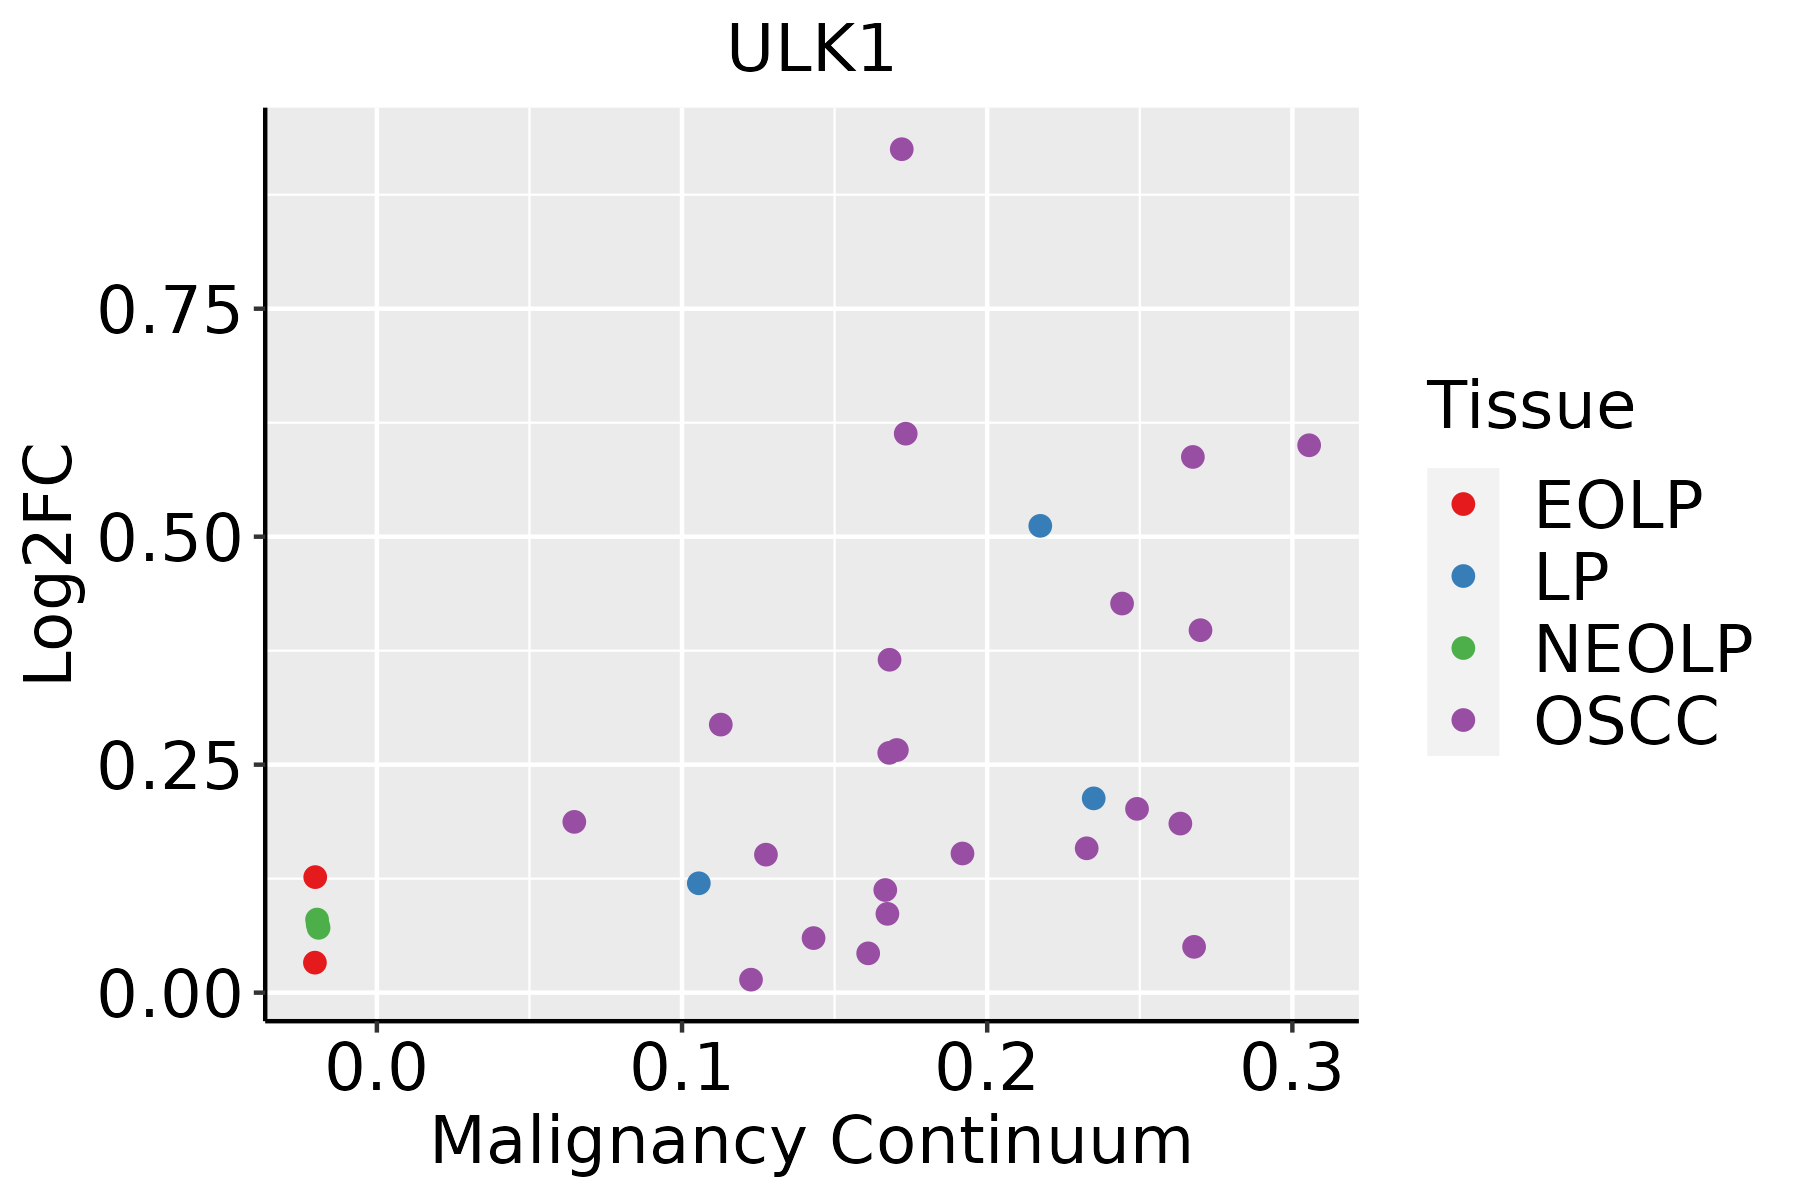 | EOLP: Erosive Oral lichen planus |
| LP: leukoplakia | ||
| NEOLP: Non-erosive oral lichen planus | ||
| OSCC: Oral squamous cell carcinoma | ||
| Thyroid | 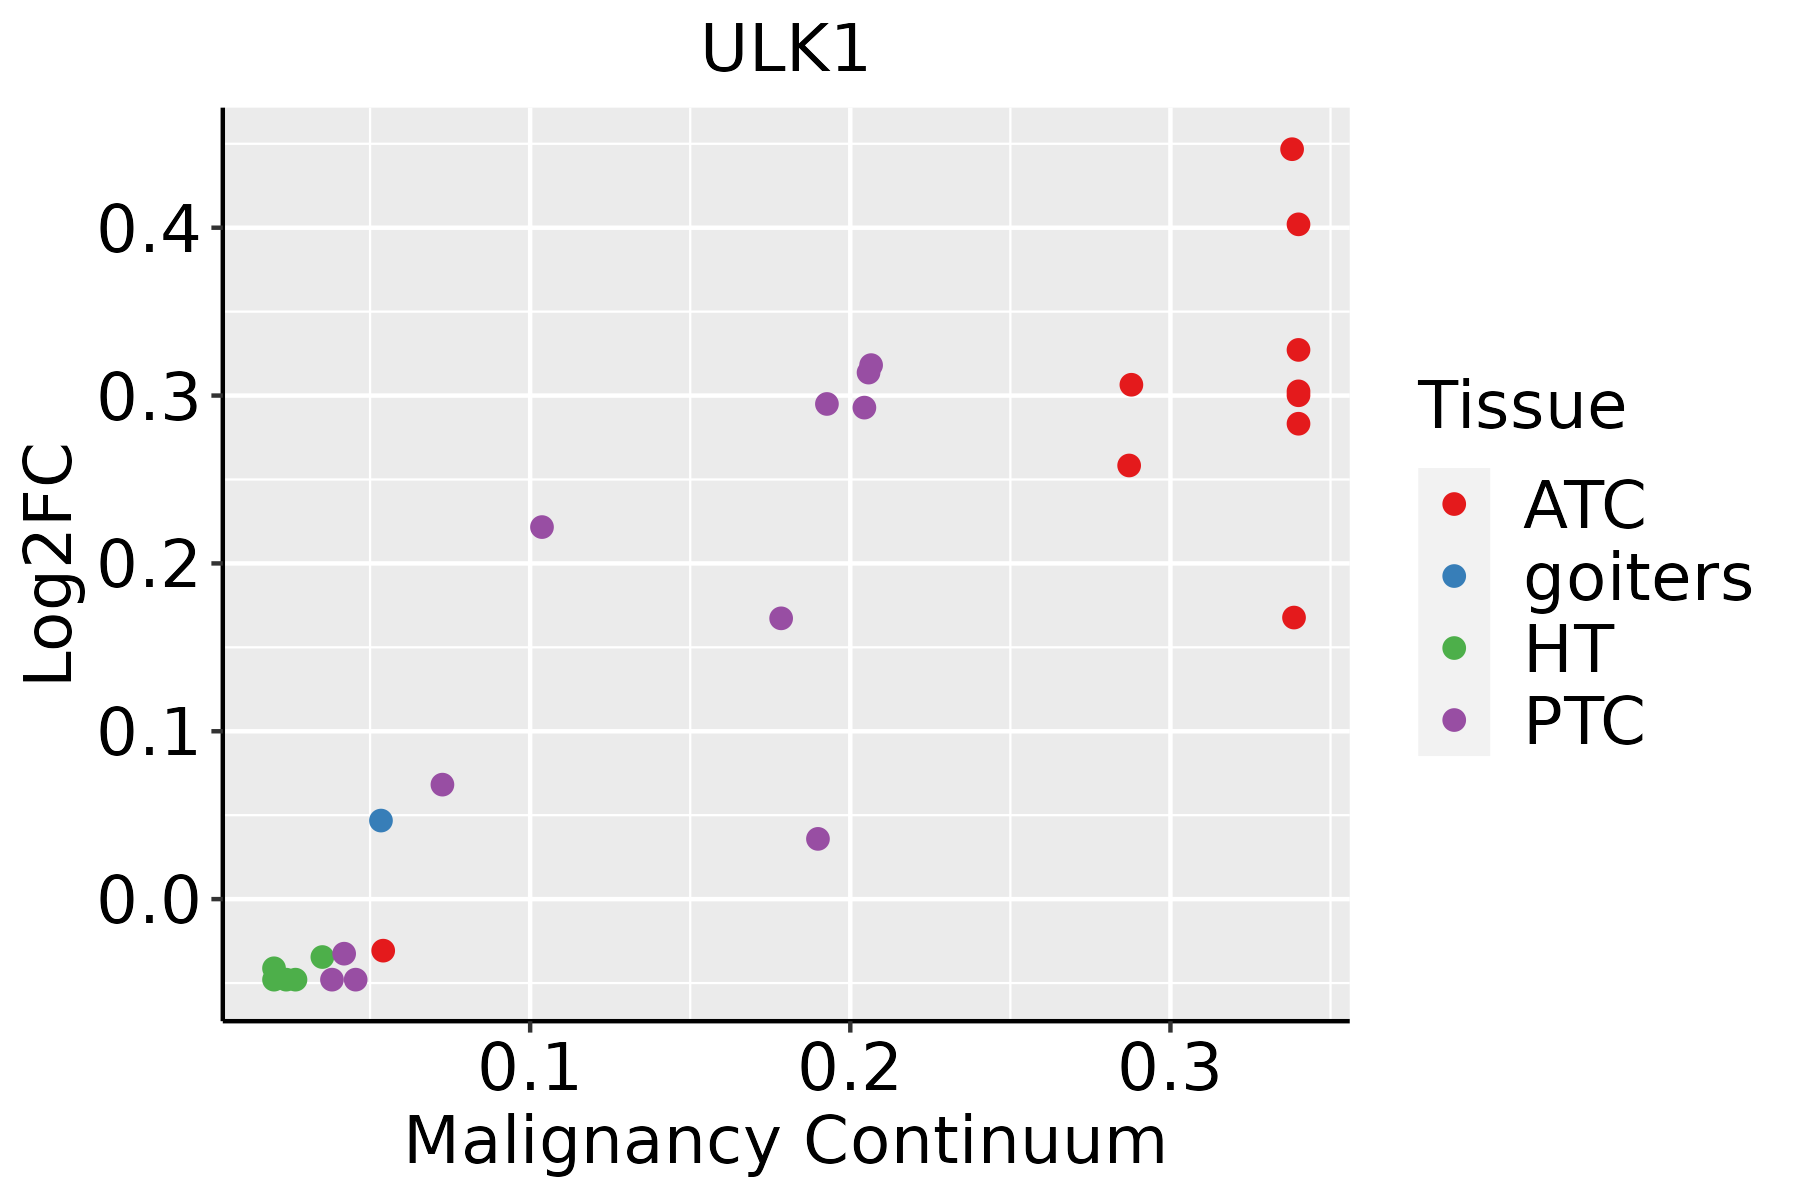 | ATC: Anaplastic thyroid cancer |
| HT: Hashimoto's thyroiditis | ||
| PTC: Papillary thyroid cancer |
| ∗log2FC in expression of this searched gene in stem-like cells from each diseased tissue sample relative to stem-like cells in normal samples in each tissue plotted against the malignancy continuum. Samples are colored based on if they are from different disease stage. |
Top |
Malignant transformation related pathway analysis |
| Find out the enriched GO biological processes and KEGG pathways involved in transition from healthy to precancer to cancer |
| Tissue | Disease Stage | Enriched GO biological Processes |
| Colorectum | AD |  |
| Colorectum | SER |  |
| Colorectum | MSS |  |
| Colorectum | MSI-H |  |
| Colorectum | FAP |  |
| ∗Top 15 enriched GO BP terms are showed in the bar plot of each disease state in each tissue. Each row represents a significant GO biological process which is colored according to the -log10(p.adjust). |
| Page: 1 2 3 4 5 6 7 8 9 |
| GO ID | Tissue | Disease Stage | Description | Gene Ratio | Bg Ratio | pvalue | p.adjust | Count |
| GO:000989622 | Liver | HCC | positive regulation of catabolic process | 335/7958 | 492/18723 | 3.83e-31 | 1.87e-28 | 335 |
| GO:003133122 | Liver | HCC | positive regulation of cellular catabolic process | 295/7958 | 427/18723 | 3.20e-29 | 1.45e-26 | 295 |
| GO:001623621 | Liver | HCC | macroautophagy | 204/7958 | 291/18723 | 8.66e-22 | 1.41e-19 | 204 |
| GO:002241112 | Liver | HCC | cellular component disassembly | 282/7958 | 443/18723 | 1.02e-19 | 1.38e-17 | 282 |
| GO:001050621 | Liver | HCC | regulation of autophagy | 210/7958 | 317/18723 | 7.59e-18 | 8.45e-16 | 210 |
| GO:004325422 | Liver | HCC | regulation of protein-containing complex assembly | 264/7958 | 428/18723 | 5.47e-16 | 4.39e-14 | 264 |
| GO:190300811 | Liver | HCC | organelle disassembly | 89/7958 | 114/18723 | 8.68e-15 | 5.73e-13 | 89 |
| GO:004440322 | Liver | HCC | biological process involved in symbiotic interaction | 183/7958 | 290/18723 | 9.13e-13 | 4.59e-11 | 183 |
| GO:003166722 | Liver | HCC | response to nutrient levels | 276/7958 | 474/18723 | 2.30e-12 | 1.08e-10 | 276 |
| GO:000042211 | Liver | HCC | autophagy of mitochondrion | 64/7958 | 81/18723 | 1.96e-11 | 7.72e-10 | 64 |
| GO:006172611 | Liver | HCC | mitochondrion disassembly | 64/7958 | 81/18723 | 1.96e-11 | 7.72e-10 | 64 |
| GO:000703311 | Liver | HCC | vacuole organization | 119/7958 | 180/18723 | 1.22e-10 | 4.25e-09 | 119 |
| GO:007149622 | Liver | HCC | cellular response to external stimulus | 191/7958 | 320/18723 | 3.40e-10 | 1.13e-08 | 191 |
| GO:001624111 | Liver | HCC | regulation of macroautophagy | 96/7958 | 141/18723 | 6.82e-10 | 2.14e-08 | 96 |
| GO:001604921 | Liver | HCC | cell growth | 269/7958 | 482/18723 | 1.84e-09 | 5.35e-08 | 269 |
| GO:005170122 | Liver | HCC | biological process involved in interaction with host | 128/7958 | 203/18723 | 2.51e-09 | 6.91e-08 | 128 |
| GO:003166812 | Liver | HCC | cellular response to extracellular stimulus | 149/7958 | 246/18723 | 7.35e-09 | 1.86e-07 | 149 |
| GO:003253522 | Liver | HCC | regulation of cellular component size | 217/7958 | 383/18723 | 1.28e-08 | 3.14e-07 | 217 |
| GO:004259421 | Liver | HCC | response to starvation | 121/7958 | 197/18723 | 6.08e-08 | 1.28e-06 | 121 |
| GO:003166912 | Liver | HCC | cellular response to nutrient levels | 130/7958 | 215/18723 | 7.52e-08 | 1.51e-06 | 130 |
| Page: 1 2 3 4 5 6 7 8 9 10 11 12 13 14 |
| Pathway ID | Tissue | Disease Stage | Description | Gene Ratio | Bg Ratio | pvalue | p.adjust | qvalue | Count |
| hsa0501622 | Liver | HCC | Huntington disease | 219/4020 | 306/8465 | 3.06e-18 | 3.42e-16 | 1.90e-16 | 219 |
| hsa0501422 | Liver | HCC | Amyotrophic lateral sclerosis | 252/4020 | 364/8465 | 8.85e-18 | 7.41e-16 | 4.12e-16 | 252 |
| hsa0501022 | Liver | HCC | Alzheimer disease | 254/4020 | 384/8465 | 3.75e-14 | 8.97e-13 | 4.99e-13 | 254 |
| hsa0502222 | Liver | HCC | Pathways of neurodegeneration - multiple diseases | 298/4020 | 476/8465 | 6.59e-12 | 1.30e-10 | 7.22e-11 | 298 |
| hsa0414021 | Liver | HCC | Autophagy - animal | 99/4020 | 141/8465 | 3.08e-08 | 4.70e-07 | 2.61e-07 | 99 |
| hsa0413741 | Liver | HCC | Mitophagy - animal | 53/4020 | 72/8465 | 5.49e-06 | 4.59e-05 | 2.56e-05 | 53 |
| hsa0501721 | Liver | HCC | Spinocerebellar ataxia | 92/4020 | 143/8465 | 3.20e-05 | 1.88e-04 | 1.04e-04 | 92 |
| hsa0421121 | Liver | HCC | Longevity regulating pathway | 61/4020 | 89/8465 | 4.46e-05 | 2.37e-04 | 1.32e-04 | 61 |
| hsa041502 | Liver | HCC | mTOR signaling pathway | 95/4020 | 156/8465 | 4.70e-04 | 1.99e-03 | 1.11e-03 | 95 |
| hsa0501632 | Liver | HCC | Huntington disease | 219/4020 | 306/8465 | 3.06e-18 | 3.42e-16 | 1.90e-16 | 219 |
| hsa0501432 | Liver | HCC | Amyotrophic lateral sclerosis | 252/4020 | 364/8465 | 8.85e-18 | 7.41e-16 | 4.12e-16 | 252 |
| hsa0501032 | Liver | HCC | Alzheimer disease | 254/4020 | 384/8465 | 3.75e-14 | 8.97e-13 | 4.99e-13 | 254 |
| hsa0502232 | Liver | HCC | Pathways of neurodegeneration - multiple diseases | 298/4020 | 476/8465 | 6.59e-12 | 1.30e-10 | 7.22e-11 | 298 |
| hsa0414031 | Liver | HCC | Autophagy - animal | 99/4020 | 141/8465 | 3.08e-08 | 4.70e-07 | 2.61e-07 | 99 |
| hsa0413751 | Liver | HCC | Mitophagy - animal | 53/4020 | 72/8465 | 5.49e-06 | 4.59e-05 | 2.56e-05 | 53 |
| hsa0501731 | Liver | HCC | Spinocerebellar ataxia | 92/4020 | 143/8465 | 3.20e-05 | 1.88e-04 | 1.04e-04 | 92 |
| hsa0421131 | Liver | HCC | Longevity regulating pathway | 61/4020 | 89/8465 | 4.46e-05 | 2.37e-04 | 1.32e-04 | 61 |
| hsa0415011 | Liver | HCC | mTOR signaling pathway | 95/4020 | 156/8465 | 4.70e-04 | 1.99e-03 | 1.11e-03 | 95 |
| hsa0501428 | Oral cavity | OSCC | Amyotrophic lateral sclerosis | 246/3704 | 364/8465 | 6.65e-21 | 1.11e-18 | 5.67e-19 | 246 |
| hsa0501628 | Oral cavity | OSCC | Huntington disease | 204/3704 | 306/8465 | 1.70e-16 | 7.13e-15 | 3.63e-15 | 204 |
| Page: 1 2 3 |
Top |
Cell-cell communication analysis |
| Identification of potential cell-cell interactions between two cell types and their ligand-receptor pairs for different disease states |
| Ligand | Receptor | LRpair | Pathway | Tissue | Disease Stage |
| Page: 1 |
Top |
Single-cell gene regulatory network inference analysis |
| Find out the significant the regulons (TFs) and the target genes of each regulon across cell types for different disease states |
| TF | Cell Type | Tissue | Disease Stage | Target Gene | RSS | Regulon Activity |
| ∗The dot plots of a searched regulon are shown for all cell subpopulations in each disease state of each tissue based on the regulon specific score inferred using pySCENIC and by calculating the average expression. |
| Page: 1 |
Top |
Somatic mutation of malignant transformation related genes |
| Annotation of somatic variants for genes involved in malignant transformation |
| Hugo Symbol | Variant Class | Variant Classification | dbSNP RS | HGVSc | HGVSp | HGVSp Short | SWISSPROT | BIOTYPE | SIFT | PolyPhen | Tumor Sample Barcode | Tissue | Histology | Sex | Age | Stage | Therapy Types | Drugs | Outcome |
| ULK1 | SNV | Missense_Mutation | novel | c.989N>T | p.Ser330Phe | p.S330F | O75385 | protein_coding | deleterious(0) | probably_damaging(0.986) | TCGA-AC-A5XS-01 | Breast | breast invasive carcinoma | Female | >=65 | I/II | Hormone Therapy | femara | SD |
| ULK1 | SNV | Missense_Mutation | c.644T>C | p.Leu215Pro | p.L215P | O75385 | protein_coding | deleterious(0) | probably_damaging(1) | TCGA-AO-A128-01 | Breast | breast invasive carcinoma | Female | <65 | I/II | Chemotherapy | doxorubicin | SD | |
| ULK1 | insertion | In_Frame_Ins | novel | c.247-1_247insTTTAAGTTTTGTATTTTTAGTAGA | p.Gln82_Glu83insPheLysPheCysIlePheSerArg | p.Q82_E83insFKFCIFSR | O75385 | protein_coding | TCGA-A8-A08H-01 | Breast | breast invasive carcinoma | Female | >=65 | I/II | Unknown | Unknown | SD | ||
| ULK1 | deletion | Frame_Shift_Del | novel | c.1470delN | p.Ala491ProfsTer156 | p.A491Pfs*156 | O75385 | protein_coding | TCGA-EW-A2FV-01 | Breast | breast invasive carcinoma | Female | <65 | III/IV | Chemotherapy | docetaxel | SD | ||
| ULK1 | SNV | Missense_Mutation | novel | c.2048N>G | p.Glu683Gly | p.E683G | O75385 | protein_coding | tolerated(0.13) | benign(0.054) | TCGA-2W-A8YY-01 | Cervix | cervical & endocervical cancer | Female | <65 | I/II | Chemotherapy | cisplatin | CR |
| ULK1 | SNV | Missense_Mutation | novel | c.448N>A | p.Ala150Thr | p.A150T | O75385 | protein_coding | tolerated(0.27) | benign(0.017) | TCGA-DS-A0VN-01 | Cervix | cervical & endocervical cancer | Female | <65 | I/II | Chemotherapy | cisplatin | SD |
| ULK1 | SNV | Missense_Mutation | rs757530790 | c.2009N>C | p.Phe670Ser | p.F670S | O75385 | protein_coding | tolerated(0.17) | benign(0.074) | TCGA-DS-A1OD-01 | Cervix | cervical & endocervical cancer | Female | <65 | I/II | Chemotherapy | cisplatin | SD |
| ULK1 | SNV | Missense_Mutation | c.1379N>G | p.Ser460Cys | p.S460C | O75385 | protein_coding | tolerated(0.08) | benign(0.003) | TCGA-IR-A3LK-01 | Cervix | cervical & endocervical cancer | Female | >=65 | I/II | Chemotherapy | cisplatin | PD | |
| ULK1 | SNV | Missense_Mutation | rs761511646 | c.848N>T | p.Ser283Leu | p.S283L | O75385 | protein_coding | deleterious(0.02) | benign(0.132) | TCGA-MY-A5BF-01 | Cervix | cervical & endocervical cancer | Female | >=65 | I/II | Chemotherapy | cisplatin | CR |
| ULK1 | SNV | Missense_Mutation | rs150697369 | c.1631C>G | p.Ser544Cys | p.S544C | O75385 | protein_coding | tolerated(0.08) | possibly_damaging(0.635) | TCGA-VS-A953-01 | Cervix | cervical & endocervical cancer | Female | <65 | I/II | Unknown | Unknown | PD |
| Page: 1 2 3 4 5 6 7 8 9 10 11 |
Top |
Related drugs of malignant transformation related genes |
| Identification of chemicals and drugs interact with genes involved in malignant transfromation |
| (DGIdb 4.0) |
| Entrez ID | Symbol | Category | Interaction Types | Drug Claim Name | Drug Name | PMIDs |
| 8408 | ULK1 | KINASE, DRUGGABLE GENOME, SERINE THREONINE KINASE, ENZYME | inhibitor | 249565893 |
| Page: 1 |

Copyright 2023-Present -The University of Texas Health Science Center at Houston |