
|
|||||
|
 | |
| |
| |
| |
| |
| |
|
Gene: UHRF1BP1L |
Gene summary for UHRF1BP1L |
| Gene information | Species | Human | Gene symbol | UHRF1BP1L | Gene ID | 23074 |
| Gene name | UHRF1 binding protein 1 like | |
| Gene Alias | SHIP164 | |
| Cytomap | 12q23.1 | |
| Gene Type | protein-coding | GO ID | GO:0005575 | UniProtAcc | A0JNW5 |
Top |
Malignant transformation analysis |
| Identification of the aberrant gene expression in precancerous and cancerous lesions by comparing the gene expression of stem-like cells in diseased tissues with normal stem cells |
| Entrez ID | Symbol | Replicates | Species | Organ | Tissue | Adj P-value | Log2FC | Malignancy |
| 23074 | UHRF1BP1L | LZE4T | Human | Esophagus | ESCC | 1.76e-13 | 2.00e-01 | 0.0811 |
| 23074 | UHRF1BP1L | LZE7T | Human | Esophagus | ESCC | 2.33e-04 | 2.49e-01 | 0.0667 |
| 23074 | UHRF1BP1L | LZE8T | Human | Esophagus | ESCC | 3.28e-03 | 8.14e-02 | 0.067 |
| 23074 | UHRF1BP1L | LZE24T | Human | Esophagus | ESCC | 5.07e-12 | 2.66e-01 | 0.0596 |
| 23074 | UHRF1BP1L | P2T-E | Human | Esophagus | ESCC | 6.01e-40 | 6.97e-01 | 0.1177 |
| 23074 | UHRF1BP1L | P4T-E | Human | Esophagus | ESCC | 7.83e-12 | 2.15e-01 | 0.1323 |
| 23074 | UHRF1BP1L | P5T-E | Human | Esophagus | ESCC | 7.38e-07 | 1.27e-01 | 0.1327 |
| 23074 | UHRF1BP1L | P8T-E | Human | Esophagus | ESCC | 3.06e-08 | 1.66e-01 | 0.0889 |
| 23074 | UHRF1BP1L | P9T-E | Human | Esophagus | ESCC | 1.34e-07 | 1.70e-01 | 0.1131 |
| 23074 | UHRF1BP1L | P10T-E | Human | Esophagus | ESCC | 3.44e-10 | 1.10e-01 | 0.116 |
| 23074 | UHRF1BP1L | P11T-E | Human | Esophagus | ESCC | 3.49e-10 | 5.10e-01 | 0.1426 |
| 23074 | UHRF1BP1L | P12T-E | Human | Esophagus | ESCC | 8.52e-14 | 2.91e-01 | 0.1122 |
| 23074 | UHRF1BP1L | P15T-E | Human | Esophagus | ESCC | 4.98e-16 | 3.25e-01 | 0.1149 |
| 23074 | UHRF1BP1L | P16T-E | Human | Esophagus | ESCC | 3.24e-11 | 2.70e-01 | 0.1153 |
| 23074 | UHRF1BP1L | P17T-E | Human | Esophagus | ESCC | 5.45e-03 | 1.06e-01 | 0.1278 |
| 23074 | UHRF1BP1L | P19T-E | Human | Esophagus | ESCC | 1.51e-02 | 2.94e-01 | 0.1662 |
| 23074 | UHRF1BP1L | P20T-E | Human | Esophagus | ESCC | 4.81e-12 | 2.45e-01 | 0.1124 |
| 23074 | UHRF1BP1L | P21T-E | Human | Esophagus | ESCC | 8.99e-12 | 2.27e-01 | 0.1617 |
| 23074 | UHRF1BP1L | P22T-E | Human | Esophagus | ESCC | 5.00e-07 | 1.82e-01 | 0.1236 |
| 23074 | UHRF1BP1L | P23T-E | Human | Esophagus | ESCC | 3.56e-11 | 3.36e-01 | 0.108 |
| Page: 1 2 3 4 |
| Tissue | Expression Dynamics | Abbreviation |
| Esophagus | 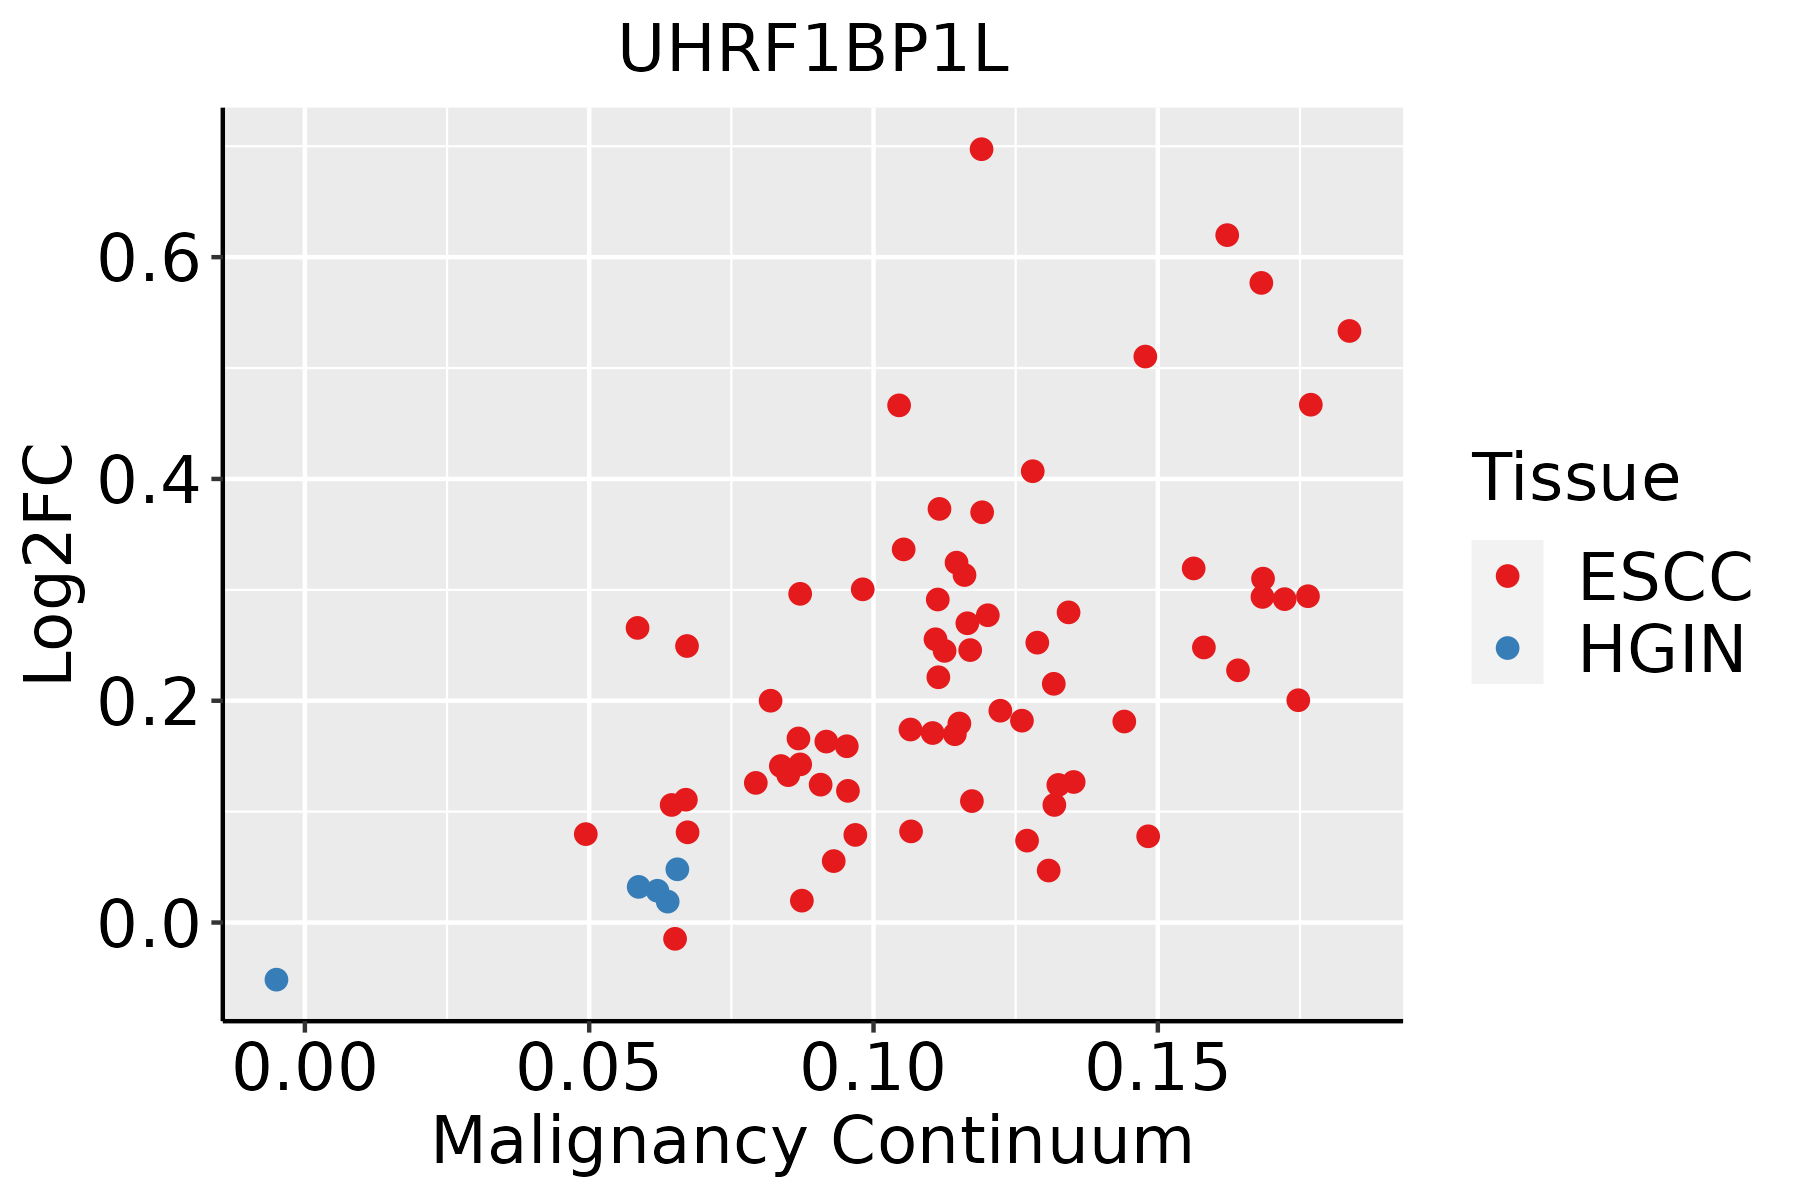 | ESCC: Esophageal squamous cell carcinoma |
| HGIN: High-grade intraepithelial neoplasias | ||
| LGIN: Low-grade intraepithelial neoplasias | ||
| Liver | 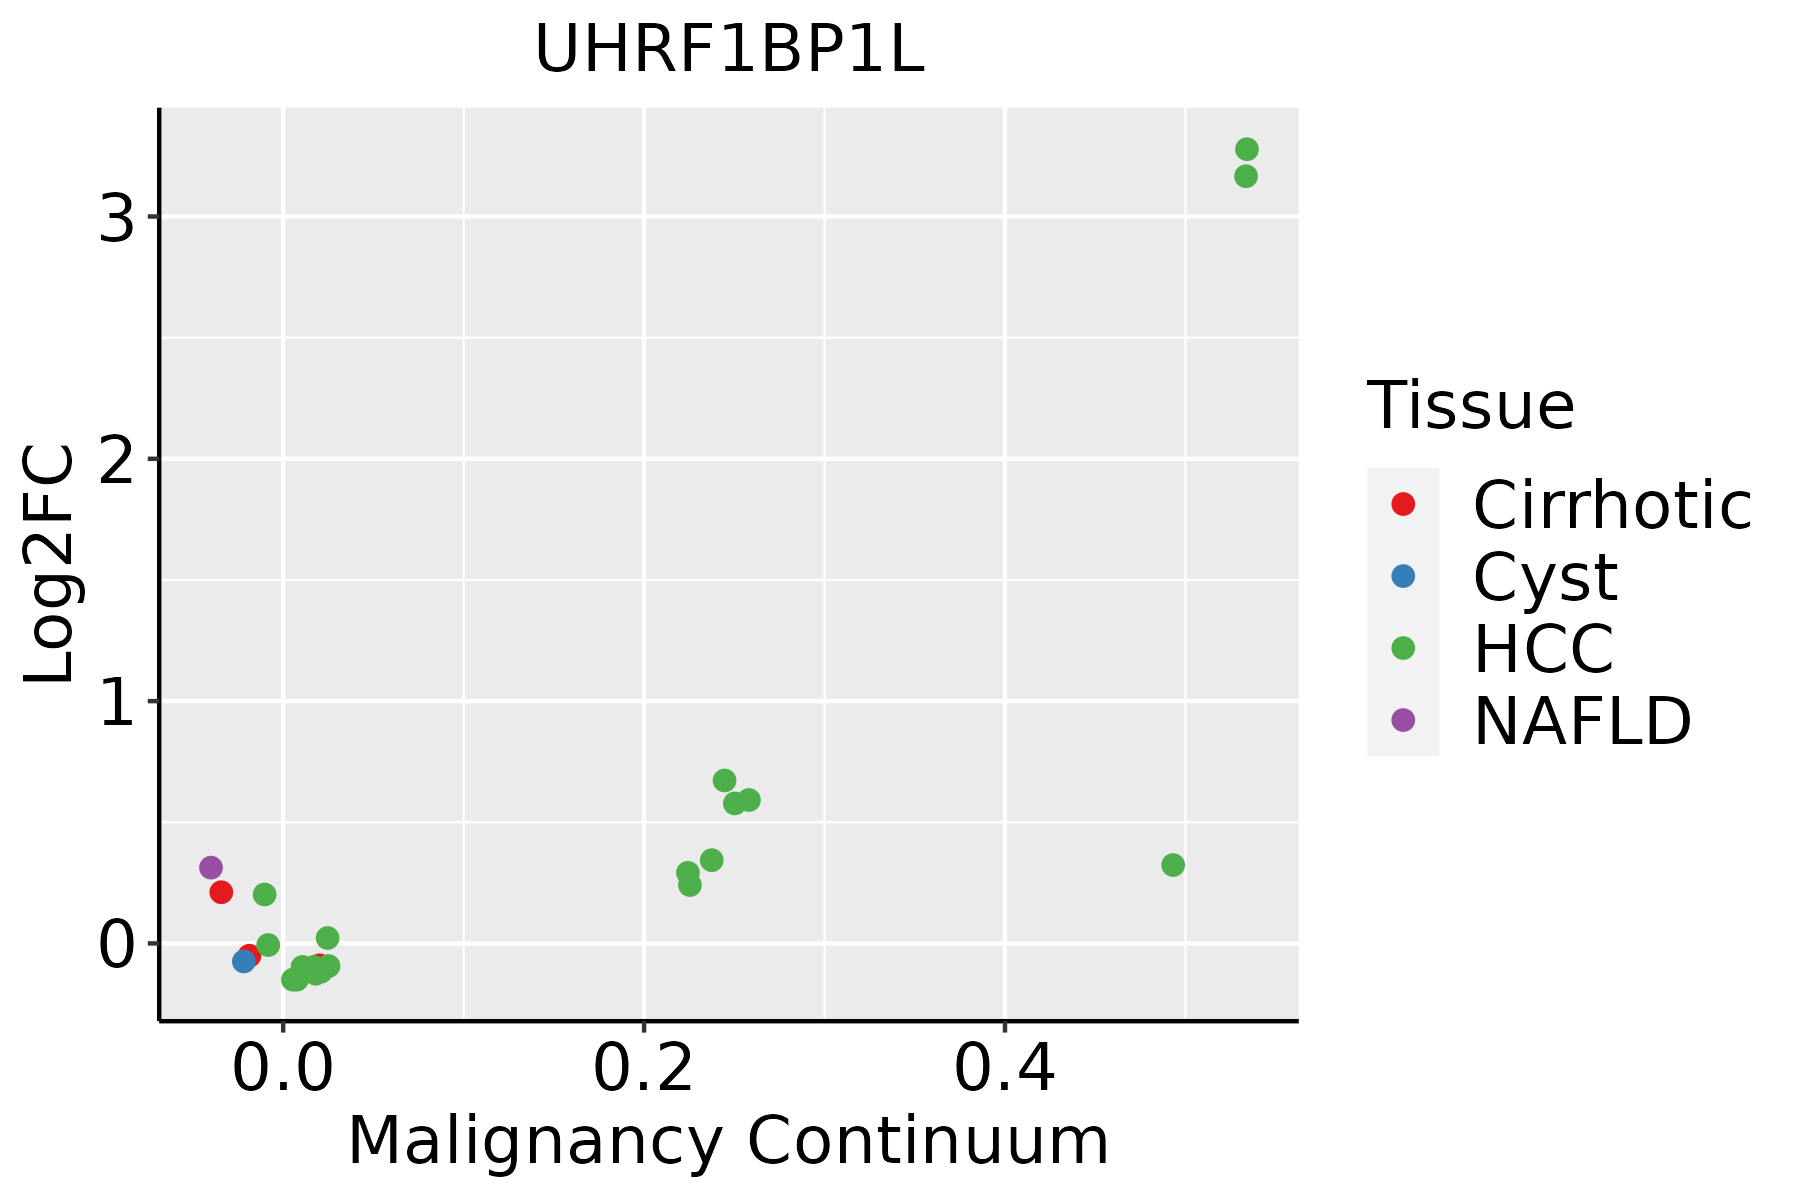 | HCC: Hepatocellular carcinoma |
| NAFLD: Non-alcoholic fatty liver disease |
| ∗log2FC in expression of this searched gene in stem-like cells from each diseased tissue sample relative to stem-like cells in normal samples in each tissue plotted against the malignancy continuum. Samples are colored based on if they are from different disease stage. |
Top |
Malignant transformation related pathway analysis |
| Find out the enriched GO biological processes and KEGG pathways involved in transition from healthy to precancer to cancer |
| Tissue | Disease Stage | Enriched GO biological Processes |
| Colorectum | AD |  |
| Colorectum | SER |  |
| Colorectum | MSS |  |
| Colorectum | MSI-H |  |
| Colorectum | FAP |  |
| ∗Top 15 enriched GO BP terms are showed in the bar plot of each disease state in each tissue. Each row represents a significant GO biological process which is colored according to the -log10(p.adjust). |
| Page: 1 2 3 4 5 6 7 8 9 |
| GO ID | Tissue | Disease Stage | Description | Gene Ratio | Bg Ratio | pvalue | p.adjust | Count |
| Page: 1 |
| Pathway ID | Tissue | Disease Stage | Description | Gene Ratio | Bg Ratio | pvalue | p.adjust | qvalue | Count |
| Page: 1 |
Top |
Cell-cell communication analysis |
| Identification of potential cell-cell interactions between two cell types and their ligand-receptor pairs for different disease states |
| Ligand | Receptor | LRpair | Pathway | Tissue | Disease Stage |
| Page: 1 |
Top |
Single-cell gene regulatory network inference analysis |
| Find out the significant the regulons (TFs) and the target genes of each regulon across cell types for different disease states |
| TF | Cell Type | Tissue | Disease Stage | Target Gene | RSS | Regulon Activity |
| ∗The dot plots of a searched regulon are shown for all cell subpopulations in each disease state of each tissue based on the regulon specific score inferred using pySCENIC and by calculating the average expression. |
| Page: 1 |
Top |
Somatic mutation of malignant transformation related genes |
| Annotation of somatic variants for genes involved in malignant transformation |
| Hugo Symbol | Variant Class | Variant Classification | dbSNP RS | HGVSc | HGVSp | HGVSp Short | SWISSPROT | BIOTYPE | SIFT | PolyPhen | Tumor Sample Barcode | Tissue | Histology | Sex | Age | Stage | Therapy Types | Drugs | Outcome |
| UHRF1BP1L | SNV | Missense_Mutation | c.3226N>G | p.Leu1076Val | p.L1076V | A0JNW5 | protein_coding | tolerated(0.35) | benign(0.424) | TCGA-A2-A0YJ-01 | Breast | breast invasive carcinoma | Female | <65 | III/IV | Chemotherapy | cytoxan | PD | |
| UHRF1BP1L | SNV | Missense_Mutation | rs373719344 | c.2399N>T | p.Ser800Leu | p.S800L | A0JNW5 | protein_coding | tolerated(0.14) | benign(0.155) | TCGA-AC-A23H-01 | Breast | breast invasive carcinoma | Female | >=65 | I/II | Unknown | Unknown | PD |
| UHRF1BP1L | SNV | Missense_Mutation | c.116T>C | p.Leu39Ser | p.L39S | A0JNW5 | protein_coding | deleterious(0) | probably_damaging(1) | TCGA-AN-A0AR-01 | Breast | breast invasive carcinoma | Female | <65 | I/II | Unknown | Unknown | SD | |
| UHRF1BP1L | SNV | Missense_Mutation | c.3355G>A | p.Asp1119Asn | p.D1119N | A0JNW5 | protein_coding | deleterious(0) | probably_damaging(1) | TCGA-AN-A0XW-01 | Breast | breast invasive carcinoma | Female | <65 | III/IV | Unknown | Unknown | SD | |
| UHRF1BP1L | SNV | Missense_Mutation | c.845N>T | p.Ser282Phe | p.S282F | A0JNW5 | protein_coding | deleterious(0) | benign(0.397) | TCGA-AO-A1KP-01 | Breast | breast invasive carcinoma | Female | >=65 | I/II | Chemotherapy | fluorouracil | SD | |
| UHRF1BP1L | SNV | Missense_Mutation | rs765566766 | c.3710N>A | p.Arg1237His | p.R1237H | A0JNW5 | protein_coding | tolerated(0.06) | benign(0.216) | TCGA-AR-A24R-01 | Breast | breast invasive carcinoma | Female | <65 | III/IV | Chemotherapy | cytoxan | SD |
| UHRF1BP1L | SNV | Missense_Mutation | c.3107C>A | p.Thr1036Asn | p.T1036N | A0JNW5 | protein_coding | tolerated(0.57) | benign(0) | TCGA-AR-A251-01 | Breast | breast invasive carcinoma | Female | <65 | III/IV | Chemotherapy | doxorubicin | SD | |
| UHRF1BP1L | SNV | Missense_Mutation | c.2255N>T | p.Ser752Leu | p.S752L | A0JNW5 | protein_coding | tolerated(0.09) | benign(0.175) | TCGA-BH-A0AW-01 | Breast | breast invasive carcinoma | Female | <65 | I/II | Chemotherapy | carboplatin | SD | |
| UHRF1BP1L | SNV | Missense_Mutation | c.3489C>G | p.Asn1163Lys | p.N1163K | A0JNW5 | protein_coding | tolerated(0.87) | benign(0.001) | TCGA-E9-A1RF-01 | Breast | breast invasive carcinoma | Female | >=65 | III/IV | Hormone Therapy | tamoxiphen | SD | |
| UHRF1BP1L | SNV | Missense_Mutation | c.293N>C | p.Arg98Thr | p.R98T | A0JNW5 | protein_coding | deleterious(0) | probably_damaging(1) | TCGA-EW-A1PD-01 | Breast | breast invasive carcinoma | Male | <65 | I/II | Chemotherapy | docetaxel | SD |
| Page: 1 2 3 4 5 6 7 8 9 10 11 12 13 14 15 16 17 18 |
Top |
Related drugs of malignant transformation related genes |
| Identification of chemicals and drugs interact with genes involved in malignant transfromation |
| (DGIdb 4.0) |
| Entrez ID | Symbol | Category | Interaction Types | Drug Claim Name | Drug Name | PMIDs |
| Page: 1 |

Copyright 2023-Present -The University of Texas Health Science Center at Houston |