
|
|||||
|
 | |
| |
| |
| |
| |
| |
|
Gene: UHMK1 |
Gene summary for UHMK1 |
| Gene information | Species | Human | Gene symbol | UHMK1 | Gene ID | 127933 |
| Gene name | U2AF homology motif kinase 1 | |
| Gene Alias | KIS | |
| Cytomap | 1q23.3 | |
| Gene Type | protein-coding | GO ID | GO:0006412 | UniProtAcc | Q8TAS1 |
Top |
Malignant transformation analysis |
| Identification of the aberrant gene expression in precancerous and cancerous lesions by comparing the gene expression of stem-like cells in diseased tissues with normal stem cells |
| Entrez ID | Symbol | Replicates | Species | Organ | Tissue | Adj P-value | Log2FC | Malignancy |
| 127933 | UHMK1 | LZE4T | Human | Esophagus | ESCC | 3.21e-07 | 4.96e-01 | 0.0811 |
| 127933 | UHMK1 | LZE7T | Human | Esophagus | ESCC | 2.86e-11 | 1.01e+00 | 0.0667 |
| 127933 | UHMK1 | LZE8T | Human | Esophagus | ESCC | 1.34e-02 | 4.18e-01 | 0.067 |
| 127933 | UHMK1 | LZE22T | Human | Esophagus | ESCC | 8.97e-05 | 4.89e-01 | 0.068 |
| 127933 | UHMK1 | LZE24T | Human | Esophagus | ESCC | 4.49e-12 | 5.48e-01 | 0.0596 |
| 127933 | UHMK1 | LZE21T | Human | Esophagus | ESCC | 7.39e-05 | 4.06e-01 | 0.0655 |
| 127933 | UHMK1 | P1T-E | Human | Esophagus | ESCC | 1.09e-03 | 6.22e-01 | 0.0875 |
| 127933 | UHMK1 | P2T-E | Human | Esophagus | ESCC | 1.36e-36 | 8.06e-01 | 0.1177 |
| 127933 | UHMK1 | P4T-E | Human | Esophagus | ESCC | 3.51e-33 | 9.71e-01 | 0.1323 |
| 127933 | UHMK1 | P5T-E | Human | Esophagus | ESCC | 1.59e-29 | 6.16e-01 | 0.1327 |
| 127933 | UHMK1 | P8T-E | Human | Esophagus | ESCC | 9.41e-31 | 6.24e-01 | 0.0889 |
| 127933 | UHMK1 | P9T-E | Human | Esophagus | ESCC | 3.28e-17 | 3.75e-01 | 0.1131 |
| 127933 | UHMK1 | P10T-E | Human | Esophagus | ESCC | 1.16e-30 | 5.95e-01 | 0.116 |
| 127933 | UHMK1 | P11T-E | Human | Esophagus | ESCC | 2.78e-13 | 6.76e-01 | 0.1426 |
| 127933 | UHMK1 | P12T-E | Human | Esophagus | ESCC | 4.50e-18 | 3.24e-01 | 0.1122 |
| 127933 | UHMK1 | P15T-E | Human | Esophagus | ESCC | 5.82e-39 | 1.03e+00 | 0.1149 |
| 127933 | UHMK1 | P16T-E | Human | Esophagus | ESCC | 1.34e-37 | 6.97e-01 | 0.1153 |
| 127933 | UHMK1 | P20T-E | Human | Esophagus | ESCC | 6.83e-23 | 7.91e-01 | 0.1124 |
| 127933 | UHMK1 | P21T-E | Human | Esophagus | ESCC | 3.57e-43 | 1.06e+00 | 0.1617 |
| 127933 | UHMK1 | P22T-E | Human | Esophagus | ESCC | 1.91e-38 | 6.72e-01 | 0.1236 |
| Page: 1 2 3 4 5 6 7 |
| Tissue | Expression Dynamics | Abbreviation |
| Esophagus | 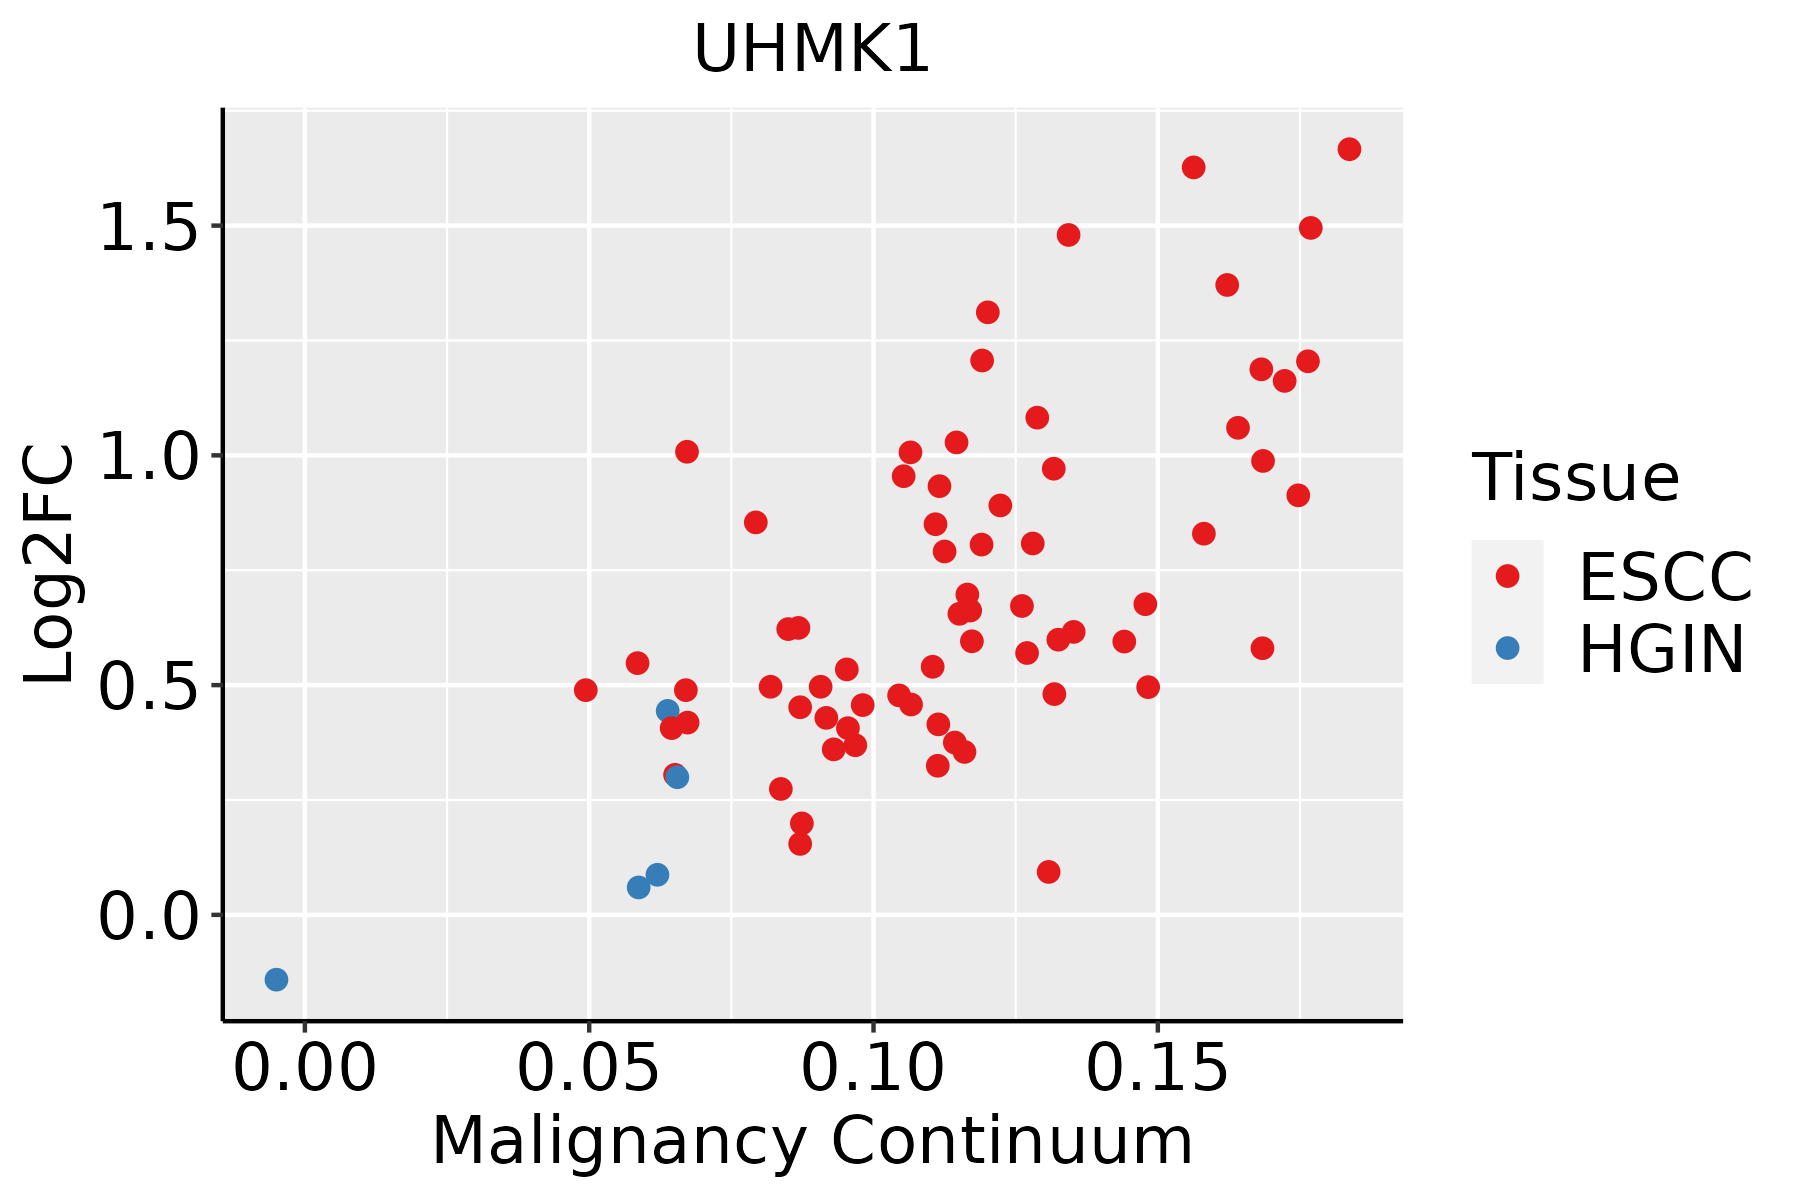 | ESCC: Esophageal squamous cell carcinoma |
| HGIN: High-grade intraepithelial neoplasias | ||
| LGIN: Low-grade intraepithelial neoplasias | ||
| Liver | 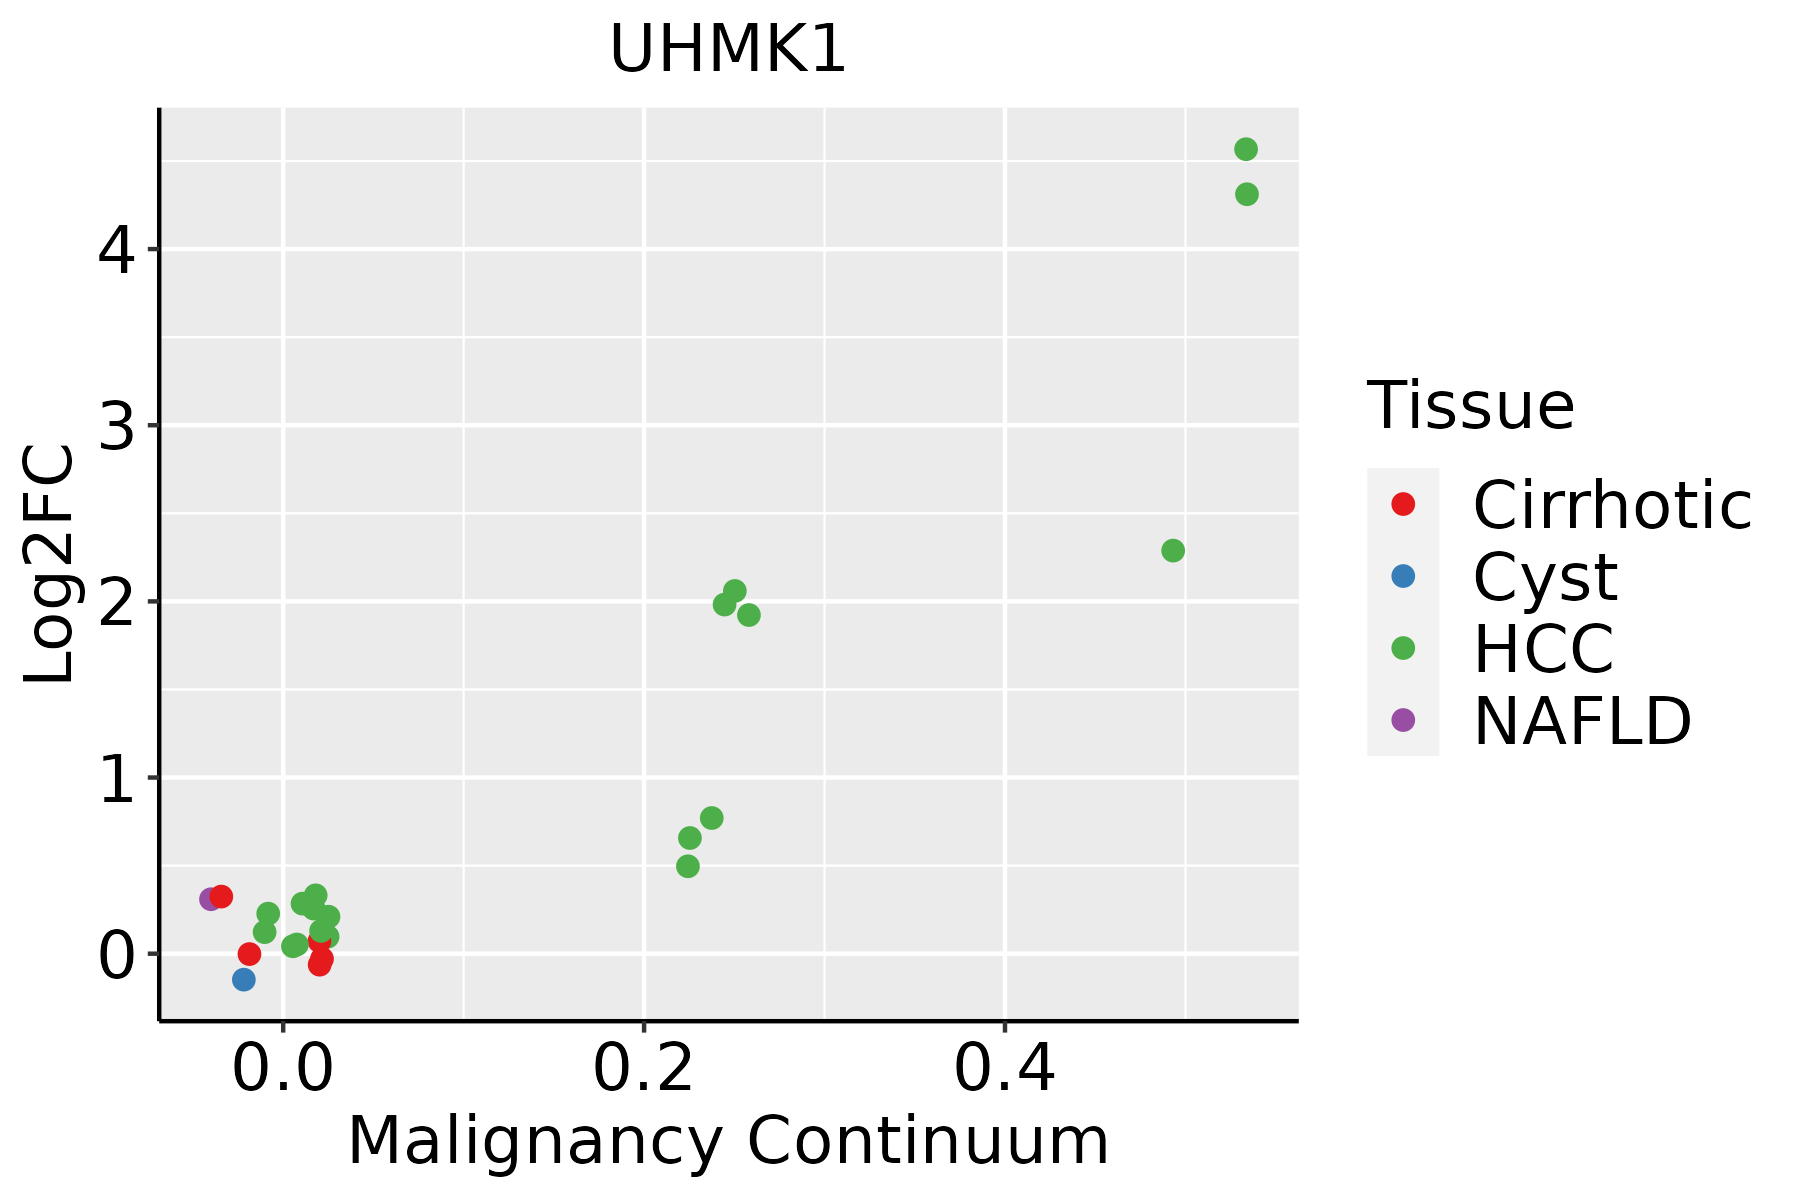 | HCC: Hepatocellular carcinoma |
| NAFLD: Non-alcoholic fatty liver disease | ||
| Oral Cavity | 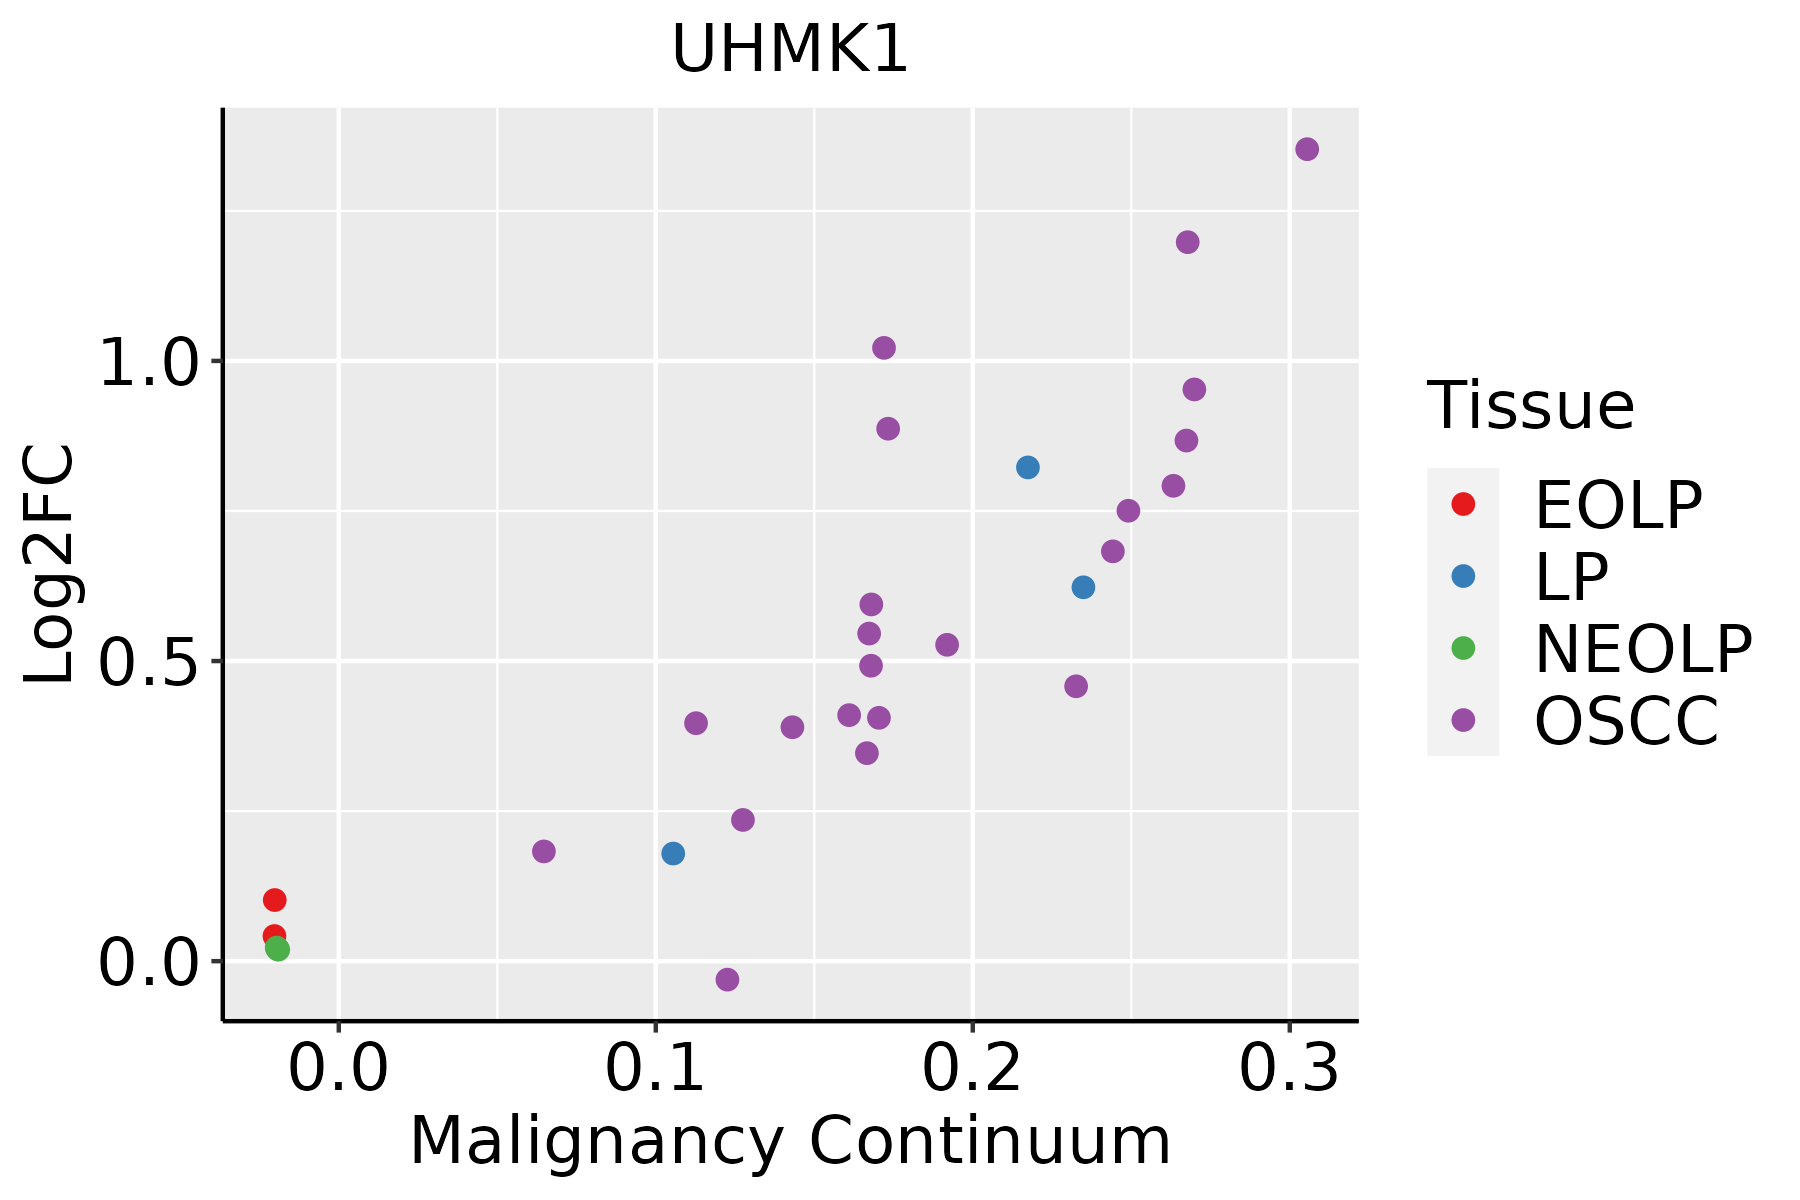 | EOLP: Erosive Oral lichen planus |
| LP: leukoplakia | ||
| NEOLP: Non-erosive oral lichen planus | ||
| OSCC: Oral squamous cell carcinoma | ||
| Prostate | 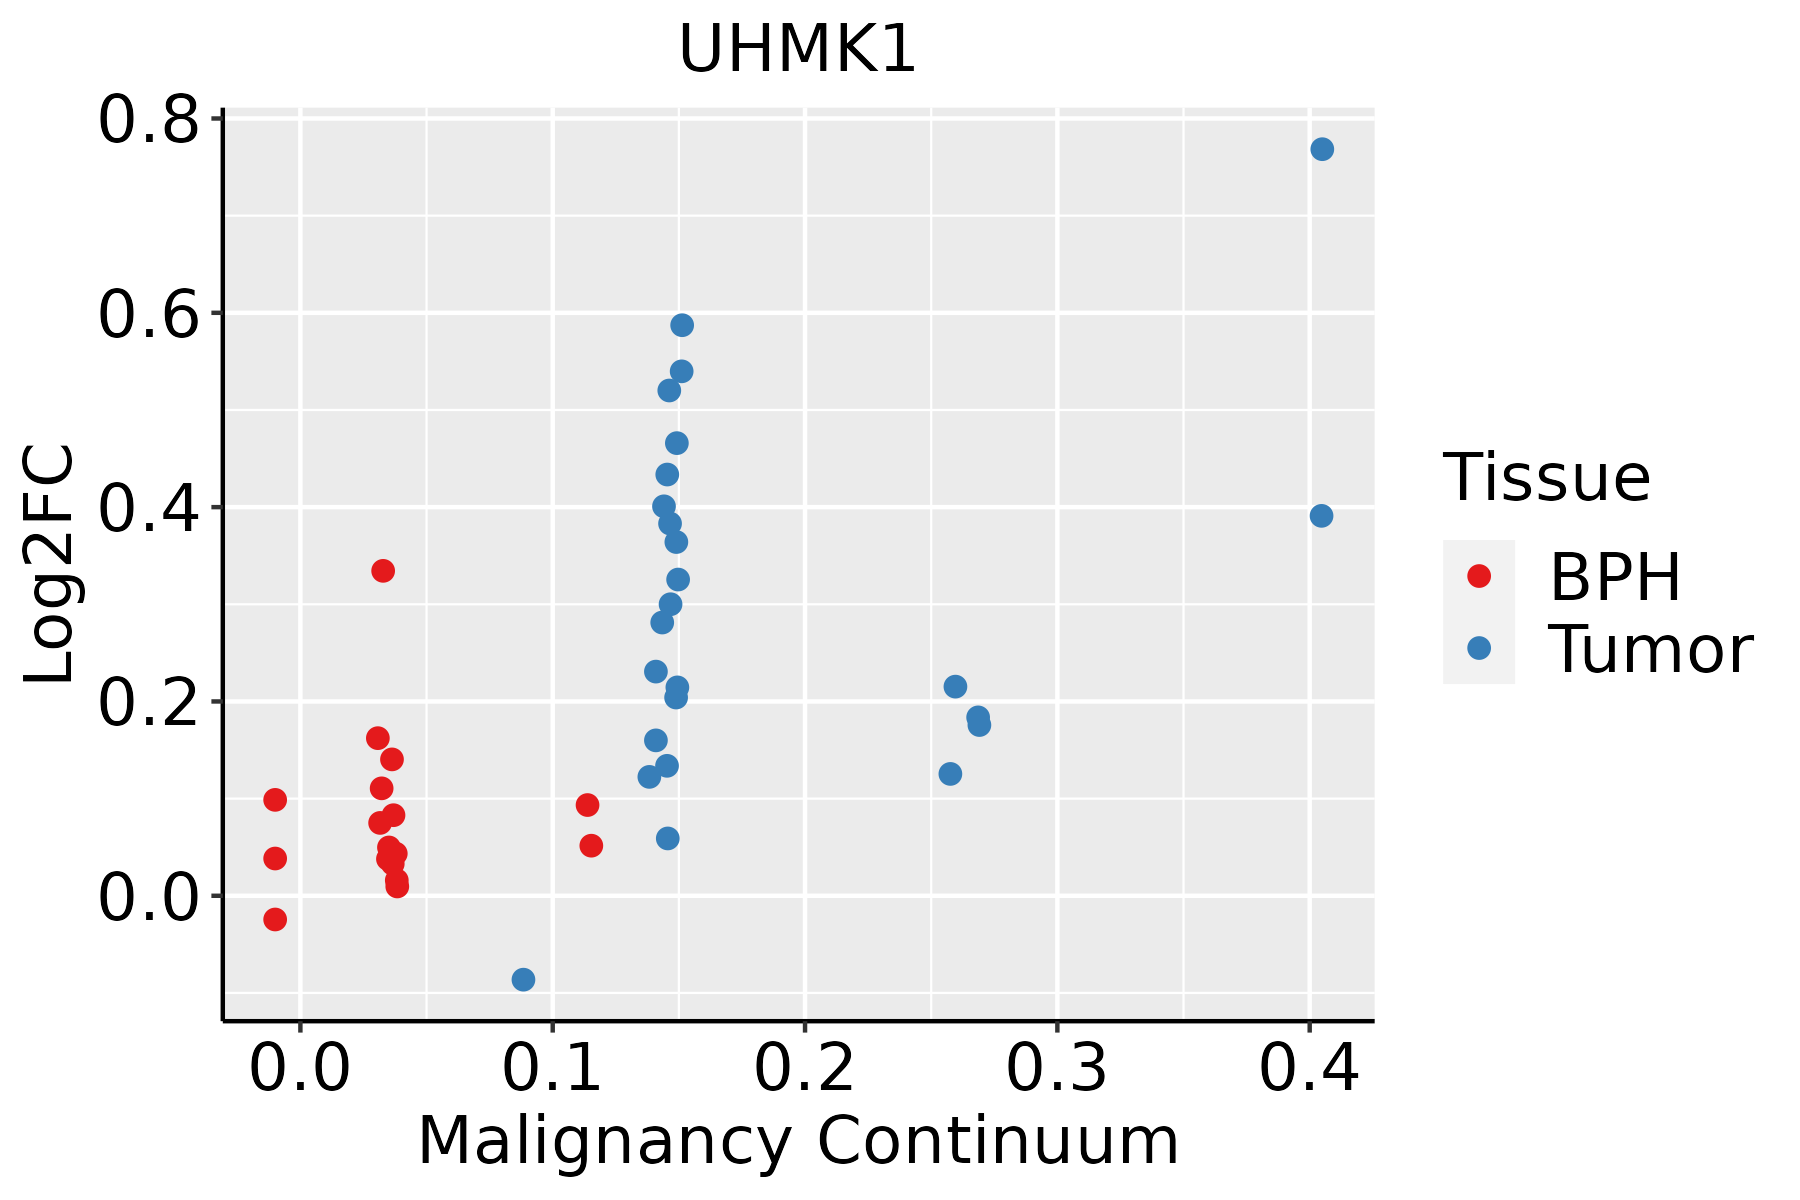 | BPH: Benign Prostatic Hyperplasia |
| Skin | 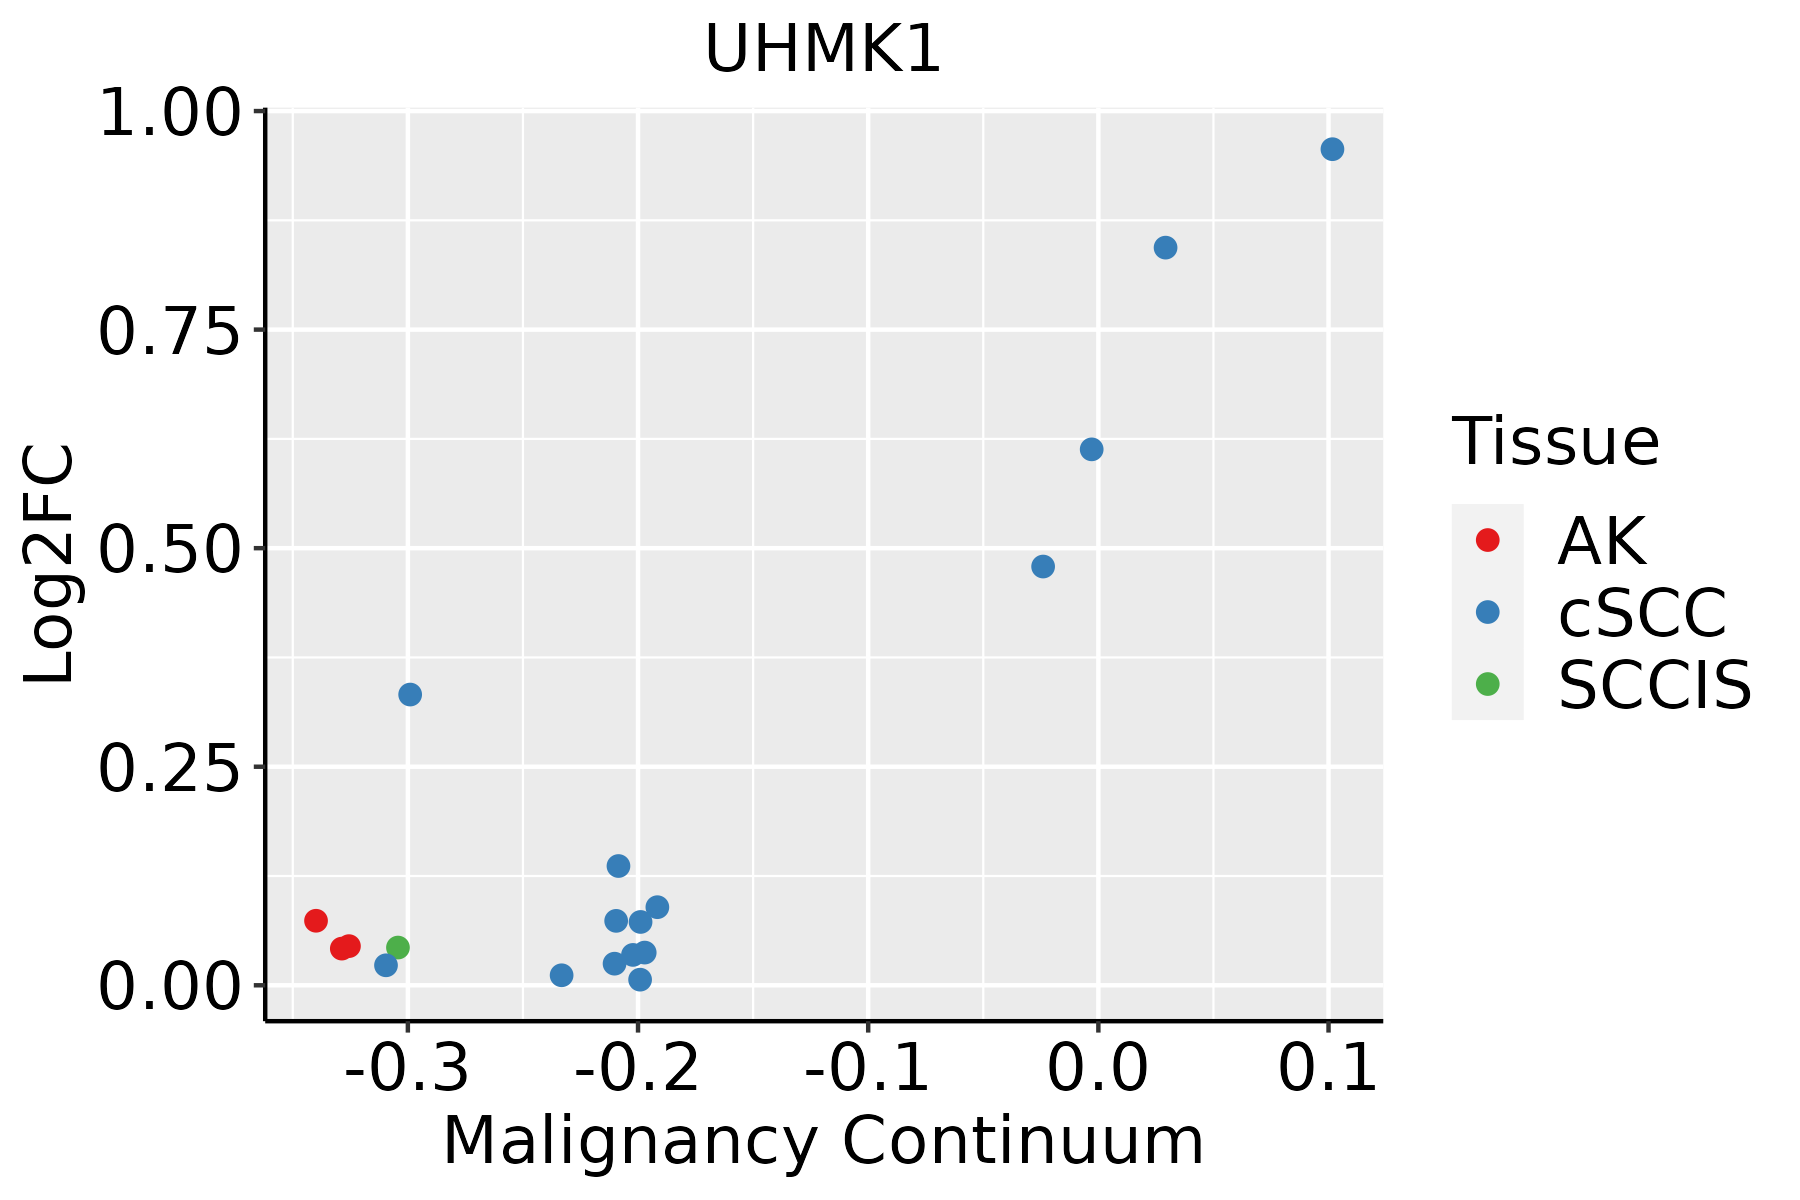 | AK: Actinic keratosis |
| cSCC: Cutaneous squamous cell carcinoma | ||
| SCCIS:squamous cell carcinoma in situ | ||
| Thyroid | 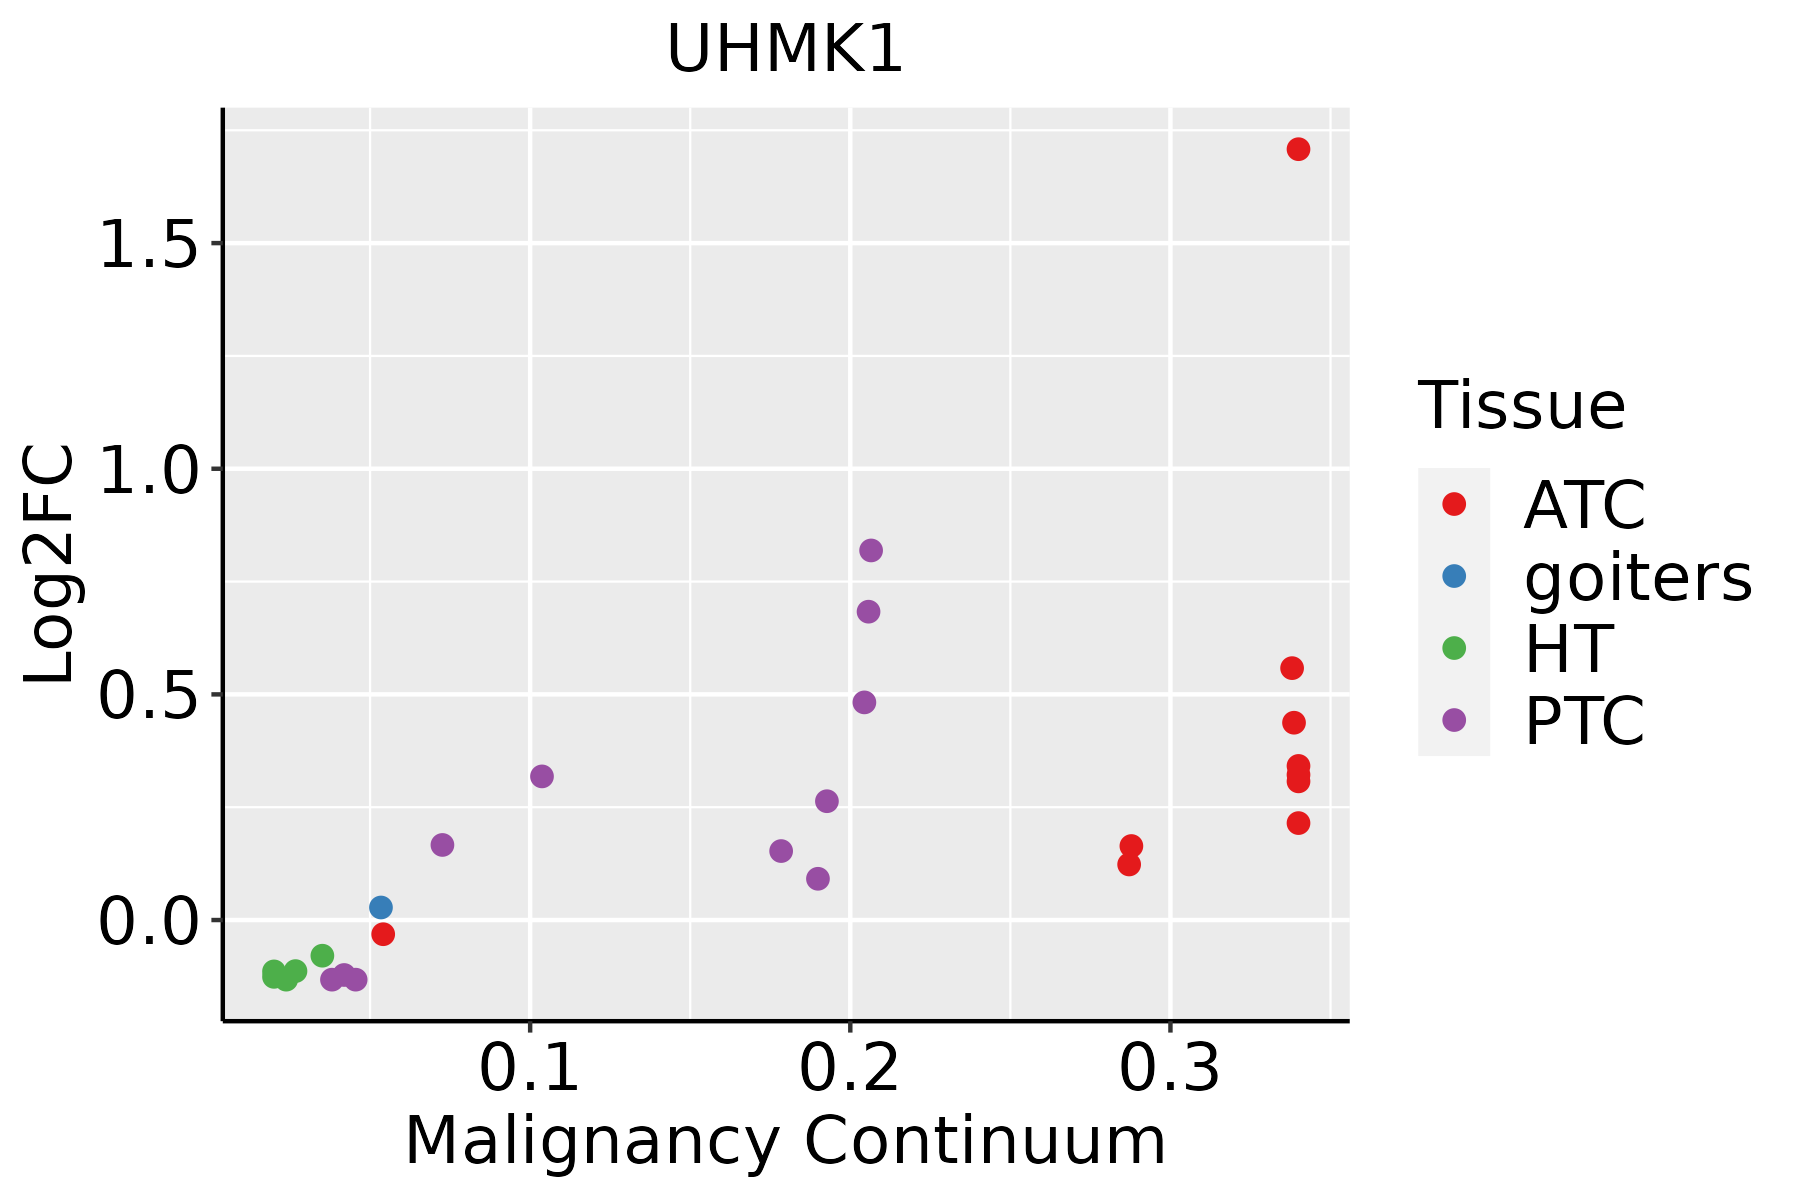 | ATC: Anaplastic thyroid cancer |
| HT: Hashimoto's thyroiditis | ||
| PTC: Papillary thyroid cancer |
| ∗log2FC in expression of this searched gene in stem-like cells from each diseased tissue sample relative to stem-like cells in normal samples in each tissue plotted against the malignancy continuum. Samples are colored based on if they are from different disease stage. |
Top |
Malignant transformation related pathway analysis |
| Find out the enriched GO biological processes and KEGG pathways involved in transition from healthy to precancer to cancer |
| Tissue | Disease Stage | Enriched GO biological Processes |
| Colorectum | AD |  |
| Colorectum | SER |  |
| Colorectum | MSS |  |
| Colorectum | MSI-H |  |
| Colorectum | FAP |  |
| ∗Top 15 enriched GO BP terms are showed in the bar plot of each disease state in each tissue. Each row represents a significant GO biological process which is colored according to the -log10(p.adjust). |
| Page: 1 2 3 4 5 6 7 8 9 |
| GO ID | Tissue | Disease Stage | Description | Gene Ratio | Bg Ratio | pvalue | p.adjust | Count |
| GO:0006913110 | Esophagus | ESCC | nucleocytoplasmic transport | 230/8552 | 301/18723 | 6.04e-28 | 2.02e-25 | 230 |
| GO:0051169110 | Esophagus | ESCC | nuclear transport | 230/8552 | 301/18723 | 6.04e-28 | 2.02e-25 | 230 |
| GO:003238618 | Esophagus | ESCC | regulation of intracellular transport | 243/8552 | 337/18723 | 3.20e-23 | 7.25e-21 | 243 |
| GO:0051168110 | Esophagus | ESCC | nuclear export | 126/8552 | 154/18723 | 1.88e-20 | 2.65e-18 | 126 |
| GO:0006413110 | Esophagus | ESCC | translational initiation | 100/8552 | 118/18723 | 1.16e-18 | 1.25e-16 | 100 |
| GO:0033157110 | Esophagus | ESCC | regulation of intracellular protein transport | 169/8552 | 229/18723 | 3.31e-18 | 3.23e-16 | 169 |
| GO:0006417111 | Esophagus | ESCC | regulation of translation | 304/8552 | 468/18723 | 1.53e-17 | 1.33e-15 | 304 |
| GO:0046822110 | Esophagus | ESCC | regulation of nucleocytoplasmic transport | 88/8552 | 106/18723 | 1.88e-15 | 1.19e-13 | 88 |
| GO:0045727111 | Esophagus | ESCC | positive regulation of translation | 107/8552 | 136/18723 | 2.79e-15 | 1.68e-13 | 107 |
| GO:0034250111 | Esophagus | ESCC | positive regulation of cellular amide metabolic process | 123/8552 | 162/18723 | 3.32e-15 | 1.93e-13 | 123 |
| GO:000644617 | Esophagus | ESCC | regulation of translational initiation | 65/8552 | 79/18723 | 2.04e-11 | 7.07e-10 | 65 |
| GO:000661117 | Esophagus | ESCC | protein export from nucleus | 48/8552 | 57/18723 | 1.92e-09 | 4.39e-08 | 48 |
| GO:004677710 | Esophagus | ESCC | protein autophosphorylation | 138/8552 | 227/18723 | 2.98e-06 | 3.38e-05 | 138 |
| GO:00182099 | Esophagus | ESCC | peptidyl-serine modification | 196/8552 | 338/18723 | 3.07e-06 | 3.47e-05 | 196 |
| GO:001810515 | Esophagus | ESCC | peptidyl-serine phosphorylation | 184/8552 | 315/18723 | 3.22e-06 | 3.61e-05 | 184 |
| GO:0046825110 | Esophagus | ESCC | regulation of protein export from nucleus | 26/8552 | 30/18723 | 3.79e-06 | 4.12e-05 | 26 |
| GO:00459483 | Esophagus | ESCC | positive regulation of translational initiation | 23/8552 | 30/18723 | 5.47e-04 | 3.00e-03 | 23 |
| GO:000641312 | Liver | Cirrhotic | translational initiation | 76/4634 | 118/18723 | 8.36e-20 | 2.18e-17 | 76 |
| GO:000641712 | Liver | Cirrhotic | regulation of translation | 194/4634 | 468/18723 | 7.28e-16 | 8.79e-14 | 194 |
| GO:003238611 | Liver | Cirrhotic | regulation of intracellular transport | 147/4634 | 337/18723 | 1.84e-14 | 1.72e-12 | 147 |
| Page: 1 2 3 4 5 6 7 |
| Pathway ID | Tissue | Disease Stage | Description | Gene Ratio | Bg Ratio | pvalue | p.adjust | qvalue | Count |
| Page: 1 |
Top |
Cell-cell communication analysis |
| Identification of potential cell-cell interactions between two cell types and their ligand-receptor pairs for different disease states |
| Ligand | Receptor | LRpair | Pathway | Tissue | Disease Stage |
| Page: 1 |
Top |
Single-cell gene regulatory network inference analysis |
| Find out the significant the regulons (TFs) and the target genes of each regulon across cell types for different disease states |
| TF | Cell Type | Tissue | Disease Stage | Target Gene | RSS | Regulon Activity |
| ∗The dot plots of a searched regulon are shown for all cell subpopulations in each disease state of each tissue based on the regulon specific score inferred using pySCENIC and by calculating the average expression. |
| Page: 1 |
Top |
Somatic mutation of malignant transformation related genes |
| Annotation of somatic variants for genes involved in malignant transformation |
| Hugo Symbol | Variant Class | Variant Classification | dbSNP RS | HGVSc | HGVSp | HGVSp Short | SWISSPROT | BIOTYPE | SIFT | PolyPhen | Tumor Sample Barcode | Tissue | Histology | Sex | Age | Stage | Therapy Types | Drugs | Outcome |
| UHMK1 | SNV | Missense_Mutation | novel | c.991N>A | p.Asp331Asn | p.D331N | Q8TAS1 | protein_coding | tolerated(0.15) | benign(0.127) | TCGA-E9-A3HO-01 | Breast | breast invasive carcinoma | Female | <65 | I/II | Chemotherapy | cyclophosphamide | CR |
| UHMK1 | SNV | Missense_Mutation | novel | c.445N>T | p.Leu149Phe | p.L149F | Q8TAS1 | protein_coding | deleterious(0.01) | probably_damaging(0.996) | TCGA-EA-A3Y4-01 | Cervix | cervical & endocervical cancer | Female | <65 | I/II | Unknown | Unknown | SD |
| UHMK1 | SNV | Missense_Mutation | c.20N>T | p.Ala7Val | p.A7V | Q8TAS1 | protein_coding | tolerated_low_confidence(0.37) | benign(0.009) | TCGA-AA-A01P-01 | Colorectum | colon adenocarcinoma | Female | >=65 | III/IV | Unknown | Unknown | PD | |
| UHMK1 | SNV | Missense_Mutation | rs777113900 | c.319N>T | p.Arg107Cys | p.R107C | Q8TAS1 | protein_coding | deleterious(0.01) | possibly_damaging(0.83) | TCGA-AA-A01R-01 | Colorectum | colon adenocarcinoma | Male | <65 | III/IV | Chemotherapy | 5-fluorouracil | PD |
| UHMK1 | SNV | Missense_Mutation | c.862N>A | p.Asp288Asn | p.D288N | Q8TAS1 | protein_coding | tolerated(0.3) | benign(0.007) | TCGA-AD-6895-01 | Colorectum | colon adenocarcinoma | Male | >=65 | III/IV | Unknown | Unknown | SD | |
| UHMK1 | SNV | Missense_Mutation | novel | c.302C>A | p.Ser101Tyr | p.S101Y | Q8TAS1 | protein_coding | tolerated(0.28) | benign(0.377) | TCGA-AG-A002-01 | Colorectum | rectum adenocarcinoma | Male | <65 | I/II | Unknown | Unknown | SD |
| UHMK1 | SNV | Missense_Mutation | c.553G>T | p.Gly185Cys | p.G185C | Q8TAS1 | protein_coding | tolerated(0.12) | probably_damaging(0.963) | TCGA-AP-A051-01 | Endometrium | uterine corpus endometrioid carcinoma | Female | >=65 | I/II | Unknown | Unknown | SD | |
| UHMK1 | SNV | Missense_Mutation | rs757757394 | c.788N>T | p.Ala263Val | p.A263V | Q8TAS1 | protein_coding | deleterious(0.05) | possibly_damaging(0.737) | TCGA-AX-A06F-01 | Endometrium | uterine corpus endometrioid carcinoma | Female | <65 | III/IV | Chemotherapy | carboplatin | SD |
| UHMK1 | SNV | Missense_Mutation | rs150990527 | c.811N>A | p.Ala271Thr | p.A271T | Q8TAS1 | protein_coding | tolerated(0.4) | possibly_damaging(0.675) | TCGA-AX-A0J1-01 | Endometrium | uterine corpus endometrioid carcinoma | Female | >=65 | I/II | Unknown | Unknown | SD |
| UHMK1 | SNV | Missense_Mutation | novel | c.281G>A | p.Gly94Glu | p.G94E | Q8TAS1 | protein_coding | deleterious(0.03) | probably_damaging(0.999) | TCGA-B5-A11E-01 | Endometrium | uterine corpus endometrioid carcinoma | Female | <65 | I/II | Unknown | Unknown | SD |
| Page: 1 2 3 4 |
Top |
Related drugs of malignant transformation related genes |
| Identification of chemicals and drugs interact with genes involved in malignant transfromation |
| (DGIdb 4.0) |
| Entrez ID | Symbol | Category | Interaction Types | Drug Claim Name | Drug Name | PMIDs |
| Page: 1 |

Copyright 2023-Present -The University of Texas Health Science Center at Houston |