
|
|||||
|
 | |
| |
| |
| |
| |
| |
|
Gene: UGT8 |
Gene summary for UGT8 |
| Gene information | Species | Human | Gene symbol | UGT8 | Gene ID | 7368 |
| Gene name | UDP glycosyltransferase 8 | |
| Gene Alias | CGT | |
| Cytomap | 4q26 | |
| Gene Type | protein-coding | GO ID | GO:0000902 | UniProtAcc | Q16880 |
Top |
Malignant transformation analysis |
| Identification of the aberrant gene expression in precancerous and cancerous lesions by comparing the gene expression of stem-like cells in diseased tissues with normal stem cells |
| Entrez ID | Symbol | Replicates | Species | Organ | Tissue | Adj P-value | Log2FC | Malignancy |
| 7368 | UGT8 | P2T-E | Human | Esophagus | ESCC | 6.07e-18 | 3.21e-01 | 0.1177 |
| 7368 | UGT8 | P4T-E | Human | Esophagus | ESCC | 2.68e-06 | 1.92e-01 | 0.1323 |
| 7368 | UGT8 | P8T-E | Human | Esophagus | ESCC | 2.08e-03 | 6.73e-02 | 0.0889 |
| 7368 | UGT8 | P12T-E | Human | Esophagus | ESCC | 4.68e-12 | 2.74e-01 | 0.1122 |
| 7368 | UGT8 | P15T-E | Human | Esophagus | ESCC | 2.23e-07 | 1.89e-01 | 0.1149 |
| 7368 | UGT8 | P16T-E | Human | Esophagus | ESCC | 6.04e-15 | 3.62e-01 | 0.1153 |
| 7368 | UGT8 | P20T-E | Human | Esophagus | ESCC | 8.85e-06 | 1.78e-01 | 0.1124 |
| 7368 | UGT8 | P23T-E | Human | Esophagus | ESCC | 6.51e-09 | 2.40e-01 | 0.108 |
| 7368 | UGT8 | P26T-E | Human | Esophagus | ESCC | 2.96e-49 | 8.68e-01 | 0.1276 |
| 7368 | UGT8 | P28T-E | Human | Esophagus | ESCC | 2.87e-13 | 2.87e-01 | 0.1149 |
| 7368 | UGT8 | P30T-E | Human | Esophagus | ESCC | 1.12e-04 | 1.66e-01 | 0.137 |
| 7368 | UGT8 | P32T-E | Human | Esophagus | ESCC | 5.23e-12 | 2.07e-01 | 0.1666 |
| 7368 | UGT8 | P37T-E | Human | Esophagus | ESCC | 3.61e-06 | 2.20e-01 | 0.1371 |
| 7368 | UGT8 | P48T-E | Human | Esophagus | ESCC | 2.98e-02 | 9.30e-02 | 0.0959 |
| 7368 | UGT8 | P52T-E | Human | Esophagus | ESCC | 1.35e-05 | 1.55e-01 | 0.1555 |
| 7368 | UGT8 | P61T-E | Human | Esophagus | ESCC | 7.64e-05 | 6.14e-02 | 0.099 |
| 7368 | UGT8 | P62T-E | Human | Esophagus | ESCC | 6.22e-29 | 5.94e-01 | 0.1302 |
| 7368 | UGT8 | P74T-E | Human | Esophagus | ESCC | 1.21e-11 | 3.47e-01 | 0.1479 |
| 7368 | UGT8 | P75T-E | Human | Esophagus | ESCC | 1.16e-02 | 7.73e-02 | 0.1125 |
| 7368 | UGT8 | P76T-E | Human | Esophagus | ESCC | 3.07e-06 | 1.89e-01 | 0.1207 |
| Page: 1 2 |
| Tissue | Expression Dynamics | Abbreviation |
| Esophagus | 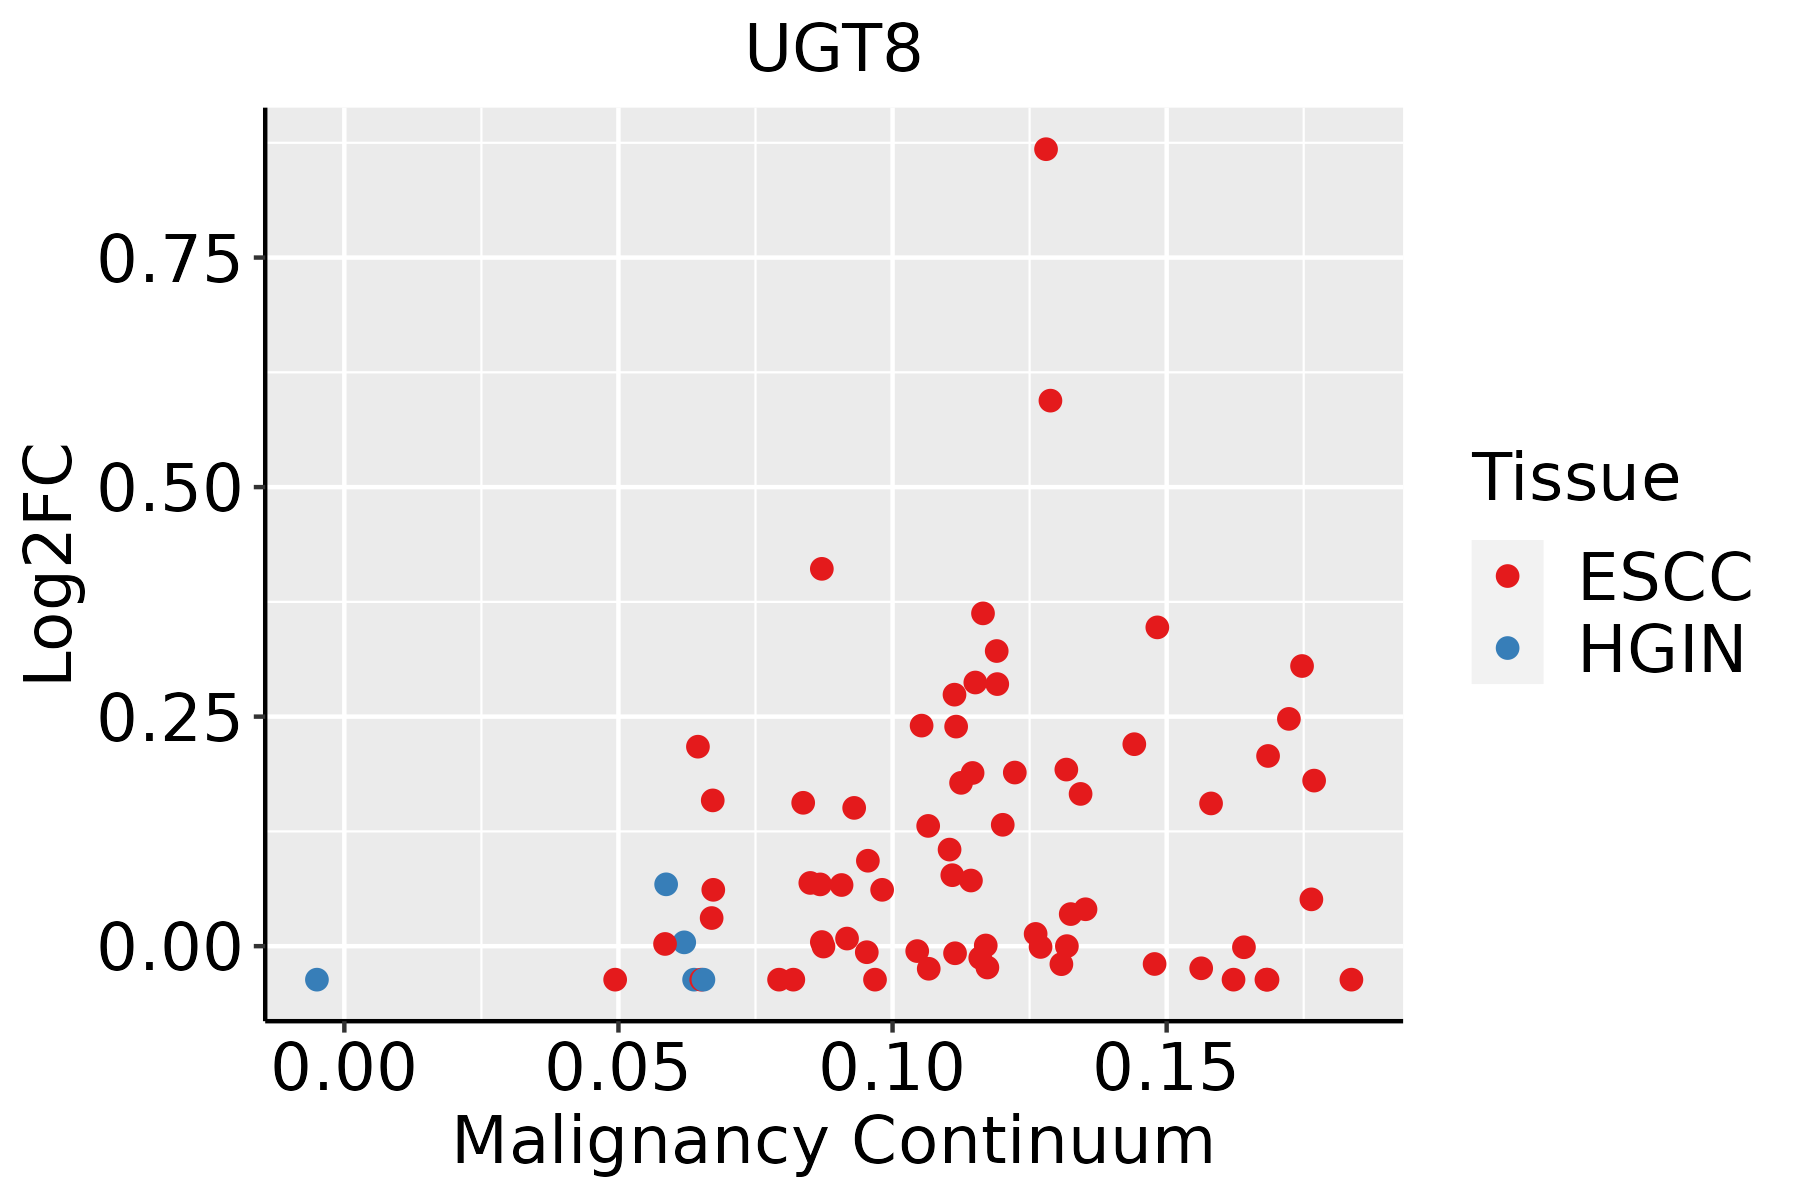 | ESCC: Esophageal squamous cell carcinoma |
| HGIN: High-grade intraepithelial neoplasias | ||
| LGIN: Low-grade intraepithelial neoplasias |
| ∗log2FC in expression of this searched gene in stem-like cells from each diseased tissue sample relative to stem-like cells in normal samples in each tissue plotted against the malignancy continuum. Samples are colored based on if they are from different disease stage. |
Top |
Malignant transformation related pathway analysis |
| Find out the enriched GO biological processes and KEGG pathways involved in transition from healthy to precancer to cancer |
| Tissue | Disease Stage | Enriched GO biological Processes |
| Colorectum | AD |  |
| Colorectum | SER |  |
| Colorectum | MSS |  |
| Colorectum | MSI-H |  |
| Colorectum | FAP |  |
| ∗Top 15 enriched GO BP terms are showed in the bar plot of each disease state in each tissue. Each row represents a significant GO biological process which is colored according to the -log10(p.adjust). |
| Page: 1 2 3 4 5 6 7 8 9 |
| GO ID | Tissue | Disease Stage | Description | Gene Ratio | Bg Ratio | pvalue | p.adjust | Count |
| GO:00066433 | Esophagus | ESCC | membrane lipid metabolic process | 130/8552 | 203/18723 | 9.29e-08 | 1.54e-06 | 130 |
| GO:00464673 | Esophagus | ESCC | membrane lipid biosynthetic process | 91/8552 | 142/18723 | 7.19e-06 | 7.19e-05 | 91 |
| GO:00425524 | Esophagus | ESCC | myelination | 85/8552 | 134/18723 | 2.51e-05 | 2.13e-04 | 85 |
| GO:00072724 | Esophagus | ESCC | ensheathment of neurons | 86/8552 | 136/18723 | 2.68e-05 | 2.24e-04 | 86 |
| GO:00083664 | Esophagus | ESCC | axon ensheathment | 86/8552 | 136/18723 | 2.68e-05 | 2.24e-04 | 86 |
| GO:00066652 | Esophagus | ESCC | sphingolipid metabolic process | 96/8552 | 155/18723 | 3.21e-05 | 2.66e-04 | 96 |
| GO:003432918 | Esophagus | ESCC | cell junction assembly | 227/8552 | 420/18723 | 3.06e-04 | 1.83e-03 | 227 |
| GO:00066642 | Esophagus | ESCC | glycolipid metabolic process | 63/8552 | 100/18723 | 3.55e-04 | 2.06e-03 | 63 |
| GO:19035092 | Esophagus | ESCC | liposaccharide metabolic process | 63/8552 | 101/18723 | 5.25e-04 | 2.90e-03 | 63 |
| GO:004521620 | Esophagus | ESCC | cell-cell junction organization | 114/8552 | 200/18723 | 8.04e-04 | 4.16e-03 | 114 |
| GO:00301481 | Esophagus | ESCC | sphingolipid biosynthetic process | 62/8552 | 103/18723 | 2.10e-03 | 9.38e-03 | 62 |
| GO:00066721 | Esophagus | ESCC | ceramide metabolic process | 61/8552 | 102/18723 | 2.82e-03 | 1.19e-02 | 61 |
| GO:0009247 | Esophagus | ESCC | glycolipid biosynthetic process | 42/8552 | 68/18723 | 5.48e-03 | 2.05e-02 | 42 |
| GO:0046513 | Esophagus | ESCC | ceramide biosynthetic process | 40/8552 | 65/18723 | 7.25e-03 | 2.63e-02 | 40 |
| Page: 1 |
| Pathway ID | Tissue | Disease Stage | Description | Gene Ratio | Bg Ratio | pvalue | p.adjust | qvalue | Count |
| Page: 1 |
Top |
Cell-cell communication analysis |
| Identification of potential cell-cell interactions between two cell types and their ligand-receptor pairs for different disease states |
| Ligand | Receptor | LRpair | Pathway | Tissue | Disease Stage |
| Page: 1 |
Top |
Single-cell gene regulatory network inference analysis |
| Find out the significant the regulons (TFs) and the target genes of each regulon across cell types for different disease states |
| TF | Cell Type | Tissue | Disease Stage | Target Gene | RSS | Regulon Activity |
| ∗The dot plots of a searched regulon are shown for all cell subpopulations in each disease state of each tissue based on the regulon specific score inferred using pySCENIC and by calculating the average expression. |
| Page: 1 |
Top |
Somatic mutation of malignant transformation related genes |
| Annotation of somatic variants for genes involved in malignant transformation |
| Hugo Symbol | Variant Class | Variant Classification | dbSNP RS | HGVSc | HGVSp | HGVSp Short | SWISSPROT | BIOTYPE | SIFT | PolyPhen | Tumor Sample Barcode | Tissue | Histology | Sex | Age | Stage | Therapy Types | Drugs | Outcome |
| UGT8 | SNV | Missense_Mutation | c.28N>G | p.Leu10Val | p.L10V | Q16880 | protein_coding | tolerated(0.2) | benign(0.096) | TCGA-AC-A23H-01 | Breast | breast invasive carcinoma | Female | >=65 | I/II | Unknown | Unknown | PD | |
| UGT8 | SNV | Missense_Mutation | c.304G>A | p.Glu102Lys | p.E102K | Q16880 | protein_coding | tolerated(0.12) | benign(0.19) | TCGA-AN-A046-01 | Breast | breast invasive carcinoma | Female | >=65 | I/II | Unknown | Unknown | SD | |
| UGT8 | SNV | Missense_Mutation | c.1328G>A | p.Arg443Gln | p.R443Q | Q16880 | protein_coding | deleterious(0.03) | possibly_damaging(0.687) | TCGA-AN-A046-01 | Breast | breast invasive carcinoma | Female | >=65 | I/II | Unknown | Unknown | SD | |
| UGT8 | SNV | Missense_Mutation | rs753512165 | c.801N>C | p.Lys267Asn | p.K267N | Q16880 | protein_coding | deleterious(0.03) | possibly_damaging(0.678) | TCGA-BH-A0AZ-01 | Breast | breast invasive carcinoma | Female | <65 | III/IV | Chemotherapy | doxorubicin | CR |
| UGT8 | SNV | Missense_Mutation | c.1028N>C | p.Gln343Pro | p.Q343P | Q16880 | protein_coding | deleterious(0.01) | probably_damaging(1) | TCGA-E9-A1N3-01 | Breast | breast invasive carcinoma | Female | >=65 | III/IV | Chemotherapy | 5-fluorouracil | CR | |
| UGT8 | SNV | Missense_Mutation | novel | c.1234G>T | p.Ala412Ser | p.A412S | Q16880 | protein_coding | deleterious(0.05) | possibly_damaging(0.58) | TCGA-GM-A2DC-01 | Breast | breast invasive carcinoma | Female | <65 | I/II | Chemotherapy | xeloda | CR |
| UGT8 | SNV | Missense_Mutation | c.80C>T | p.Pro27Leu | p.P27L | Q16880 | protein_coding | deleterious(0) | probably_damaging(0.999) | TCGA-A6-6781-01 | Colorectum | colon adenocarcinoma | Male | <65 | III/IV | Chemotherapy | oxaliplatin | SD | |
| UGT8 | SNV | Missense_Mutation | rs767674399 | c.1315N>T | p.His439Tyr | p.H439Y | Q16880 | protein_coding | deleterious(0.01) | possibly_damaging(0.884) | TCGA-AA-3693-01 | Colorectum | colon adenocarcinoma | Female | >=65 | III/IV | Unknown | Unknown | SD |
| UGT8 | SNV | Missense_Mutation | c.565N>G | p.Asn189Asp | p.N189D | Q16880 | protein_coding | tolerated(0.15) | benign(0.019) | TCGA-AA-3864-01 | Colorectum | colon adenocarcinoma | Male | >=65 | I/II | Unknown | Unknown | SD | |
| UGT8 | SNV | Missense_Mutation | rs760771718 | c.736G>A | p.Val246Ile | p.V246I | Q16880 | protein_coding | tolerated(0.59) | benign(0.009) | TCGA-AA-3966-01 | Colorectum | colon adenocarcinoma | Female | >=65 | I/II | Unknown | Unknown | SD |
| Page: 1 2 3 4 5 6 7 8 9 |
Top |
Related drugs of malignant transformation related genes |
| Identification of chemicals and drugs interact with genes involved in malignant transfromation |
| (DGIdb 4.0) |
| Entrez ID | Symbol | Category | Interaction Types | Drug Claim Name | Drug Name | PMIDs |
| Page: 1 |

Copyright 2023-Present -The University of Texas Health Science Center at Houston |