
|
|||||
|
 | |
| |
| |
| |
| |
| |
|
Gene: UGT3A2 |
Gene summary for UGT3A2 |
| Gene information | Species | Human | Gene symbol | UGT3A2 | Gene ID | 167127 |
| Gene name | UDP glycosyltransferase family 3 member A2 | |
| Gene Alias | UGT3A2 | |
| Cytomap | 5p13.2 | |
| Gene Type | protein-coding | GO ID | GO:0008150 | UniProtAcc | Q3SY77 |
Top |
Malignant transformation analysis |
| Identification of the aberrant gene expression in precancerous and cancerous lesions by comparing the gene expression of stem-like cells in diseased tissues with normal stem cells |
| Entrez ID | Symbol | Replicates | Species | Organ | Tissue | Adj P-value | Log2FC | Malignancy |
| 167127 | UGT3A2 | S014 | Human | Liver | HCC | 2.66e-13 | 4.30e-01 | 0.2254 |
| 167127 | UGT3A2 | S015 | Human | Liver | HCC | 7.14e-27 | 1.06e+00 | 0.2375 |
| 167127 | UGT3A2 | S016 | Human | Liver | HCC | 4.24e-18 | 5.04e-01 | 0.2243 |
| Page: 1 |
| Tissue | Expression Dynamics | Abbreviation |
| Liver | 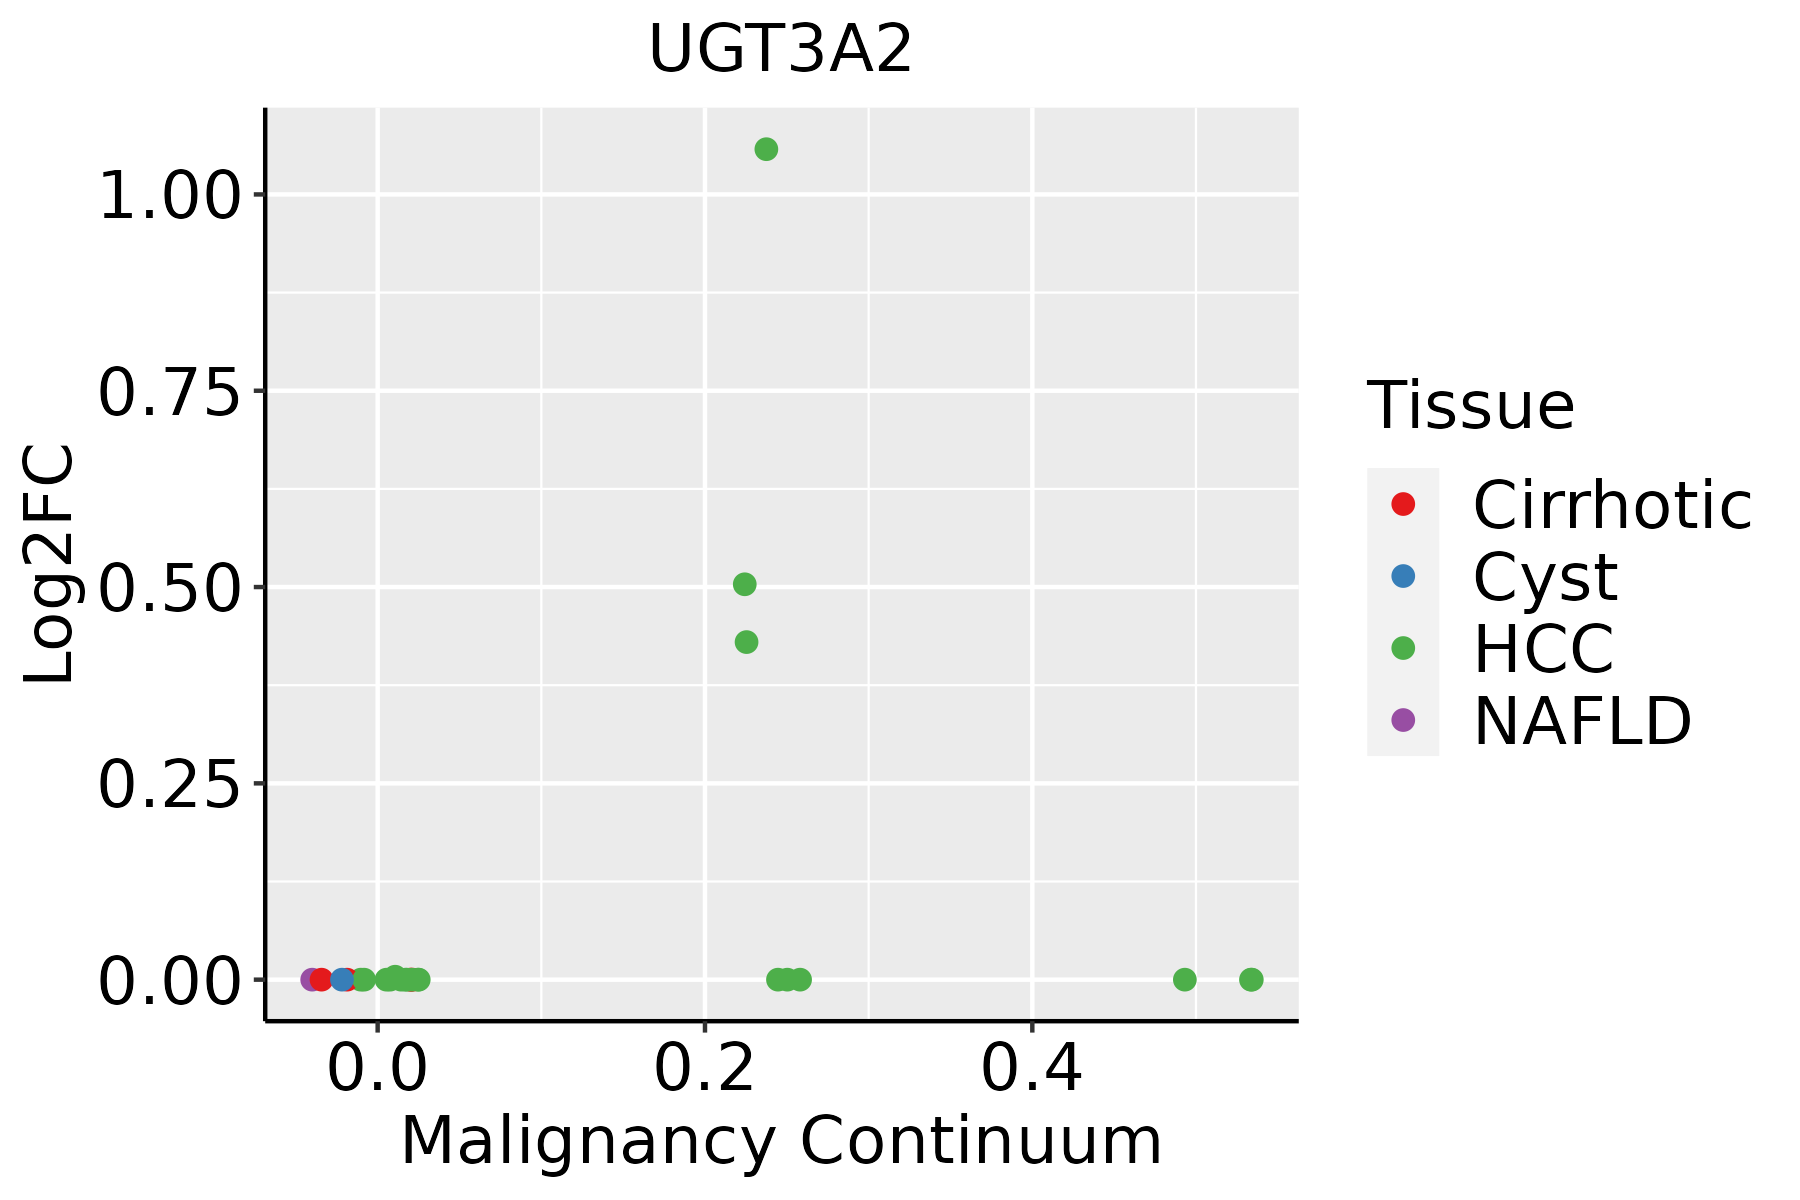 | HCC: Hepatocellular carcinoma |
| NAFLD: Non-alcoholic fatty liver disease |
| ∗log2FC in expression of this searched gene in stem-like cells from each diseased tissue sample relative to stem-like cells in normal samples in each tissue plotted against the malignancy continuum. Samples are colored based on if they are from different disease stage. |
Top |
Malignant transformation related pathway analysis |
| Find out the enriched GO biological processes and KEGG pathways involved in transition from healthy to precancer to cancer |
| Tissue | Disease Stage | Enriched GO biological Processes |
| Colorectum | AD |  |
| Colorectum | SER |  |
| Colorectum | MSS |  |
| Colorectum | MSI-H |  |
| Colorectum | FAP |  |
| ∗Top 15 enriched GO BP terms are showed in the bar plot of each disease state in each tissue. Each row represents a significant GO biological process which is colored according to the -log10(p.adjust). |
| Page: 1 2 3 4 5 6 7 8 9 |
| GO ID | Tissue | Disease Stage | Description | Gene Ratio | Bg Ratio | pvalue | p.adjust | Count |
| GO:190165422 | Liver | HCC | response to ketone | 119/7958 | 194/18723 | 8.65e-08 | 1.72e-06 | 119 |
| GO:19016552 | Liver | HCC | cellular response to ketone | 58/7958 | 96/18723 | 2.99e-04 | 2.13e-03 | 58 |
| Page: 1 |
| Pathway ID | Tissue | Disease Stage | Description | Gene Ratio | Bg Ratio | pvalue | p.adjust | qvalue | Count |
| Page: 1 |
Top |
Cell-cell communication analysis |
| Identification of potential cell-cell interactions between two cell types and their ligand-receptor pairs for different disease states |
| Ligand | Receptor | LRpair | Pathway | Tissue | Disease Stage |
| Page: 1 |
Top |
Single-cell gene regulatory network inference analysis |
| Find out the significant the regulons (TFs) and the target genes of each regulon across cell types for different disease states |
| TF | Cell Type | Tissue | Disease Stage | Target Gene | RSS | Regulon Activity |
| ∗The dot plots of a searched regulon are shown for all cell subpopulations in each disease state of each tissue based on the regulon specific score inferred using pySCENIC and by calculating the average expression. |
| Page: 1 |
Top |
Somatic mutation of malignant transformation related genes |
| Annotation of somatic variants for genes involved in malignant transformation |
| Hugo Symbol | Variant Class | Variant Classification | dbSNP RS | HGVSc | HGVSp | HGVSp Short | SWISSPROT | BIOTYPE | SIFT | PolyPhen | Tumor Sample Barcode | Tissue | Histology | Sex | Age | Stage | Therapy Types | Drugs | Outcome |
| UGT3A2 | SNV | Missense_Mutation | novel | c.322G>A | p.Glu108Lys | p.E108K | Q3SY77 | protein_coding | tolerated(0.12) | benign(0.338) | TCGA-5L-AAT0-01 | Breast | breast invasive carcinoma | Female | <65 | I/II | Hormone Therapy | tamoxiphen | SD |
| UGT3A2 | SNV | Missense_Mutation | rs201308652 | c.1367T>G | p.Val456Gly | p.V456G | Q3SY77 | protein_coding | deleterious(0.02) | probably_damaging(0.922) | TCGA-A2-A0CW-01 | Breast | breast invasive carcinoma | Female | >=65 | I/II | Hormone Therapy | anastrozole | SD |
| UGT3A2 | SNV | Missense_Mutation | rs199567567 | c.1406N>T | p.Thr469Met | p.T469M | Q3SY77 | protein_coding | deleterious(0.03) | benign(0.436) | TCGA-B6-A1KF-01 | Breast | breast invasive carcinoma | Female | >=65 | I/II | Unknown | Unknown | SD |
| UGT3A2 | SNV | Missense_Mutation | novel | c.718N>T | p.Leu240Phe | p.L240F | Q3SY77 | protein_coding | deleterious(0) | probably_damaging(1) | TCGA-BH-A0B6-01 | Breast | breast invasive carcinoma | Female | <65 | I/II | Unknown | Unknown | SD |
| UGT3A2 | insertion | Frame_Shift_Ins | novel | c.603_604insGAGCCAG | p.Lys202GlufsTer10 | p.K202Efs*10 | Q3SY77 | protein_coding | TCGA-AR-A0TU-01 | Breast | breast invasive carcinoma | Female | <65 | I/II | Unspecific | Doxorubicin | SD | ||
| UGT3A2 | insertion | Frame_Shift_Ins | novel | c.374_375insT | p.Leu125PhefsTer3 | p.L125Ffs*3 | Q3SY77 | protein_coding | TCGA-E9-A54Y-01 | Breast | breast invasive carcinoma | Female | <65 | III/IV | Unknown | Unknown | SD | ||
| UGT3A2 | SNV | Missense_Mutation | c.1498N>G | p.Leu500Val | p.L500V | Q3SY77 | protein_coding | tolerated(0.74) | benign(0.007) | TCGA-C5-A2LZ-01 | Cervix | cervical & endocervical cancer | Female | >=65 | III/IV | Unknown | Unknown | PD | |
| UGT3A2 | SNV | Missense_Mutation | c.22N>T | p.Leu8Phe | p.L8F | Q3SY77 | protein_coding | deleterious(0.04) | probably_damaging(0.986) | TCGA-JW-A5VL-01 | Cervix | cervical & endocervical cancer | Female | <65 | I/II | Unknown | Unknown | SD | |
| UGT3A2 | SNV | Missense_Mutation | c.964N>T | p.His322Tyr | p.H322Y | Q3SY77 | protein_coding | tolerated(0.08) | possibly_damaging(0.74) | TCGA-JX-A3Q0-01 | Cervix | cervical & endocervical cancer | Female | <65 | III/IV | Unknown | Unknown | SD | |
| UGT3A2 | SNV | Missense_Mutation | c.796G>A | p.Val266Ile | p.V266I | Q3SY77 | protein_coding | tolerated(0.18) | benign(0.122) | TCGA-A6-5661-01 | Colorectum | colon adenocarcinoma | Female | >=65 | I/II | Unknown | Unknown | SD |
| Page: 1 2 3 4 5 6 7 8 9 10 |
Top |
Related drugs of malignant transformation related genes |
| Identification of chemicals and drugs interact with genes involved in malignant transfromation |
| (DGIdb 4.0) |
| Entrez ID | Symbol | Category | Interaction Types | Drug Claim Name | Drug Name | PMIDs |
| Page: 1 |

Copyright 2023-Present -The University of Texas Health Science Center at Houston |