
|
|||||
|
 | |
| |
| |
| |
| |
| |
|
Gene: UGT2B4 |
Gene summary for UGT2B4 |
| Gene information | Species | Human | Gene symbol | UGT2B4 | Gene ID | 7363 |
| Gene name | UDP glucuronosyltransferase family 2 member B4 | |
| Gene Alias | HLUG25 | |
| Cytomap | 4q13.3 | |
| Gene Type | protein-coding | GO ID | GO:0006063 | UniProtAcc | P06133 |
Top |
Malignant transformation analysis |
| Identification of the aberrant gene expression in precancerous and cancerous lesions by comparing the gene expression of stem-like cells in diseased tissues with normal stem cells |
| Entrez ID | Symbol | Replicates | Species | Organ | Tissue | Adj P-value | Log2FC | Malignancy |
| 7363 | UGT2B4 | NAFLD1 | Human | Liver | NAFLD | 4.63e-02 | 3.48e-01 | -0.04 |
| 7363 | UGT2B4 | HCC1_Meng | Human | Liver | HCC | 5.99e-82 | 8.59e-01 | 0.0246 |
| 7363 | UGT2B4 | HCC2_Meng | Human | Liver | HCC | 4.78e-05 | -1.53e-01 | 0.0107 |
| 7363 | UGT2B4 | cirrhotic1 | Human | Liver | Cirrhotic | 3.23e-02 | -1.38e-01 | 0.0202 |
| 7363 | UGT2B4 | HCC1 | Human | Liver | HCC | 7.21e-42 | 4.50e+00 | 0.5336 |
| 7363 | UGT2B4 | HCC2 | Human | Liver | HCC | 1.22e-72 | 8.05e+00 | 0.5341 |
| 7363 | UGT2B4 | HCC5 | Human | Liver | HCC | 2.21e-04 | 2.69e+00 | 0.4932 |
| 7363 | UGT2B4 | Pt13.a | Human | Liver | HCC | 5.42e-44 | 9.94e-01 | 0.021 |
| 7363 | UGT2B4 | Pt13.b | Human | Liver | HCC | 1.62e-39 | 6.57e-01 | 0.0251 |
| 7363 | UGT2B4 | Pt13.c | Human | Liver | HCC | 8.35e-24 | 9.19e-01 | 0.0076 |
| 7363 | UGT2B4 | Pt14.a | Human | Liver | HCC | 5.40e-09 | 6.49e-01 | 0.0169 |
| 7363 | UGT2B4 | Pt14.b | Human | Liver | HCC | 1.25e-26 | 8.08e-01 | 0.018 |
| 7363 | UGT2B4 | Pt14.c | Human | Liver | HCC | 1.57e-03 | 5.75e-01 | 0.0054 |
| 7363 | UGT2B4 | Pt14.d | Human | Liver | HCC | 2.77e-20 | 7.91e-01 | 0.0143 |
| 7363 | UGT2B4 | S027 | Human | Liver | HCC | 4.77e-20 | 2.14e+00 | 0.2446 |
| 7363 | UGT2B4 | S028 | Human | Liver | HCC | 9.91e-48 | 2.06e+00 | 0.2503 |
| 7363 | UGT2B4 | S029 | Human | Liver | HCC | 1.75e-47 | 2.40e+00 | 0.2581 |
| Page: 1 |
| Tissue | Expression Dynamics | Abbreviation |
| Liver | 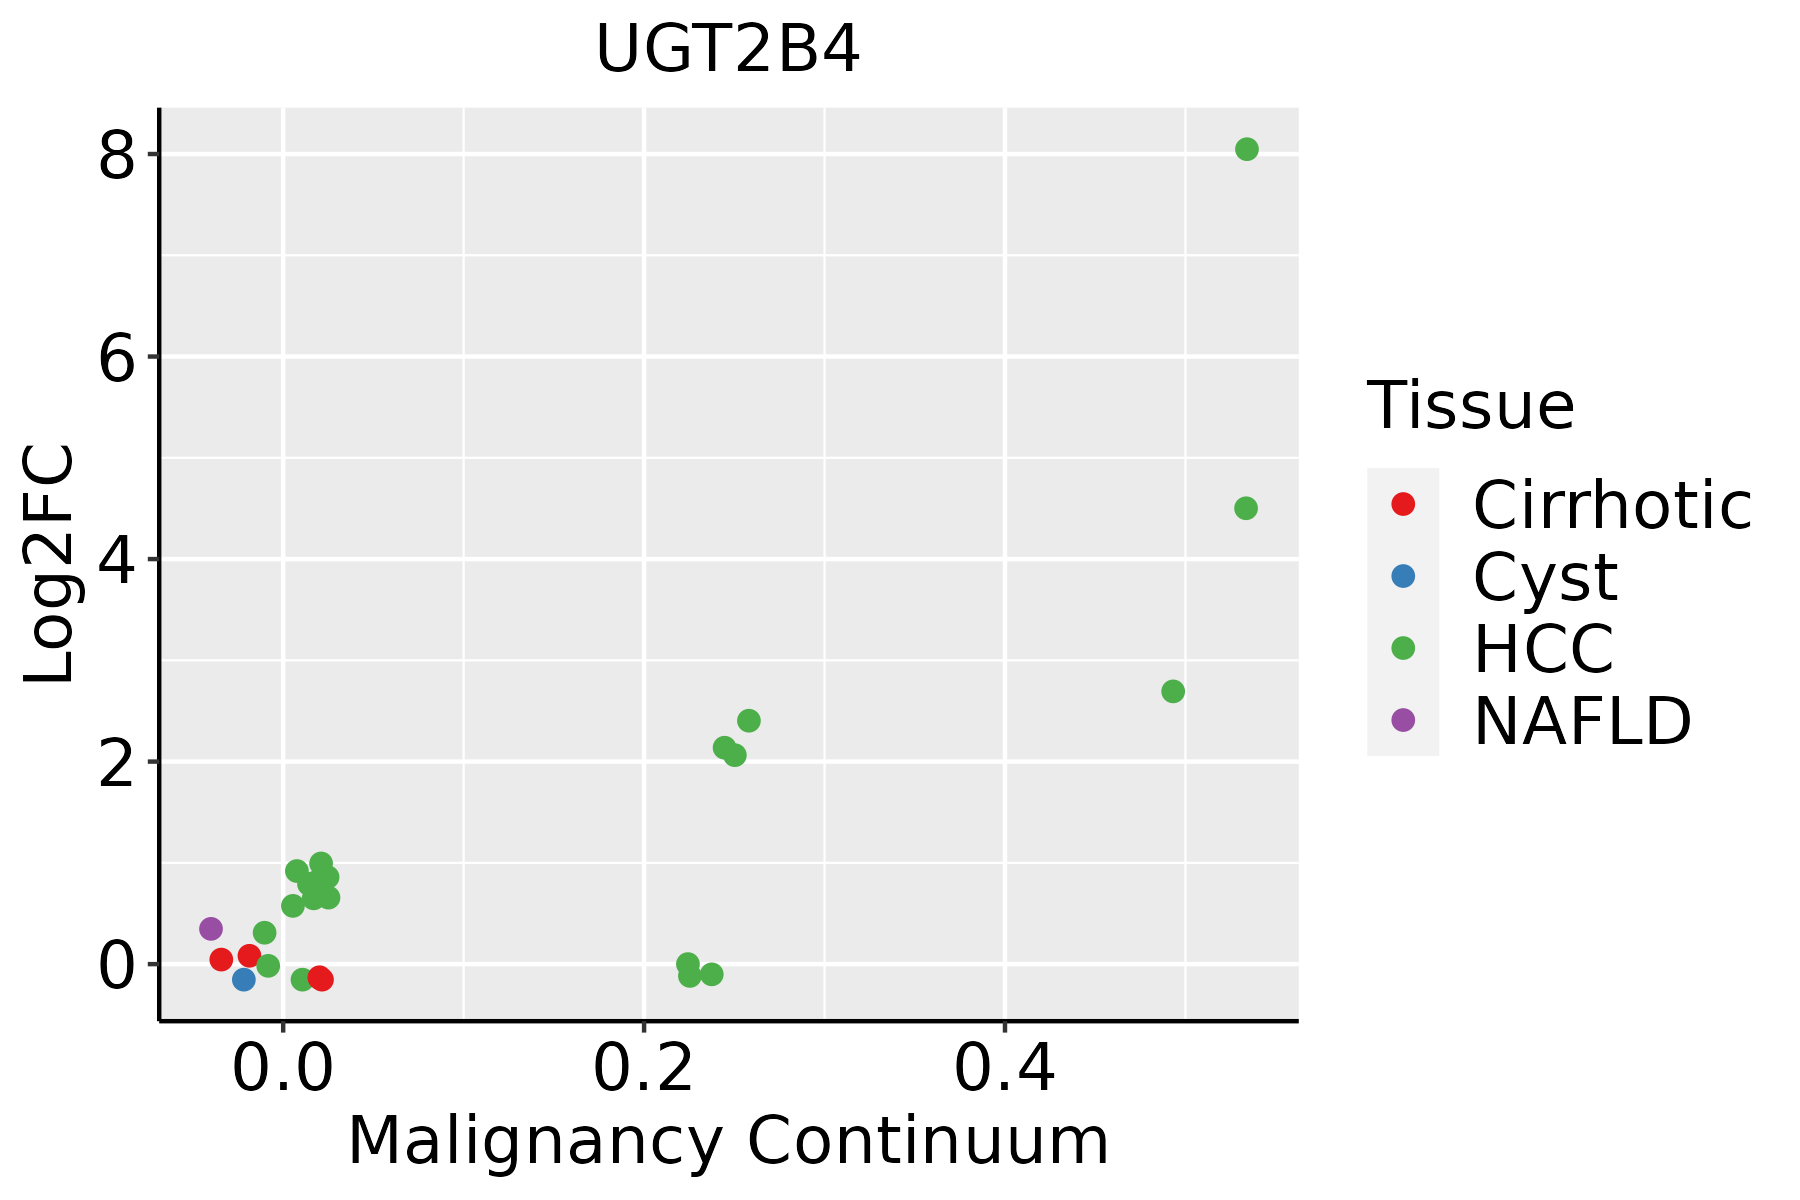 | HCC: Hepatocellular carcinoma |
| NAFLD: Non-alcoholic fatty liver disease |
| ∗log2FC in expression of this searched gene in stem-like cells from each diseased tissue sample relative to stem-like cells in normal samples in each tissue plotted against the malignancy continuum. Samples are colored based on if they are from different disease stage. |
Top |
Malignant transformation related pathway analysis |
| Find out the enriched GO biological processes and KEGG pathways involved in transition from healthy to precancer to cancer |
| Tissue | Disease Stage | Enriched GO biological Processes |
| Colorectum | AD |  |
| Colorectum | SER |  |
| Colorectum | MSS |  |
| Colorectum | MSI-H |  |
| Colorectum | FAP |  |
| ∗Top 15 enriched GO BP terms are showed in the bar plot of each disease state in each tissue. Each row represents a significant GO biological process which is colored according to the -log10(p.adjust). |
| Page: 1 2 3 4 5 6 7 8 9 |
| GO ID | Tissue | Disease Stage | Description | Gene Ratio | Bg Ratio | pvalue | p.adjust | Count |
| GO:00082023 | Liver | NAFLD | steroid metabolic process | 69/1882 | 319/18723 | 5.90e-10 | 1.28e-07 | 69 |
| GO:00424452 | Liver | NAFLD | hormone metabolic process | 36/1882 | 218/18723 | 1.98e-03 | 1.98e-02 | 36 |
| GO:0008210 | Liver | NAFLD | estrogen metabolic process | 10/1882 | 38/18723 | 3.49e-03 | 3.00e-02 | 10 |
| GO:000820211 | Liver | Cirrhotic | steroid metabolic process | 143/4634 | 319/18723 | 2.79e-15 | 3.18e-13 | 143 |
| GO:00082101 | Liver | Cirrhotic | estrogen metabolic process | 18/4634 | 38/18723 | 2.05e-03 | 1.27e-02 | 18 |
| GO:004244511 | Liver | Cirrhotic | hormone metabolic process | 73/4634 | 218/18723 | 2.22e-03 | 1.36e-02 | 73 |
| GO:00082022 | Liver | HCC | steroid metabolic process | 188/7958 | 319/18723 | 1.96e-09 | 5.63e-08 | 188 |
| Page: 1 |
| Pathway ID | Tissue | Disease Stage | Description | Gene Ratio | Bg Ratio | pvalue | p.adjust | qvalue | Count |
| hsa049762 | Liver | NAFLD | Bile secretion | 20/1043 | 89/8465 | 5.08e-03 | 4.43e-02 | 3.57e-02 | 20 |
| hsa0497611 | Liver | NAFLD | Bile secretion | 20/1043 | 89/8465 | 5.08e-03 | 4.43e-02 | 3.57e-02 | 20 |
| hsa01240 | Liver | Cirrhotic | Biosynthesis of cofactors | 66/2530 | 153/8465 | 3.11e-04 | 1.99e-03 | 1.23e-03 | 66 |
| hsa00983 | Liver | Cirrhotic | Drug metabolism - other enzymes | 34/2530 | 80/8465 | 1.08e-02 | 3.57e-02 | 2.20e-02 | 34 |
| hsa012401 | Liver | Cirrhotic | Biosynthesis of cofactors | 66/2530 | 153/8465 | 3.11e-04 | 1.99e-03 | 1.23e-03 | 66 |
| hsa009831 | Liver | Cirrhotic | Drug metabolism - other enzymes | 34/2530 | 80/8465 | 1.08e-02 | 3.57e-02 | 2.20e-02 | 34 |
| hsa012402 | Liver | HCC | Biosynthesis of cofactors | 103/4020 | 153/8465 | 4.67e-07 | 5.05e-06 | 2.81e-06 | 103 |
| hsa009832 | Liver | HCC | Drug metabolism - other enzymes | 54/4020 | 80/8465 | 2.25e-04 | 1.09e-03 | 6.08e-04 | 54 |
| hsa012403 | Liver | HCC | Biosynthesis of cofactors | 103/4020 | 153/8465 | 4.67e-07 | 5.05e-06 | 2.81e-06 | 103 |
| hsa009833 | Liver | HCC | Drug metabolism - other enzymes | 54/4020 | 80/8465 | 2.25e-04 | 1.09e-03 | 6.08e-04 | 54 |
| Page: 1 |
Top |
Cell-cell communication analysis |
| Identification of potential cell-cell interactions between two cell types and their ligand-receptor pairs for different disease states |
| Ligand | Receptor | LRpair | Pathway | Tissue | Disease Stage |
| Page: 1 |
Top |
Single-cell gene regulatory network inference analysis |
| Find out the significant the regulons (TFs) and the target genes of each regulon across cell types for different disease states |
| TF | Cell Type | Tissue | Disease Stage | Target Gene | RSS | Regulon Activity |
| ∗The dot plots of a searched regulon are shown for all cell subpopulations in each disease state of each tissue based on the regulon specific score inferred using pySCENIC and by calculating the average expression. |
| Page: 1 |
Top |
Somatic mutation of malignant transformation related genes |
| Annotation of somatic variants for genes involved in malignant transformation |
| Hugo Symbol | Variant Class | Variant Classification | dbSNP RS | HGVSc | HGVSp | HGVSp Short | SWISSPROT | BIOTYPE | SIFT | PolyPhen | Tumor Sample Barcode | Tissue | Histology | Sex | Age | Stage | Therapy Types | Drugs | Outcome |
| UGT2B4 | SNV | Missense_Mutation | rs750636266 | c.614N>C | p.Met205Thr | p.M205T | P06133 | protein_coding | deleterious(0) | probably_damaging(0.999) | TCGA-AN-A0AK-01 | Breast | breast invasive carcinoma | Female | >=65 | I/II | Unknown | Unknown | SD |
| UGT2B4 | SNV | Missense_Mutation | c.1329G>C | p.Met443Ile | p.M443I | P06133 | protein_coding | deleterious(0.03) | benign(0.005) | TCGA-BH-A0DZ-01 | Breast | breast invasive carcinoma | Female | <65 | I/II | Chemotherapy | docetaxel | SD | |
| UGT2B4 | SNV | Missense_Mutation | novel | c.1576A>G | p.Lys526Glu | p.K526E | P06133 | protein_coding | deleterious(0) | possibly_damaging(0.463) | TCGA-BH-AB28-01 | Breast | breast invasive carcinoma | Female | <65 | III/IV | Chemotherapy | taxotere | SD |
| UGT2B4 | deletion | Frame_Shift_Del | novel | c.852delN | p.Ala285ProfsTer39 | p.A285Pfs*39 | P06133 | protein_coding | TCGA-D8-A27V-01 | Breast | breast invasive carcinoma | Female | <65 | I/II | Hormone Therapy | tamoxiphen | SD | ||
| UGT2B4 | SNV | Missense_Mutation | c.1192N>A | p.Asp398Asn | p.D398N | P06133 | protein_coding | deleterious(0.03) | probably_damaging(0.965) | TCGA-C5-A2LZ-01 | Cervix | cervical & endocervical cancer | Female | >=65 | III/IV | Unknown | Unknown | PD | |
| UGT2B4 | SNV | Missense_Mutation | c.1329N>A | p.Met443Ile | p.M443I | P06133 | protein_coding | deleterious(0.03) | benign(0.005) | TCGA-C5-A907-01 | Cervix | cervical & endocervical cancer | Female | <65 | I/II | Chemotherapy | cisplatin | SD | |
| UGT2B4 | SNV | Missense_Mutation | rs767837637 | c.1444G>A | p.Asp482Asn | p.D482N | P06133 | protein_coding | tolerated(0.51) | benign(0.08) | TCGA-ZJ-AB0H-01 | Cervix | cervical & endocervical cancer | Female | <65 | III/IV | Unknown | Unknown | SD |
| UGT2B4 | SNV | Missense_Mutation | novel | c.532T>C | p.Tyr178His | p.Y178H | P06133 | protein_coding | tolerated(0.33) | possibly_damaging(0.873) | TCGA-5M-AAT6-01 | Colorectum | colon adenocarcinoma | Female | <65 | III/IV | Unknown | Unknown | PD |
| UGT2B4 | SNV | Missense_Mutation | c.1299T>G | p.Ile433Met | p.I433M | P06133 | protein_coding | deleterious(0.02) | possibly_damaging(0.483) | TCGA-A6-6141-01 | Colorectum | colon adenocarcinoma | Male | <65 | I/II | Chemotherapy | 5-fu | SD | |
| UGT2B4 | SNV | Missense_Mutation | c.1406G>A | p.Arg469His | p.R469H | P06133 | protein_coding | deleterious(0.04) | benign(0.159) | TCGA-A6-6648-01 | Colorectum | colon adenocarcinoma | Male | <65 | I/II | Chemotherapy | oxaliplatin | PD |
| Page: 1 2 3 4 5 6 7 8 9 10 |
Top |
Related drugs of malignant transformation related genes |
| Identification of chemicals and drugs interact with genes involved in malignant transfromation |
| (DGIdb 4.0) |
| Entrez ID | Symbol | Category | Interaction Types | Drug Claim Name | Drug Name | PMIDs |
| 7363 | UGT2B4 | DRUGGABLE GENOME | ibuprofen | IBUPROFEN | 25502615 |
| Page: 1 |

Copyright 2023-Present -The University of Texas Health Science Center at Houston |