
|
|||||
|
 | |
| |
| |
| |
| |
| |
|
Gene: UGT2B17 |
Gene summary for UGT2B17 |
| Gene information | Species | Human | Gene symbol | UGT2B17 | Gene ID | 7367 |
| Gene name | UDP glucuronosyltransferase family 2 member B17 | |
| Gene Alias | BMND12 | |
| Cytomap | 4q13.2 | |
| Gene Type | protein-coding | GO ID | GO:0006063 | UniProtAcc | O75795 |
Top |
Malignant transformation analysis |
| Identification of the aberrant gene expression in precancerous and cancerous lesions by comparing the gene expression of stem-like cells in diseased tissues with normal stem cells |
| Entrez ID | Symbol | Replicates | Species | Organ | Tissue | Adj P-value | Log2FC | Malignancy |
| 7367 | UGT2B17 | HTA11_2951_2000001011 | Human | Colorectum | AD | 3.39e-03 | -8.24e-01 | 0.0216 |
| 7367 | UGT2B17 | HTA11_1938_2000001011 | Human | Colorectum | AD | 8.17e-08 | 1.16e+00 | -0.0811 |
| 7367 | UGT2B17 | HTA11_78_2000001011 | Human | Colorectum | AD | 2.95e-07 | 7.41e-01 | -0.1088 |
| 7367 | UGT2B17 | HTA11_347_2000001011 | Human | Colorectum | AD | 2.68e-46 | 2.21e+00 | -0.1954 |
| 7367 | UGT2B17 | HTA11_2112_2000001011 | Human | Colorectum | SER | 1.55e-04 | -3.39e-01 | -0.2196 |
| 7367 | UGT2B17 | HTA11_83_2000001011 | Human | Colorectum | SER | 4.00e-07 | 9.10e-01 | -0.1526 |
| 7367 | UGT2B17 | HTA11_866_2000001011 | Human | Colorectum | AD | 3.82e-03 | 7.00e-01 | -0.1001 |
| 7367 | UGT2B17 | HTA11_1391_2000001011 | Human | Colorectum | AD | 2.90e-13 | 1.46e+00 | -0.059 |
| 7367 | UGT2B17 | HTA11_5212_2000001011 | Human | Colorectum | AD | 5.10e-04 | -5.82e-01 | -0.2061 |
| 7367 | UGT2B17 | HTA11_5216_2000001011 | Human | Colorectum | SER | 1.04e-14 | 1.45e+00 | -0.1462 |
| 7367 | UGT2B17 | HTA11_9341_2000001011 | Human | Colorectum | SER | 6.92e-04 | 8.63e-01 | -0.00410000000000005 |
| 7367 | UGT2B17 | HTA11_866_3004761011 | Human | Colorectum | AD | 4.32e-20 | -7.58e-01 | 0.096 |
| 7367 | UGT2B17 | HTA11_4255_2000001011 | Human | Colorectum | SER | 1.04e-06 | -9.24e-01 | 0.0446 |
| 7367 | UGT2B17 | HTA11_7663_2000001011 | Human | Colorectum | SER | 1.38e-07 | -9.24e-01 | 0.0131 |
| 7367 | UGT2B17 | HTA11_6801_2000001011 | Human | Colorectum | SER | 8.01e-21 | 1.86e+00 | 0.0171 |
| 7367 | UGT2B17 | HTA11_7696_3000711011 | Human | Colorectum | AD | 2.59e-32 | -8.14e-01 | 0.0674 |
| 7367 | UGT2B17 | HTA11_7469_2000001011 | Human | Colorectum | AD | 1.62e-02 | 8.29e-01 | -0.0124 |
| 7367 | UGT2B17 | HTA11_99999970781_79442 | Human | Colorectum | MSS | 5.75e-49 | -9.24e-01 | 0.294 |
| 7367 | UGT2B17 | HTA11_99999965104_69814 | Human | Colorectum | MSS | 3.81e-06 | -6.57e-01 | 0.281 |
| 7367 | UGT2B17 | HTA11_99999971662_82457 | Human | Colorectum | MSS | 1.98e-49 | -9.24e-01 | 0.3859 |
| Page: 1 2 3 |
| Tissue | Expression Dynamics | Abbreviation |
| Colorectum (GSE201348) |  | FAP: Familial adenomatous polyposis |
| CRC: Colorectal cancer | ||
| Colorectum (HTA11) | 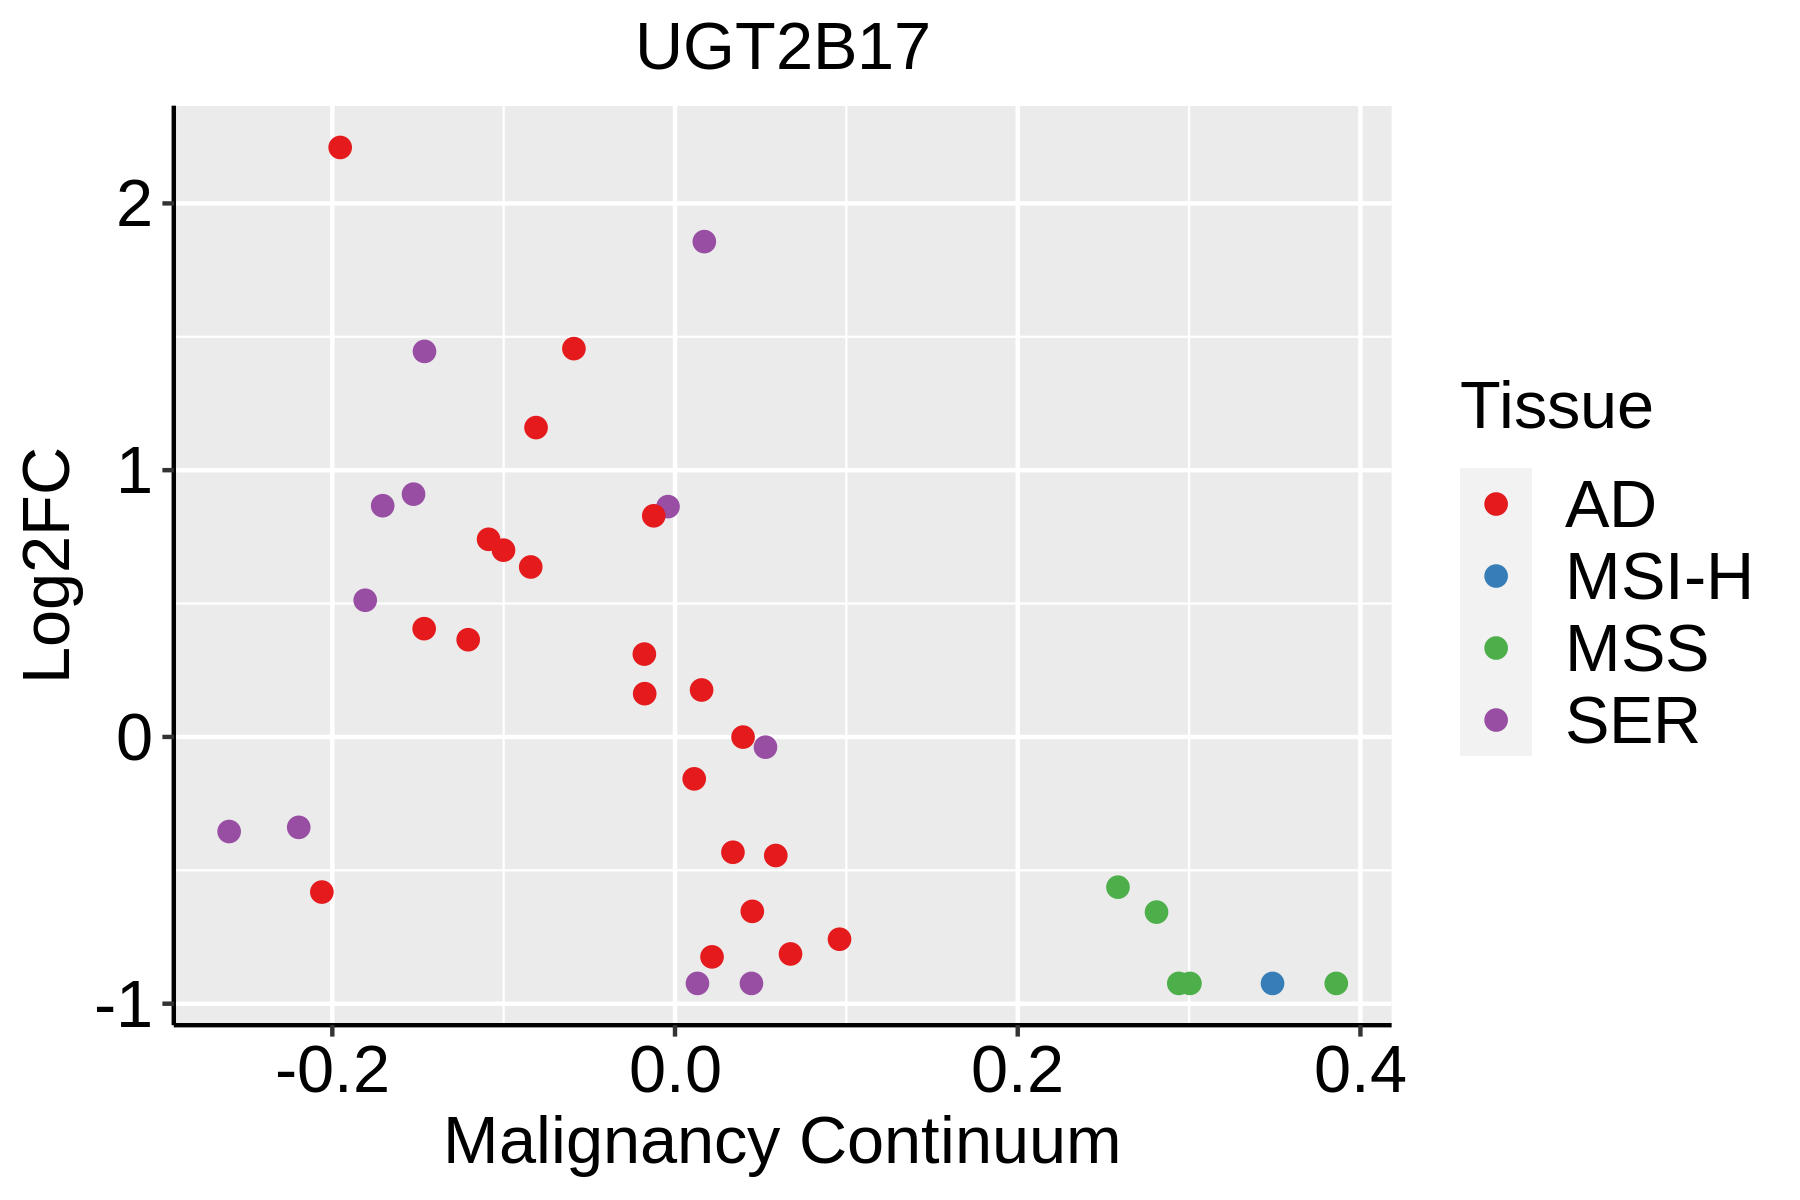 | AD: Adenomas |
| SER: Sessile serrated lesions | ||
| MSI-H: Microsatellite-high colorectal cancer | ||
| MSS: Microsatellite stable colorectal cancer |
| ∗log2FC in expression of this searched gene in stem-like cells from each diseased tissue sample relative to stem-like cells in normal samples in each tissue plotted against the malignancy continuum. Samples are colored based on if they are from different disease stage. |
Top |
Malignant transformation related pathway analysis |
| Find out the enriched GO biological processes and KEGG pathways involved in transition from healthy to precancer to cancer |
| Tissue | Disease Stage | Enriched GO biological Processes |
| Colorectum | AD |  |
| Colorectum | SER |  |
| Colorectum | MSS |  |
| Colorectum | MSI-H |  |
| Colorectum | FAP |  |
| ∗Top 15 enriched GO BP terms are showed in the bar plot of each disease state in each tissue. Each row represents a significant GO biological process which is colored according to the -log10(p.adjust). |
| Page: 1 2 3 4 5 6 7 8 9 |
| GO ID | Tissue | Disease Stage | Description | Gene Ratio | Bg Ratio | pvalue | p.adjust | Count |
| GO:0008202 | Colorectum | AD | steroid metabolic process | 85/3918 | 319/18723 | 8.07e-03 | 4.75e-02 | 85 |
| Page: 1 |
| Pathway ID | Tissue | Disease Stage | Description | Gene Ratio | Bg Ratio | pvalue | p.adjust | qvalue | Count |
| hsa04976 | Colorectum | FAP | Bile secretion | 24/1404 | 89/8465 | 8.76e-03 | 3.21e-02 | 1.96e-02 | 24 |
| hsa049761 | Colorectum | FAP | Bile secretion | 24/1404 | 89/8465 | 8.76e-03 | 3.21e-02 | 1.96e-02 | 24 |
| hsa05207 | Colorectum | CRC | Chemical carcinogenesis - receptor activation | 42/1091 | 212/8465 | 2.62e-03 | 1.75e-02 | 1.19e-02 | 42 |
| hsa052071 | Colorectum | CRC | Chemical carcinogenesis - receptor activation | 42/1091 | 212/8465 | 2.62e-03 | 1.75e-02 | 1.19e-02 | 42 |
| Page: 1 |
Top |
Cell-cell communication analysis |
| Identification of potential cell-cell interactions between two cell types and their ligand-receptor pairs for different disease states |
| Ligand | Receptor | LRpair | Pathway | Tissue | Disease Stage |
| Page: 1 |
Top |
Single-cell gene regulatory network inference analysis |
| Find out the significant the regulons (TFs) and the target genes of each regulon across cell types for different disease states |
| TF | Cell Type | Tissue | Disease Stage | Target Gene | RSS | Regulon Activity |
| ∗The dot plots of a searched regulon are shown for all cell subpopulations in each disease state of each tissue based on the regulon specific score inferred using pySCENIC and by calculating the average expression. |
| Page: 1 |
Top |
Somatic mutation of malignant transformation related genes |
| Annotation of somatic variants for genes involved in malignant transformation |
| Hugo Symbol | Variant Class | Variant Classification | dbSNP RS | HGVSc | HGVSp | HGVSp Short | SWISSPROT | BIOTYPE | SIFT | PolyPhen | Tumor Sample Barcode | Tissue | Histology | Sex | Age | Stage | Therapy Types | Drugs | Outcome |
| UGT2B17 | SNV | Missense_Mutation | c.1057C>G | p.Arg353Gly | p.R353G | O75795 | protein_coding | deleterious(0) | probably_damaging(0.974) | TCGA-D8-A1JA-01 | Breast | breast invasive carcinoma | Female | <65 | III/IV | Chemotherapy | adriamycin | PD | |
| UGT2B17 | SNV | Missense_Mutation | novel | c.693G>C | p.Lys231Asn | p.K231N | O75795 | protein_coding | deleterious(0.04) | benign(0.115) | TCGA-C5-A1MP-01 | Cervix | cervical & endocervical cancer | Female | <65 | I/II | Unknown | Unknown | SD |
| UGT2B17 | SNV | Missense_Mutation | novel | c.1375G>A | p.Asp459Asn | p.D459N | O75795 | protein_coding | deleterious(0.01) | probably_damaging(0.94) | TCGA-C5-A8YQ-01 | Cervix | cervical & endocervical cancer | Female | >=65 | I/II | Chemotherapy | cisplatin | PD |
| UGT2B17 | SNV | Missense_Mutation | rs773586559 | c.889G>A | p.Val297Met | p.V297M | O75795 | protein_coding | deleterious(0) | probably_damaging(0.991) | TCGA-EA-A3QD-01 | Cervix | cervical & endocervical cancer | Female | <65 | III/IV | Chemotherapy | cisplatin | CR |
| UGT2B17 | SNV | Missense_Mutation | c.433N>G | p.Lys145Glu | p.K145E | O75795 | protein_coding | tolerated(0.05) | benign(0.233) | TCGA-EK-A2PL-01 | Cervix | cervical & endocervical cancer | Female | <65 | III/IV | Unknown | Unknown | SD | |
| UGT2B17 | SNV | Missense_Mutation | c.355N>A | p.Glu119Lys | p.E119K | O75795 | protein_coding | tolerated(0.54) | benign(0.027) | TCGA-AA-3977-01 | Colorectum | colon adenocarcinoma | Male | >=65 | I/II | Unknown | Unknown | SD | |
| UGT2B17 | SNV | Missense_Mutation | c.1277N>C | p.Leu426Ser | p.L426S | O75795 | protein_coding | deleterious(0) | probably_damaging(0.998) | TCGA-AA-A010-01 | Colorectum | colon adenocarcinoma | Female | <65 | I/II | Chemotherapy | folinic | CR | |
| UGT2B17 | SNV | Missense_Mutation | rs764242431 | c.1343N>T | p.Arg448Ile | p.R448I | O75795 | protein_coding | deleterious(0.02) | benign(0.149) | TCGA-CA-6717-01 | Colorectum | colon adenocarcinoma | Male | <65 | I/II | Chemotherapy | oxaliplatin | CR |
| UGT2B17 | SNV | Missense_Mutation | novel | c.116N>C | p.Met39Thr | p.M39T | O75795 | protein_coding | deleterious(0.02) | possibly_damaging(0.809) | TCGA-D5-5540-01 | Colorectum | colon adenocarcinoma | Male | >=65 | I/II | Unknown | Unknown | SD |
| UGT2B17 | SNV | Missense_Mutation | novel | c.731C>G | p.Pro244Arg | p.P244R | O75795 | protein_coding | deleterious(0.01) | possibly_damaging(0.506) | TCGA-F4-6704-01 | Colorectum | colon adenocarcinoma | Male | <65 | III/IV | Unknown | Unknown | SD |
| Page: 1 2 3 4 5 6 7 |
Top |
Related drugs of malignant transformation related genes |
| Identification of chemicals and drugs interact with genes involved in malignant transfromation |
| (DGIdb 4.0) |
| Entrez ID | Symbol | Category | Interaction Types | Drug Claim Name | Drug Name | PMIDs |
| 7367 | UGT2B17 | ENZYME, DRUGGABLE GENOME | ibuprofen | IBUPROFEN | 25502615 |
| Page: 1 |

Copyright 2023-Present -The University of Texas Health Science Center at Houston |