
|
|||||
|
 | |
| |
| |
| |
| |
| |
|
Gene: UGT2B15 |
Gene summary for UGT2B15 |
| Gene information | Species | Human | Gene symbol | UGT2B15 | Gene ID | 7366 |
| Gene name | UDP glucuronosyltransferase family 2 member B15 | |
| Gene Alias | HLUG4 | |
| Cytomap | 4q13.2 | |
| Gene Type | protein-coding | GO ID | GO:0006063 | UniProtAcc | P54855 |
Top |
Malignant transformation analysis |
| Identification of the aberrant gene expression in precancerous and cancerous lesions by comparing the gene expression of stem-like cells in diseased tissues with normal stem cells |
| Entrez ID | Symbol | Replicates | Species | Organ | Tissue | Adj P-value | Log2FC | Malignancy |
| 7366 | UGT2B15 | HTA11_347_2000001011 | Human | Colorectum | AD | 5.63e-05 | 1.09e-01 | -0.1954 |
| 7366 | UGT2B15 | HTA11_7696_3000711011 | Human | Colorectum | AD | 3.71e-41 | 1.01e+00 | 0.0674 |
| 7366 | UGT2B15 | S42 | Human | Liver | HCC | 4.43e-02 | -7.94e-01 | -0.0103 |
| 7366 | UGT2B15 | S43 | Human | Liver | Cirrhotic | 2.89e-17 | -3.13e-01 | -0.0187 |
| 7366 | UGT2B15 | HCC1_Meng | Human | Liver | HCC | 3.69e-52 | -5.50e-01 | 0.0246 |
| 7366 | UGT2B15 | HCC2_Meng | Human | Liver | HCC | 7.61e-23 | -7.09e-01 | 0.0107 |
| 7366 | UGT2B15 | cirrhotic1 | Human | Liver | Cirrhotic | 1.74e-05 | 4.13e-02 | 0.0202 |
| 7366 | UGT2B15 | cirrhotic3 | Human | Liver | Cirrhotic | 3.11e-06 | -4.00e-01 | 0.0215 |
| 7366 | UGT2B15 | p6 | Human | Liver | Cyst | 1.10e-04 | -7.94e-01 | -0.0218 |
| 7366 | UGT2B15 | HCC2 | Human | Liver | HCC | 3.20e-07 | 3.67e+00 | 0.5341 |
| 7366 | UGT2B15 | HCC5 | Human | Liver | HCC | 1.03e-05 | 4.62e-01 | 0.4932 |
| 7366 | UGT2B15 | Pt13.a | Human | Liver | HCC | 6.26e-04 | -2.25e-01 | 0.021 |
| 7366 | UGT2B15 | Pt13.b | Human | Liver | HCC | 2.14e-12 | -7.77e-02 | 0.0251 |
| 7366 | UGT2B15 | Pt13.c | Human | Liver | HCC | 7.66e-04 | -5.67e-01 | 0.0076 |
| 7366 | UGT2B15 | S014 | Human | Liver | HCC | 1.56e-19 | -7.94e-01 | 0.2254 |
| 7366 | UGT2B15 | S015 | Human | Liver | HCC | 6.40e-14 | -7.94e-01 | 0.2375 |
| 7366 | UGT2B15 | S016 | Human | Liver | HCC | 2.73e-24 | -7.94e-01 | 0.2243 |
| 7366 | UGT2B15 | S027 | Human | Liver | HCC | 1.98e-16 | 2.74e+00 | 0.2446 |
| 7366 | UGT2B15 | S028 | Human | Liver | HCC | 1.13e-31 | 2.93e+00 | 0.2503 |
| 7366 | UGT2B15 | S029 | Human | Liver | HCC | 1.46e-33 | 3.05e+00 | 0.2581 |
| Page: 1 |
| Tissue | Expression Dynamics | Abbreviation |
| Colorectum (GSE201348) |  | FAP: Familial adenomatous polyposis |
| CRC: Colorectal cancer | ||
| Colorectum (HTA11) |  | AD: Adenomas |
| SER: Sessile serrated lesions | ||
| MSI-H: Microsatellite-high colorectal cancer | ||
| MSS: Microsatellite stable colorectal cancer | ||
| Liver | 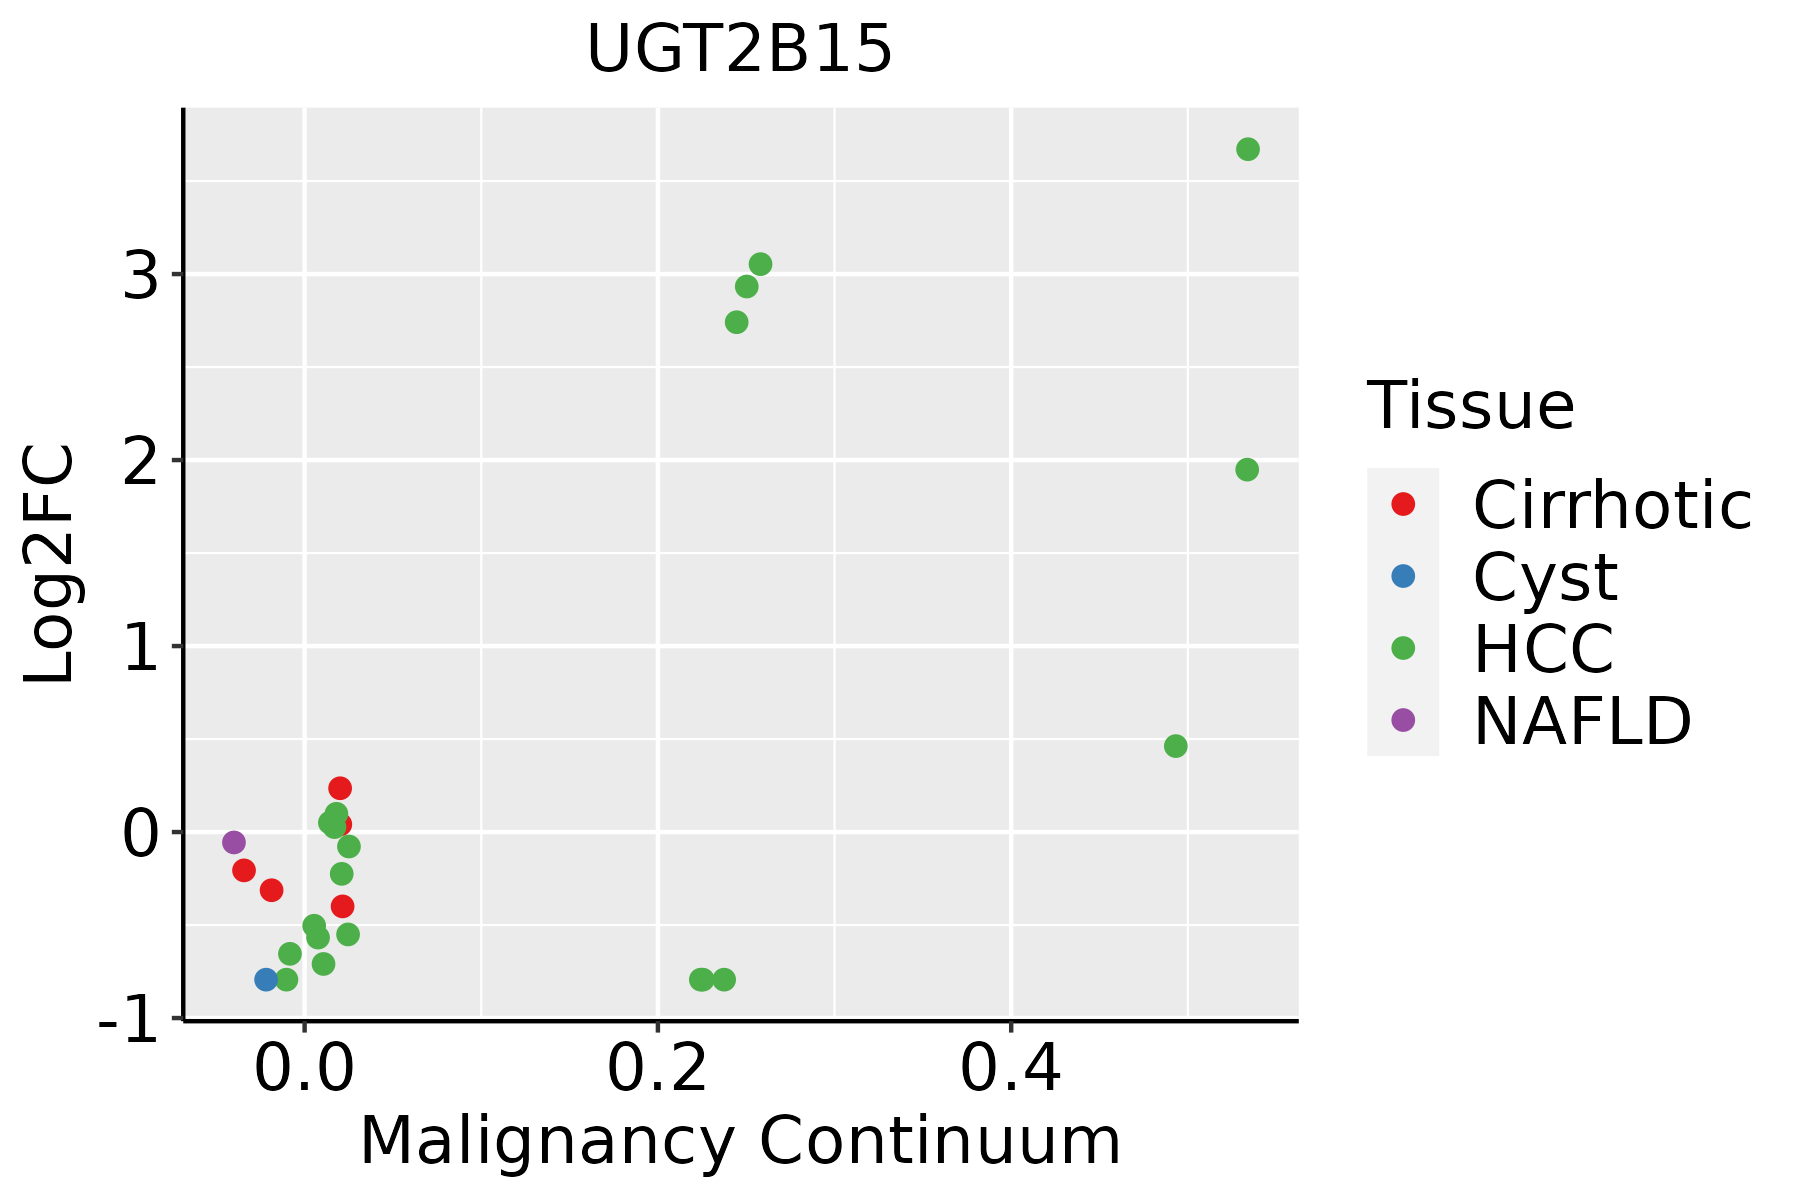 | HCC: Hepatocellular carcinoma |
| NAFLD: Non-alcoholic fatty liver disease |
| ∗log2FC in expression of this searched gene in stem-like cells from each diseased tissue sample relative to stem-like cells in normal samples in each tissue plotted against the malignancy continuum. Samples are colored based on if they are from different disease stage. |
Top |
Malignant transformation related pathway analysis |
| Find out the enriched GO biological processes and KEGG pathways involved in transition from healthy to precancer to cancer |
| Tissue | Disease Stage | Enriched GO biological Processes |
| Colorectum | AD |  |
| Colorectum | SER |  |
| Colorectum | MSS |  |
| Colorectum | MSI-H |  |
| Colorectum | FAP |  |
| ∗Top 15 enriched GO BP terms are showed in the bar plot of each disease state in each tissue. Each row represents a significant GO biological process which is colored according to the -log10(p.adjust). |
| Page: 1 2 3 4 5 6 7 8 9 |
| GO ID | Tissue | Disease Stage | Description | Gene Ratio | Bg Ratio | pvalue | p.adjust | Count |
| GO:0009410 | Colorectum | AD | response to xenobiotic stimulus | 128/3918 | 462/18723 | 2.69e-04 | 3.31e-03 | 128 |
| GO:0008202 | Colorectum | AD | steroid metabolic process | 85/3918 | 319/18723 | 8.07e-03 | 4.75e-02 | 85 |
| GO:000820211 | Liver | Cirrhotic | steroid metabolic process | 143/4634 | 319/18723 | 2.79e-15 | 3.18e-13 | 143 |
| GO:000941012 | Liver | Cirrhotic | response to xenobiotic stimulus | 165/4634 | 462/18723 | 6.82e-08 | 2.09e-06 | 165 |
| GO:00714661 | Liver | Cirrhotic | cellular response to xenobiotic stimulus | 66/4634 | 177/18723 | 1.34e-04 | 1.31e-03 | 66 |
| GO:000680511 | Liver | Cirrhotic | xenobiotic metabolic process | 43/4634 | 111/18723 | 7.51e-04 | 5.54e-03 | 43 |
| GO:00082101 | Liver | Cirrhotic | estrogen metabolic process | 18/4634 | 38/18723 | 2.05e-03 | 1.27e-02 | 18 |
| GO:004244511 | Liver | Cirrhotic | hormone metabolic process | 73/4634 | 218/18723 | 2.22e-03 | 1.36e-02 | 73 |
| GO:00082022 | Liver | HCC | steroid metabolic process | 188/7958 | 319/18723 | 1.96e-09 | 5.63e-08 | 188 |
| GO:000941022 | Liver | HCC | response to xenobiotic stimulus | 248/7958 | 462/18723 | 6.47e-07 | 1.02e-05 | 248 |
| GO:00714662 | Liver | HCC | cellular response to xenobiotic stimulus | 93/7958 | 177/18723 | 4.35e-03 | 1.89e-02 | 93 |
| Page: 1 |
| Pathway ID | Tissue | Disease Stage | Description | Gene Ratio | Bg Ratio | pvalue | p.adjust | qvalue | Count |
| hsa01240 | Liver | Cirrhotic | Biosynthesis of cofactors | 66/2530 | 153/8465 | 3.11e-04 | 1.99e-03 | 1.23e-03 | 66 |
| hsa00983 | Liver | Cirrhotic | Drug metabolism - other enzymes | 34/2530 | 80/8465 | 1.08e-02 | 3.57e-02 | 2.20e-02 | 34 |
| hsa012401 | Liver | Cirrhotic | Biosynthesis of cofactors | 66/2530 | 153/8465 | 3.11e-04 | 1.99e-03 | 1.23e-03 | 66 |
| hsa009831 | Liver | Cirrhotic | Drug metabolism - other enzymes | 34/2530 | 80/8465 | 1.08e-02 | 3.57e-02 | 2.20e-02 | 34 |
| hsa012402 | Liver | HCC | Biosynthesis of cofactors | 103/4020 | 153/8465 | 4.67e-07 | 5.05e-06 | 2.81e-06 | 103 |
| hsa009832 | Liver | HCC | Drug metabolism - other enzymes | 54/4020 | 80/8465 | 2.25e-04 | 1.09e-03 | 6.08e-04 | 54 |
| hsa012403 | Liver | HCC | Biosynthesis of cofactors | 103/4020 | 153/8465 | 4.67e-07 | 5.05e-06 | 2.81e-06 | 103 |
| hsa009833 | Liver | HCC | Drug metabolism - other enzymes | 54/4020 | 80/8465 | 2.25e-04 | 1.09e-03 | 6.08e-04 | 54 |
| Page: 1 |
Top |
Cell-cell communication analysis |
| Identification of potential cell-cell interactions between two cell types and their ligand-receptor pairs for different disease states |
| Ligand | Receptor | LRpair | Pathway | Tissue | Disease Stage |
| Page: 1 |
Top |
Single-cell gene regulatory network inference analysis |
| Find out the significant the regulons (TFs) and the target genes of each regulon across cell types for different disease states |
| TF | Cell Type | Tissue | Disease Stage | Target Gene | RSS | Regulon Activity |
| ∗The dot plots of a searched regulon are shown for all cell subpopulations in each disease state of each tissue based on the regulon specific score inferred using pySCENIC and by calculating the average expression. |
| Page: 1 |
Top |
Somatic mutation of malignant transformation related genes |
| Annotation of somatic variants for genes involved in malignant transformation |
| Hugo Symbol | Variant Class | Variant Classification | dbSNP RS | HGVSc | HGVSp | HGVSp Short | SWISSPROT | BIOTYPE | SIFT | PolyPhen | Tumor Sample Barcode | Tissue | Histology | Sex | Age | Stage | Therapy Types | Drugs | Outcome |
| UGT2B15 | SNV | Missense_Mutation | c.1274A>G | p.Asp425Gly | p.D425G | P54855 | protein_coding | deleterious(0) | possibly_damaging(0.627) | TCGA-A2-A0T0-01 | Breast | breast invasive carcinoma | Female | <65 | I/II | Chemotherapy | taxotere | SD | |
| UGT2B15 | SNV | Missense_Mutation | novel | c.1290G>T | p.Leu430Phe | p.L430F | P54855 | protein_coding | deleterious(0) | probably_damaging(0.991) | TCGA-AN-A046-01 | Breast | breast invasive carcinoma | Female | >=65 | I/II | Unknown | Unknown | SD |
| UGT2B15 | SNV | Missense_Mutation | c.127N>A | p.Leu43Met | p.L43M | P54855 | protein_coding | deleterious(0.01) | possibly_damaging(0.803) | TCGA-BH-A18P-01 | Breast | breast invasive carcinoma | Female | <65 | I/II | Unknown | Unknown | PD | |
| UGT2B15 | insertion | In_Frame_Ins | novel | c.415_416insATT | p.Met139delinsAsnLeu | p.M139delinsNL | P54855 | protein_coding | TCGA-AC-A3QQ-01 | Breast | breast invasive carcinoma | Female | <65 | I/II | Unknown | Unknown | SD | ||
| UGT2B15 | SNV | Missense_Mutation | novel | c.874G>A | p.Glu292Lys | p.E292K | P54855 | protein_coding | deleterious(0.01) | possibly_damaging(0.904) | TCGA-2W-A8YY-01 | Cervix | cervical & endocervical cancer | Female | <65 | I/II | Chemotherapy | cisplatin | CR |
| UGT2B15 | SNV | Missense_Mutation | rs377015117 | c.521G>A | p.Arg174Gln | p.R174Q | P54855 | protein_coding | deleterious(0.01) | possibly_damaging(0.529) | TCGA-2W-A8YY-01 | Cervix | cervical & endocervical cancer | Female | <65 | I/II | Chemotherapy | cisplatin | CR |
| UGT2B15 | SNV | Missense_Mutation | c.601N>C | p.Glu201Gln | p.E201Q | P54855 | protein_coding | tolerated(0.18) | benign(0.309) | TCGA-C5-A1BQ-01 | Cervix | cervical & endocervical cancer | Female | >=65 | III/IV | Chemotherapy | cisplatin | CR | |
| UGT2B15 | SNV | Missense_Mutation | rs148054959 | c.1379G>A | p.Arg460Gln | p.R460Q | P54855 | protein_coding | tolerated(0.06) | benign(0.177) | TCGA-C5-A1M6-01 | Cervix | cervical & endocervical cancer | Female | <65 | I/II | Chemotherapy | cisplatin | PD |
| UGT2B15 | SNV | Missense_Mutation | c.928C>G | p.Leu310Val | p.L310V | P54855 | protein_coding | deleterious(0) | possibly_damaging(0.592) | TCGA-DR-A0ZM-01 | Cervix | cervical & endocervical cancer | Female | <65 | III/IV | Unspecific | Cisplatin | SD | |
| UGT2B15 | SNV | Missense_Mutation | c.1204G>A | p.Asp402Asn | p.D402N | P54855 | protein_coding | deleterious(0.02) | probably_damaging(0.977) | TCGA-EA-A3HT-01 | Cervix | cervical & endocervical cancer | Female | >=65 | I/II | Unknown | Unknown | SD |
| Page: 1 2 3 4 5 6 7 8 9 |
Top |
Related drugs of malignant transformation related genes |
| Identification of chemicals and drugs interact with genes involved in malignant transfromation |
| (DGIdb 4.0) |
| Entrez ID | Symbol | Category | Interaction Types | Drug Claim Name | Drug Name | PMIDs |
| 7366 | UGT2B15 | DRUGGABLE GENOME | phenobarbital | PHENOBARBITAL | 26049587 | |
| 7366 | UGT2B15 | DRUGGABLE GENOME | lorazepam | LORAZEPAM | 15961980 | |
| 7366 | UGT2B15 | DRUGGABLE GENOME | sipoglitazar | SIPOGLITAZAR | 22960998,23444281 | |
| 7366 | UGT2B15 | DRUGGABLE GENOME | phenytoin | PHENYTOIN | 26049587 | |
| 7366 | UGT2B15 | DRUGGABLE GENOME | oxazepam | OXAZEPAM | 15044558,29737521 | |
| 7366 | UGT2B15 | DRUGGABLE GENOME | acetaminophen | ACETAMINOPHEN | 30908574,26049587,16696573 |
| Page: 1 |

Copyright 2023-Present -The University of Texas Health Science Center at Houston |