
|
|||||
|
 | |
| |
| |
| |
| |
| |
|
Gene: UGT2B10 |
Gene summary for UGT2B10 |
| Gene information | Species | Human | Gene symbol | UGT2B10 | Gene ID | 7365 |
| Gene name | UDP glucuronosyltransferase family 2 member B10 | |
| Gene Alias | UDPGT2B10 | |
| Cytomap | 4q13.2 | |
| Gene Type | protein-coding | GO ID | GO:0006629 | UniProtAcc | P36537 |
Top |
Malignant transformation analysis |
| Identification of the aberrant gene expression in precancerous and cancerous lesions by comparing the gene expression of stem-like cells in diseased tissues with normal stem cells |
| Entrez ID | Symbol | Replicates | Species | Organ | Tissue | Adj P-value | Log2FC | Malignancy |
| 7365 | UGT2B10 | HCC1_Meng | Human | Liver | HCC | 1.52e-48 | 1.53e-01 | 0.0246 |
| 7365 | UGT2B10 | HCC2 | Human | Liver | HCC | 2.44e-36 | 3.82e+00 | 0.5341 |
| 7365 | UGT2B10 | S028 | Human | Liver | HCC | 1.97e-09 | 5.65e-01 | 0.2503 |
| 7365 | UGT2B10 | S029 | Human | Liver | HCC | 2.98e-23 | 1.10e+00 | 0.2581 |
| Page: 1 |
| Tissue | Expression Dynamics | Abbreviation |
| Liver | 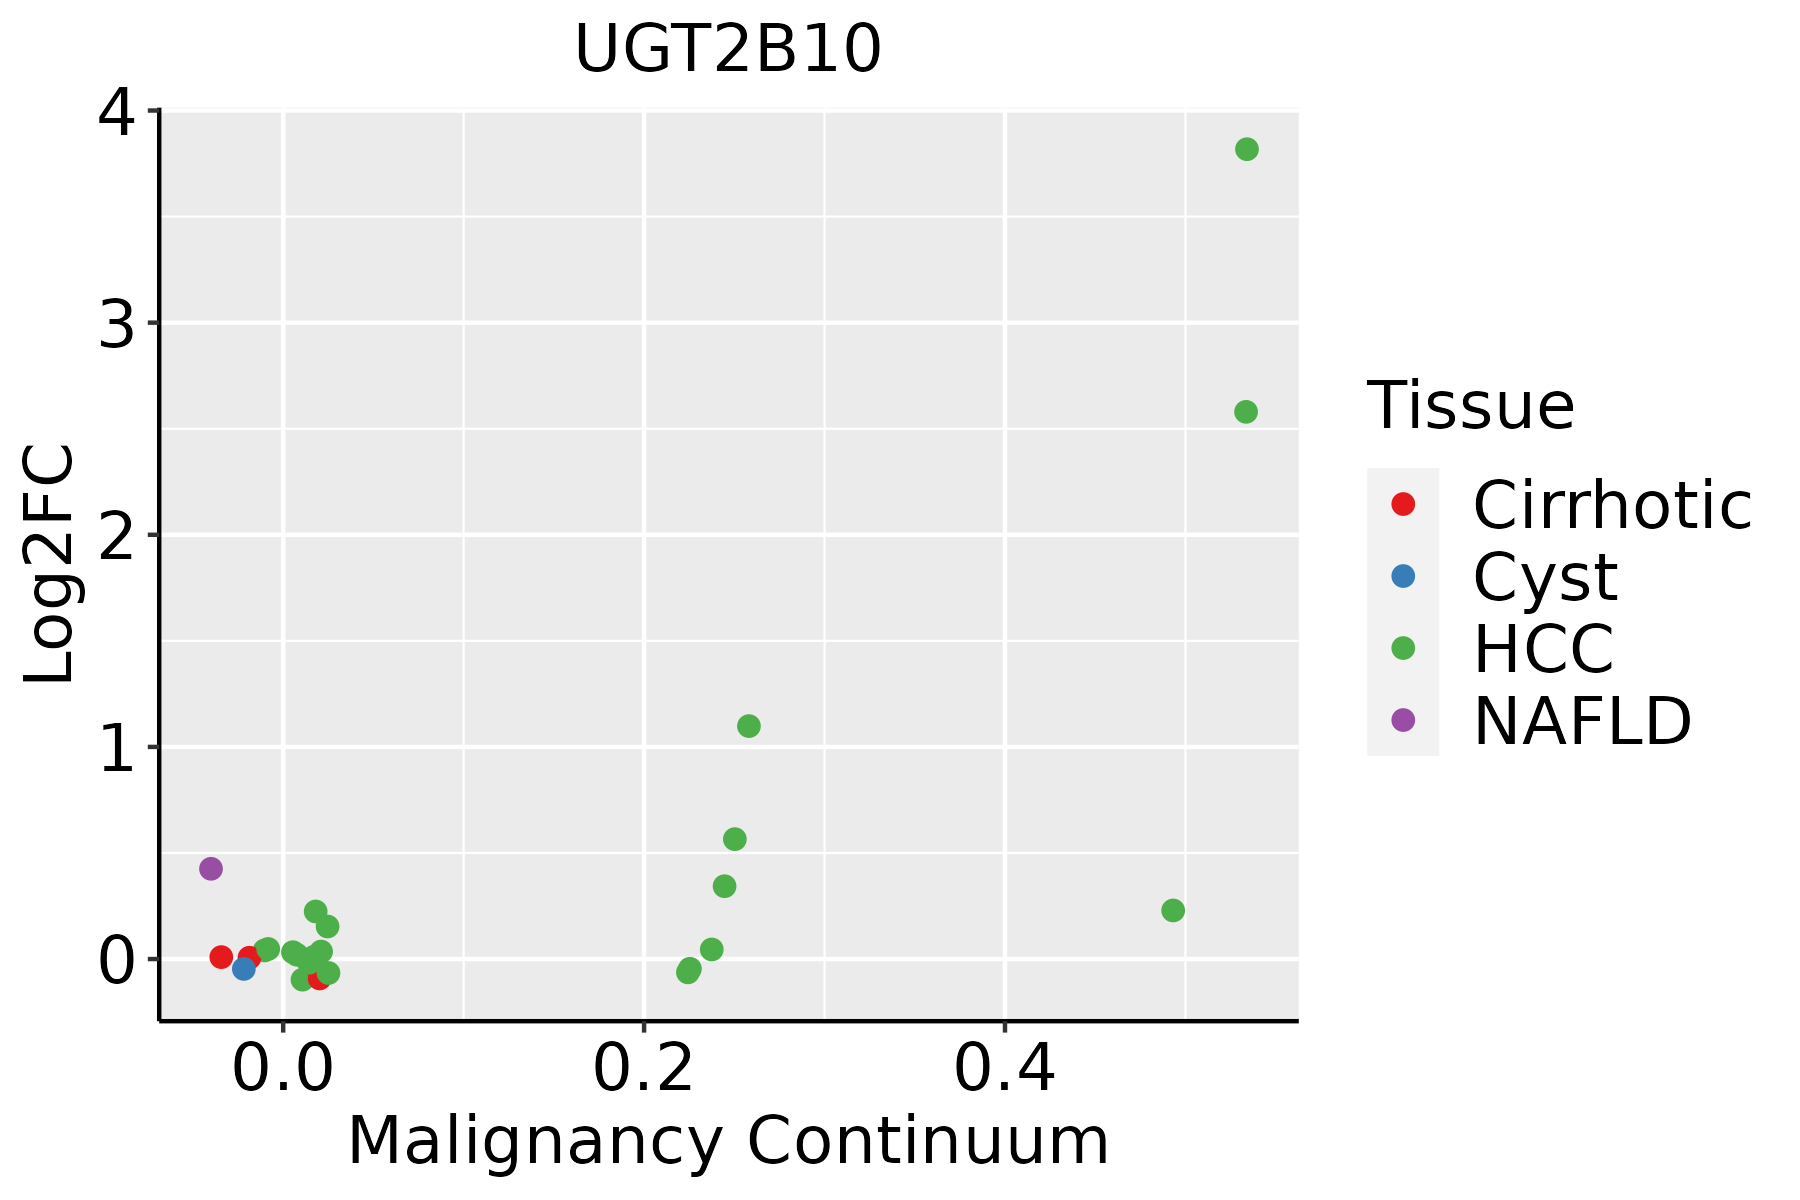 | HCC: Hepatocellular carcinoma |
| NAFLD: Non-alcoholic fatty liver disease |
| ∗log2FC in expression of this searched gene in stem-like cells from each diseased tissue sample relative to stem-like cells in normal samples in each tissue plotted against the malignancy continuum. Samples are colored based on if they are from different disease stage. |
Top |
Malignant transformation related pathway analysis |
| Find out the enriched GO biological processes and KEGG pathways involved in transition from healthy to precancer to cancer |
| Tissue | Disease Stage | Enriched GO biological Processes |
| Colorectum | AD |  |
| Colorectum | SER |  |
| Colorectum | MSS |  |
| Colorectum | MSI-H |  |
| Colorectum | FAP |  |
| ∗Top 15 enriched GO BP terms are showed in the bar plot of each disease state in each tissue. Each row represents a significant GO biological process which is colored according to the -log10(p.adjust). |
| Page: 1 2 3 4 5 6 7 8 9 |
| GO ID | Tissue | Disease Stage | Description | Gene Ratio | Bg Ratio | pvalue | p.adjust | Count |
| Page: 1 |
| Pathway ID | Tissue | Disease Stage | Description | Gene Ratio | Bg Ratio | pvalue | p.adjust | qvalue | Count |
| hsa012402 | Liver | HCC | Biosynthesis of cofactors | 103/4020 | 153/8465 | 4.67e-07 | 5.05e-06 | 2.81e-06 | 103 |
| hsa009832 | Liver | HCC | Drug metabolism - other enzymes | 54/4020 | 80/8465 | 2.25e-04 | 1.09e-03 | 6.08e-04 | 54 |
| hsa012403 | Liver | HCC | Biosynthesis of cofactors | 103/4020 | 153/8465 | 4.67e-07 | 5.05e-06 | 2.81e-06 | 103 |
| hsa009833 | Liver | HCC | Drug metabolism - other enzymes | 54/4020 | 80/8465 | 2.25e-04 | 1.09e-03 | 6.08e-04 | 54 |
| Page: 1 |
Top |
Cell-cell communication analysis |
| Identification of potential cell-cell interactions between two cell types and their ligand-receptor pairs for different disease states |
| Ligand | Receptor | LRpair | Pathway | Tissue | Disease Stage |
| Page: 1 |
Top |
Single-cell gene regulatory network inference analysis |
| Find out the significant the regulons (TFs) and the target genes of each regulon across cell types for different disease states |
| TF | Cell Type | Tissue | Disease Stage | Target Gene | RSS | Regulon Activity |
| ∗The dot plots of a searched regulon are shown for all cell subpopulations in each disease state of each tissue based on the regulon specific score inferred using pySCENIC and by calculating the average expression. |
| Page: 1 |
Top |
Somatic mutation of malignant transformation related genes |
| Annotation of somatic variants for genes involved in malignant transformation |
| Hugo Symbol | Variant Class | Variant Classification | dbSNP RS | HGVSc | HGVSp | HGVSp Short | SWISSPROT | BIOTYPE | SIFT | PolyPhen | Tumor Sample Barcode | Tissue | Histology | Sex | Age | Stage | Therapy Types | Drugs | Outcome |
| UGT2B10 | SNV | Missense_Mutation | c.1337G>A | p.Arg446Lys | p.R446K | P36537 | protein_coding | tolerated(0.19) | benign(0.013) | TCGA-A8-A09A-01 | Breast | breast invasive carcinoma | Female | <65 | I/II | Hormone Therapy | tamoxiphen | SD | |
| UGT2B10 | SNV | Missense_Mutation | c.739N>C | p.Glu247Gln | p.E247Q | P36537 | protein_coding | deleterious(0.03) | possibly_damaging(0.483) | TCGA-AC-A23H-01 | Breast | breast invasive carcinoma | Female | >=65 | I/II | Unknown | Unknown | PD | |
| UGT2B10 | SNV | Missense_Mutation | novel | c.1003C>A | p.Leu335Ile | p.L335I | P36537 | protein_coding | tolerated(0.18) | benign(0.21) | TCGA-AN-A046-01 | Breast | breast invasive carcinoma | Female | >=65 | I/II | Unknown | Unknown | SD |
| UGT2B10 | SNV | Missense_Mutation | c.384N>A | p.Asp128Glu | p.D128E | P36537 | protein_coding | tolerated(0.4) | benign(0.02) | TCGA-BH-A18V-01 | Breast | breast invasive carcinoma | Female | <65 | I/II | Unknown | Unknown | SD | |
| UGT2B10 | SNV | Missense_Mutation | c.1350N>A | p.Asp450Glu | p.D450E | P36537 | protein_coding | deleterious(0.02) | benign(0.307) | TCGA-D8-A13Y-01 | Breast | breast invasive carcinoma | Female | <65 | I/II | Chemotherapy | doxorubicin | SD | |
| UGT2B10 | SNV | Missense_Mutation | c.190G>C | p.Asp64His | p.D64H | P36537 | protein_coding | deleterious(0) | benign(0.385) | TCGA-E2-A152-01 | Breast | breast invasive carcinoma | Female | <65 | I/II | Targeted Molecular therapy | trastuzumab | PD | |
| UGT2B10 | SNV | Missense_Mutation | novel | c.10A>C | p.Lys4Gln | p.K4Q | P36537 | protein_coding | deleterious(0.04) | benign(0.248) | TCGA-2W-A8YY-01 | Cervix | cervical & endocervical cancer | Female | <65 | I/II | Chemotherapy | cisplatin | CR |
| UGT2B10 | SNV | Missense_Mutation | c.1063N>C | p.Trp355Arg | p.W355R | P36537 | protein_coding | deleterious(0) | probably_damaging(0.998) | TCGA-C5-A7UE-01 | Cervix | cervical & endocervical cancer | Female | <65 | I/II | Chemotherapy | cisplatin | SD | |
| UGT2B10 | SNV | Missense_Mutation | c.1078N>A | p.Asp360Asn | p.D360N | P36537 | protein_coding | deleterious(0.01) | probably_damaging(0.997) | TCGA-FU-A770-01 | Cervix | cervical & endocervical cancer | Female | <65 | III/IV | Unknown | Unknown | SD | |
| UGT2B10 | SNV | Missense_Mutation | c.1054N>A | p.Leu352Met | p.L352M | P36537 | protein_coding | deleterious(0.03) | possibly_damaging(0.709) | TCGA-R2-A69V-01 | Cervix | cervical & endocervical cancer | Female | <65 | I/II | Chemotherapy | cisplatin | SD |
| Page: 1 2 3 4 5 6 7 8 9 10 |
Top |
Related drugs of malignant transformation related genes |
| Identification of chemicals and drugs interact with genes involved in malignant transfromation |
| (DGIdb 4.0) |
| Entrez ID | Symbol | Category | Interaction Types | Drug Claim Name | Drug Name | PMIDs |
| 7365 | UGT2B10 | DRUGGABLE GENOME | nicotine | NICOTINE | 18300939,17909004,24192532 | |
| 7365 | UGT2B10 | DRUGGABLE GENOME | cotinine | COTININE |
| Page: 1 |

Copyright 2023-Present -The University of Texas Health Science Center at Houston |