
|
|||||
|
 | |
| |
| |
| |
| |
| |
|
Gene: UGT1A9 |
Gene summary for UGT1A9 |
| Gene information | Species | Human | Gene symbol | UGT1A9 | Gene ID | 54600 |
| Gene name | UDP glucuronosyltransferase family 1 member A9 | |
| Gene Alias | HLUGP4 | |
| Cytomap | 2q37.1 | |
| Gene Type | protein-coding | GO ID | GO:0001523 | UniProtAcc | O60656 |
Top |
Malignant transformation analysis |
| Identification of the aberrant gene expression in precancerous and cancerous lesions by comparing the gene expression of stem-like cells in diseased tissues with normal stem cells |
| Entrez ID | Symbol | Replicates | Species | Organ | Tissue | Adj P-value | Log2FC | Malignancy |
| 54600 | UGT1A9 | S027 | Human | Liver | HCC | 2.61e-13 | 1.01e+00 | 0.2446 |
| 54600 | UGT1A9 | S028 | Human | Liver | HCC | 7.67e-31 | 9.56e-01 | 0.2503 |
| 54600 | UGT1A9 | S029 | Human | Liver | HCC | 3.10e-20 | 7.01e-01 | 0.2581 |
| Page: 1 |
| Tissue | Expression Dynamics | Abbreviation |
| Liver | 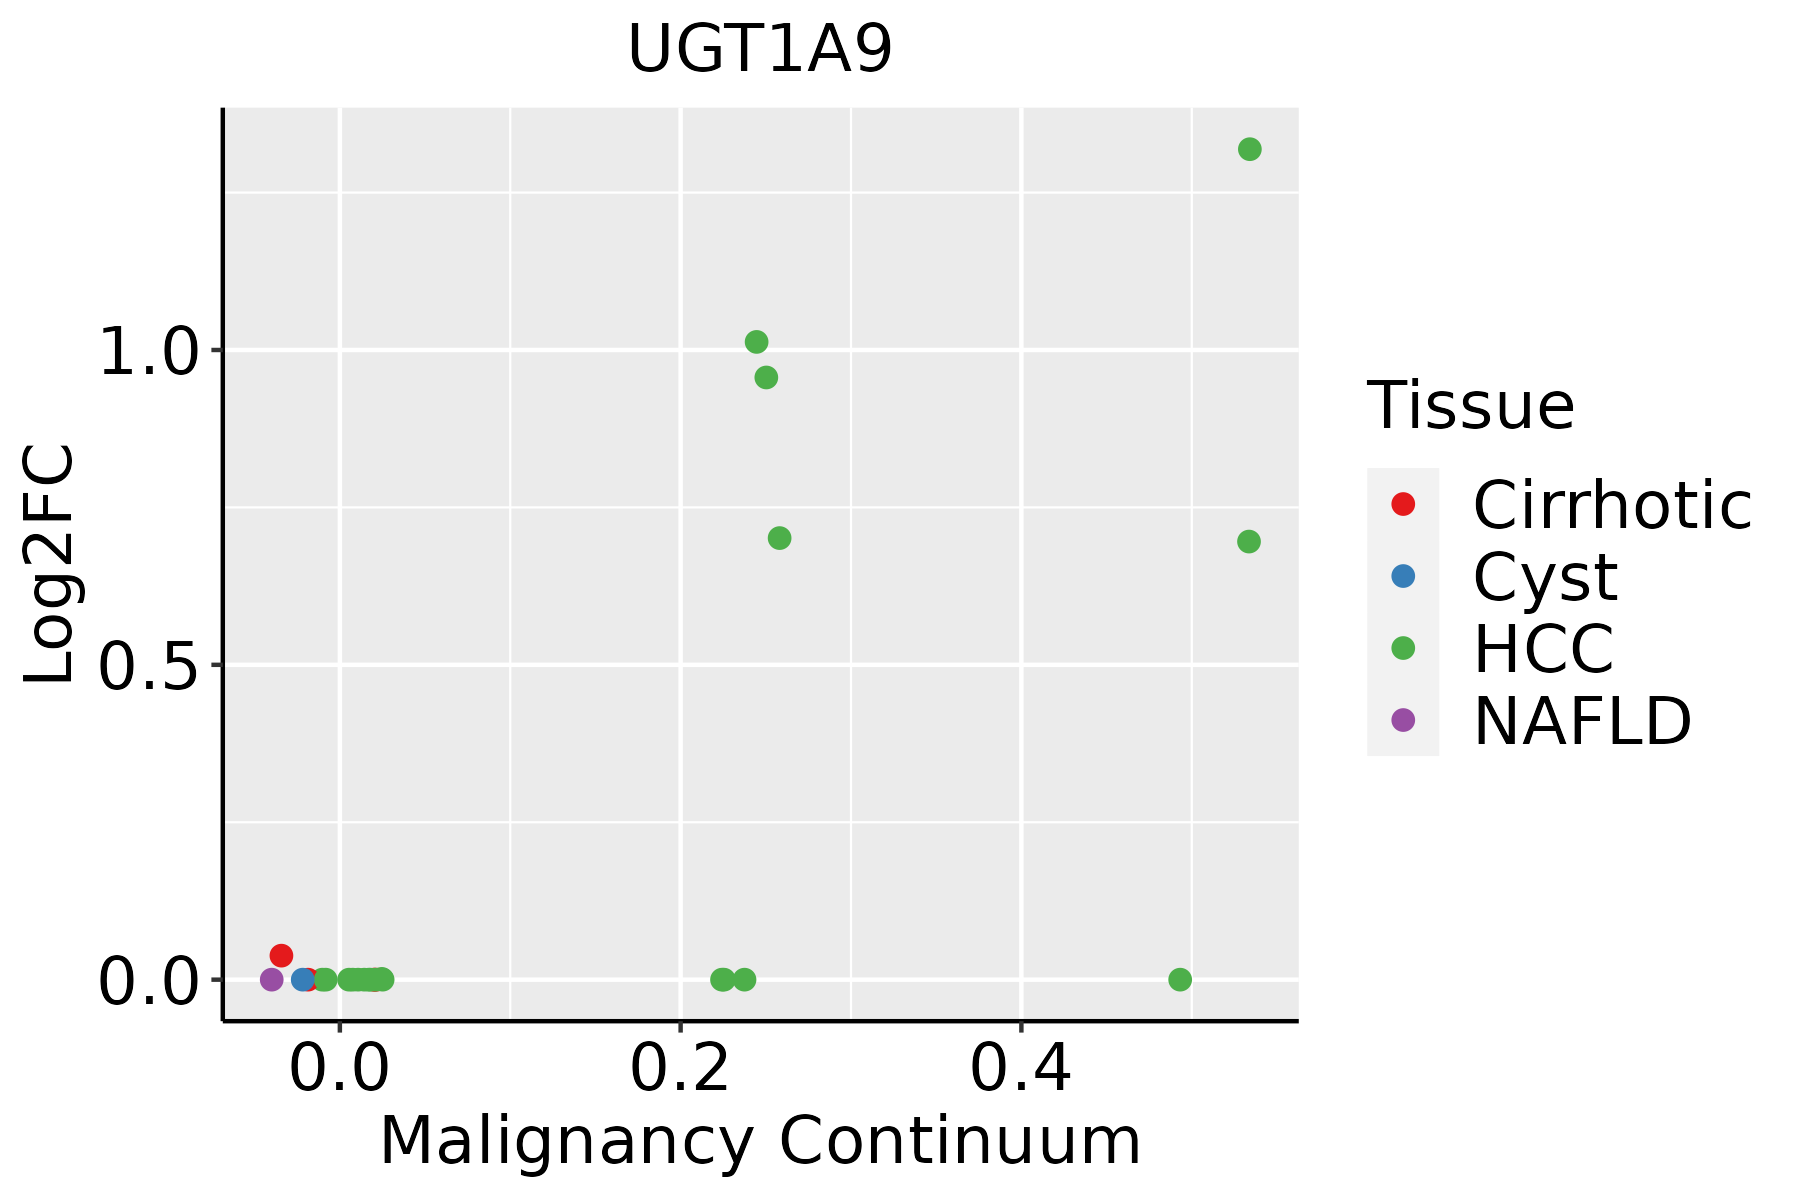 | HCC: Hepatocellular carcinoma |
| NAFLD: Non-alcoholic fatty liver disease |
| ∗log2FC in expression of this searched gene in stem-like cells from each diseased tissue sample relative to stem-like cells in normal samples in each tissue plotted against the malignancy continuum. Samples are colored based on if they are from different disease stage. |
Top |
Malignant transformation related pathway analysis |
| Find out the enriched GO biological processes and KEGG pathways involved in transition from healthy to precancer to cancer |
| Tissue | Disease Stage | Enriched GO biological Processes |
| Colorectum | AD |  |
| Colorectum | SER |  |
| Colorectum | MSS |  |
| Colorectum | MSI-H |  |
| Colorectum | FAP |  |
| ∗Top 15 enriched GO BP terms are showed in the bar plot of each disease state in each tissue. Each row represents a significant GO biological process which is colored according to the -log10(p.adjust). |
| Page: 1 2 3 4 5 6 7 8 9 |
| GO ID | Tissue | Disease Stage | Description | Gene Ratio | Bg Ratio | pvalue | p.adjust | Count |
| GO:000941022 | Liver | HCC | response to xenobiotic stimulus | 248/7958 | 462/18723 | 6.47e-07 | 1.02e-05 | 248 |
| GO:0042440 | Liver | HCC | pigment metabolic process | 51/7958 | 84/18723 | 5.74e-04 | 3.65e-03 | 51 |
| GO:000672011 | Liver | HCC | isoprenoid metabolic process | 65/7958 | 116/18723 | 2.23e-03 | 1.11e-02 | 65 |
| GO:00714662 | Liver | HCC | cellular response to xenobiotic stimulus | 93/7958 | 177/18723 | 4.35e-03 | 1.89e-02 | 93 |
| Page: 1 |
| Pathway ID | Tissue | Disease Stage | Description | Gene Ratio | Bg Ratio | pvalue | p.adjust | qvalue | Count |
| Page: 1 |
Top |
Cell-cell communication analysis |
| Identification of potential cell-cell interactions between two cell types and their ligand-receptor pairs for different disease states |
| Ligand | Receptor | LRpair | Pathway | Tissue | Disease Stage |
| Page: 1 |
Top |
Single-cell gene regulatory network inference analysis |
| Find out the significant the regulons (TFs) and the target genes of each regulon across cell types for different disease states |
| TF | Cell Type | Tissue | Disease Stage | Target Gene | RSS | Regulon Activity |
| ∗The dot plots of a searched regulon are shown for all cell subpopulations in each disease state of each tissue based on the regulon specific score inferred using pySCENIC and by calculating the average expression. |
| Page: 1 |
Top |
Somatic mutation of malignant transformation related genes |
| Annotation of somatic variants for genes involved in malignant transformation |
| Hugo Symbol | Variant Class | Variant Classification | dbSNP RS | HGVSc | HGVSp | HGVSp Short | SWISSPROT | BIOTYPE | SIFT | PolyPhen | Tumor Sample Barcode | Tissue | Histology | Sex | Age | Stage | Therapy Types | Drugs | Outcome |
| UGT1A9 | SNV | Missense_Mutation | c.319N>A | p.Ser107Thr | p.S107T | O60656 | protein_coding | tolerated(0.6) | benign(0.043) | TCGA-A2-A0SU-01 | Breast | breast invasive carcinoma | Female | >=65 | I/II | Hormone Therapy | arimidex | SD | |
| UGT1A9 | SNV | Missense_Mutation | novel | c.283N>G | p.His95Asp | p.H95D | O60656 | protein_coding | tolerated(1) | benign(0) | TCGA-AC-A8OP-01 | Breast | breast invasive carcinoma | Female | >=65 | I/II | Unknown | Unknown | SD |
| UGT1A9 | SNV | Missense_Mutation | novel | c.439C>T | p.Leu147Phe | p.L147F | O60656 | protein_coding | deleterious(0) | benign(0.159) | TCGA-C8-A3M7-01 | Breast | breast invasive carcinoma | Female | <65 | III/IV | Unknown | Unknown | PD |
| UGT1A9 | SNV | Missense_Mutation | novel | c.718A>G | p.Thr240Ala | p.T240A | O60656 | protein_coding | deleterious(0.02) | possibly_damaging(0.883) | TCGA-2W-A8YY-01 | Cervix | cervical & endocervical cancer | Female | <65 | I/II | Chemotherapy | cisplatin | CR |
| UGT1A9 | SNV | Missense_Mutation | c.73G>A | p.Ala25Thr | p.A25T | O60656 | protein_coding | tolerated(0.05) | possibly_damaging(0.883) | TCGA-AA-3510-01 | Colorectum | colon adenocarcinoma | Male | >=65 | I/II | Unknown | Unknown | SD | |
| UGT1A9 | SNV | Missense_Mutation | rs767982435 | c.442G>A | p.Asp148Asn | p.D148N | O60656 | protein_coding | deleterious(0.01) | possibly_damaging(0.844) | TCGA-AA-3977-01 | Colorectum | colon adenocarcinoma | Male | >=65 | I/II | Unknown | Unknown | SD |
| UGT1A9 | SNV | Missense_Mutation | rs555995846 | c.308N>A | p.Arg103Gln | p.R103Q | O60656 | protein_coding | tolerated(0.59) | benign(0) | TCGA-AA-A010-01 | Colorectum | colon adenocarcinoma | Female | <65 | I/II | Chemotherapy | folinic | CR |
| UGT1A9 | SNV | Missense_Mutation | rs555995846 | c.308N>A | p.Arg103Gln | p.R103Q | O60656 | protein_coding | tolerated(0.59) | benign(0) | TCGA-AZ-4315-01 | Colorectum | colon adenocarcinoma | Male | <65 | I/II | Unknown | Unknown | SD |
| UGT1A9 | SNV | Missense_Mutation | novel | c.829N>C | p.Cys277Arg | p.C277R | O60656 | protein_coding | deleterious(0) | probably_damaging(0.996) | TCGA-CA-6717-01 | Colorectum | colon adenocarcinoma | Male | <65 | I/II | Chemotherapy | oxaliplatin | CR |
| UGT1A9 | SNV | Missense_Mutation | rs144147859 | c.128C>T | p.Ser43Leu | p.S43L | O60656 | protein_coding | tolerated(0.32) | benign(0.014) | TCGA-EI-6917-01 | Colorectum | rectum adenocarcinoma | Male | <65 | III/IV | Chemotherapy | 5fluorouracil+oxaciplatina+l-folinian | SD |
| Page: 1 2 3 4 5 |
Top |
Related drugs of malignant transformation related genes |
| Identification of chemicals and drugs interact with genes involved in malignant transfromation |
| (DGIdb 4.0) |
| Entrez ID | Symbol | Category | Interaction Types | Drug Claim Name | Drug Name | PMIDs |
| 54600 | UGT1A9 | ENZYME, DRUGGABLE GENOME, CLINICALLY ACTIONABLE | SN-38 | 7-ETHYL-10-HYDROXYCAMPTOTHECIN | 16636344,24897286,12181437,18221820 | |
| 54600 | UGT1A9 | ENZYME, DRUGGABLE GENOME, CLINICALLY ACTIONABLE | raltegravir | RALTEGRAVIR | ||
| 54600 | UGT1A9 | ENZYME, DRUGGABLE GENOME, CLINICALLY ACTIONABLE | simvastatin | SIMVASTATIN | 25493567 | |
| 54600 | UGT1A9 | ENZYME, DRUGGABLE GENOME, CLINICALLY ACTIONABLE | oxazepam | OXAZEPAM | ||
| 54600 | UGT1A9 | ENZYME, DRUGGABLE GENOME, CLINICALLY ACTIONABLE | ALOE VERA GEL | 9834927 | ||
| 54600 | UGT1A9 | ENZYME, DRUGGABLE GENOME, CLINICALLY ACTIONABLE | sorafenib | SORAFENIB | 22912756,28362716 | |
| 54600 | UGT1A9 | ENZYME, DRUGGABLE GENOME, CLINICALLY ACTIONABLE | phenobarbital | PHENOBARBITAL | 26049587 | |
| 54600 | UGT1A9 | ENZYME, DRUGGABLE GENOME, CLINICALLY ACTIONABLE | mycophenolate mofetil | 22765258,16198654,18946804,22210424,20565459 | ||
| 54600 | UGT1A9 | ENZYME, DRUGGABLE GENOME, CLINICALLY ACTIONABLE | acetaminophen | ACETAMINOPHEN | 23279026,26049587,16696573,11714888 | |
| 54600 | UGT1A9 | ENZYME, DRUGGABLE GENOME, CLINICALLY ACTIONABLE | risperidone | RISPERIDONE |
| Page: 1 2 3 |

Copyright 2023-Present -The University of Texas Health Science Center at Houston |