
|
|||||
|
 | |
| |
| |
| |
| |
| |
|
Gene: UGT1A7 |
Gene summary for UGT1A7 |
| Gene information | Species | Human | Gene symbol | UGT1A7 | Gene ID | 54577 |
| Gene name | UDP glucuronosyltransferase family 1 member A7 | |
| Gene Alias | GNT1 | |
| Cytomap | 2q37.1 | |
| Gene Type | protein-coding | GO ID | GO:0001523 | UniProtAcc | Q5DSZ7 |
Top |
Malignant transformation analysis |
| Identification of the aberrant gene expression in precancerous and cancerous lesions by comparing the gene expression of stem-like cells in diseased tissues with normal stem cells |
| Entrez ID | Symbol | Replicates | Species | Organ | Tissue | Adj P-value | Log2FC | Malignancy |
| 54577 | UGT1A7 | LZE2T | Human | Esophagus | ESCC | 3.94e-07 | 5.62e-01 | 0.082 |
| 54577 | UGT1A7 | LZE4T | Human | Esophagus | ESCC | 3.60e-30 | 1.01e+00 | 0.0811 |
| 54577 | UGT1A7 | LZE7T | Human | Esophagus | ESCC | 1.40e-08 | 4.61e-01 | 0.0667 |
| 54577 | UGT1A7 | LZE22T | Human | Esophagus | ESCC | 1.15e-08 | 4.15e-01 | 0.068 |
| 54577 | UGT1A7 | LZE24T | Human | Esophagus | ESCC | 4.15e-02 | 9.16e-02 | 0.0596 |
| 54577 | UGT1A7 | LZE21T | Human | Esophagus | ESCC | 1.78e-08 | 5.09e-01 | 0.0655 |
| 54577 | UGT1A7 | P4T-E | Human | Esophagus | ESCC | 6.27e-06 | 1.57e-01 | 0.1323 |
| 54577 | UGT1A7 | P9T-E | Human | Esophagus | ESCC | 1.69e-18 | 5.26e-01 | 0.1131 |
| 54577 | UGT1A7 | P10T-E | Human | Esophagus | ESCC | 7.98e-13 | 2.44e-01 | 0.116 |
| 54577 | UGT1A7 | P12T-E | Human | Esophagus | ESCC | 4.24e-18 | 3.74e-01 | 0.1122 |
| 54577 | UGT1A7 | P15T-E | Human | Esophagus | ESCC | 1.44e-39 | 8.55e-01 | 0.1149 |
| 54577 | UGT1A7 | P22T-E | Human | Esophagus | ESCC | 4.18e-52 | 1.02e+00 | 0.1236 |
| 54577 | UGT1A7 | P23T-E | Human | Esophagus | ESCC | 9.87e-03 | 1.19e-01 | 0.108 |
| 54577 | UGT1A7 | P26T-E | Human | Esophagus | ESCC | 5.00e-17 | 3.70e-01 | 0.1276 |
| 54577 | UGT1A7 | P27T-E | Human | Esophagus | ESCC | 9.53e-09 | 1.97e-01 | 0.1055 |
| 54577 | UGT1A7 | P28T-E | Human | Esophagus | ESCC | 1.41e-52 | 1.06e+00 | 0.1149 |
| 54577 | UGT1A7 | P30T-E | Human | Esophagus | ESCC | 1.32e-54 | 2.45e+00 | 0.137 |
| 54577 | UGT1A7 | P32T-E | Human | Esophagus | ESCC | 8.56e-12 | 2.40e-01 | 0.1666 |
| 54577 | UGT1A7 | P39T-E | Human | Esophagus | ESCC | 1.35e-23 | 5.31e-01 | 0.0894 |
| 54577 | UGT1A7 | P42T-E | Human | Esophagus | ESCC | 2.62e-05 | 1.94e-01 | 0.1175 |
| Page: 1 2 |
| Tissue | Expression Dynamics | Abbreviation |
| Esophagus | 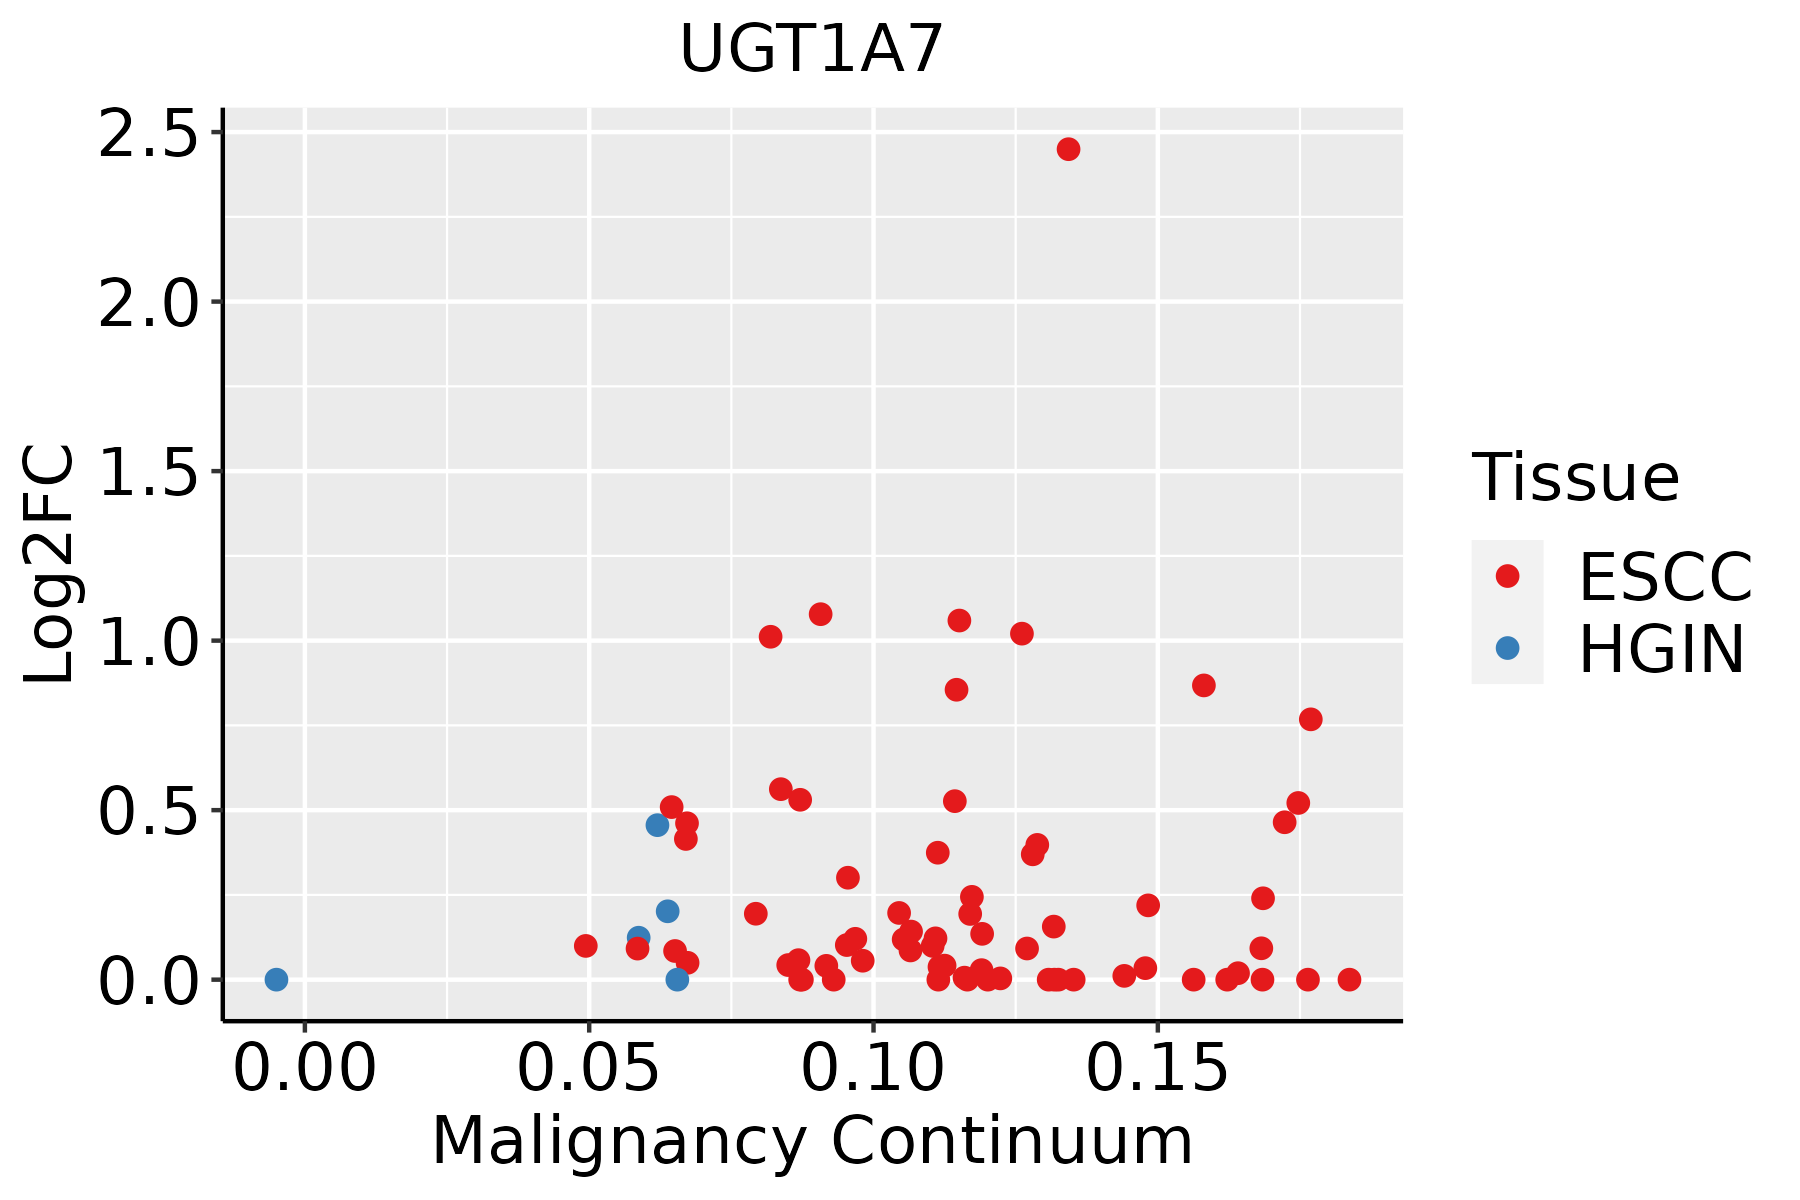 | ESCC: Esophageal squamous cell carcinoma |
| HGIN: High-grade intraepithelial neoplasias | ||
| LGIN: Low-grade intraepithelial neoplasias |
| ∗log2FC in expression of this searched gene in stem-like cells from each diseased tissue sample relative to stem-like cells in normal samples in each tissue plotted against the malignancy continuum. Samples are colored based on if they are from different disease stage. |
Top |
Malignant transformation related pathway analysis |
| Find out the enriched GO biological processes and KEGG pathways involved in transition from healthy to precancer to cancer |
| Tissue | Disease Stage | Enriched GO biological Processes |
| Colorectum | AD |  |
| Colorectum | SER |  |
| Colorectum | MSS |  |
| Colorectum | MSI-H |  |
| Colorectum | FAP |  |
| ∗Top 15 enriched GO BP terms are showed in the bar plot of each disease state in each tissue. Each row represents a significant GO biological process which is colored according to the -log10(p.adjust). |
| Page: 1 2 3 4 5 6 7 8 9 |
| GO ID | Tissue | Disease Stage | Description | Gene Ratio | Bg Ratio | pvalue | p.adjust | Count |
| GO:000941020 | Esophagus | ESCC | response to xenobiotic stimulus | 253/8552 | 462/18723 | 4.55e-05 | 3.58e-04 | 253 |
| GO:00424401 | Esophagus | ESCC | pigment metabolic process | 50/8552 | 84/18723 | 7.34e-03 | 2.64e-02 | 50 |
| Page: 1 |
| Pathway ID | Tissue | Disease Stage | Description | Gene Ratio | Bg Ratio | pvalue | p.adjust | qvalue | Count |
| hsa012405 | Esophagus | ESCC | Biosynthesis of cofactors | 97/4205 | 153/8465 | 3.88e-04 | 1.35e-03 | 6.94e-04 | 97 |
| hsa0124012 | Esophagus | ESCC | Biosynthesis of cofactors | 97/4205 | 153/8465 | 3.88e-04 | 1.35e-03 | 6.94e-04 | 97 |
| Page: 1 |
Top |
Cell-cell communication analysis |
| Identification of potential cell-cell interactions between two cell types and their ligand-receptor pairs for different disease states |
| Ligand | Receptor | LRpair | Pathway | Tissue | Disease Stage |
| Page: 1 |
Top |
Single-cell gene regulatory network inference analysis |
| Find out the significant the regulons (TFs) and the target genes of each regulon across cell types for different disease states |
| TF | Cell Type | Tissue | Disease Stage | Target Gene | RSS | Regulon Activity |
| ∗The dot plots of a searched regulon are shown for all cell subpopulations in each disease state of each tissue based on the regulon specific score inferred using pySCENIC and by calculating the average expression. |
| Page: 1 |
Top |
Somatic mutation of malignant transformation related genes |
| Annotation of somatic variants for genes involved in malignant transformation |
| Hugo Symbol | Variant Class | Variant Classification | dbSNP RS | HGVSc | HGVSp | HGVSp Short | SWISSPROT | BIOTYPE | SIFT | PolyPhen | Tumor Sample Barcode | Tissue | Histology | Sex | Age | Stage | Therapy Types | Drugs | Outcome |
| UGT1A7 | insertion | Frame_Shift_Ins | novel | c.147_148insGCATGGCAGCGTGCGCCTGTAATCCCAGCTACTGAGG | p.Leu50AlafsTer17 | p.L50Afs*17 | Q9HAW7 | protein_coding | TCGA-A2-A0EV-01 | Breast | breast invasive carcinoma | Female | >=65 | I/II | Unknown | Unknown | SD | ||
| UGT1A7 | SNV | Missense_Mutation | c.553N>A | p.Ala185Thr | p.A185T | Q9HAW7 | protein_coding | tolerated(0.07) | benign(0.232) | TCGA-A6-6781-01 | Colorectum | colon adenocarcinoma | Male | <65 | III/IV | Chemotherapy | oxaliplatin | SD | |
| UGT1A7 | SNV | Missense_Mutation | rs144940363 | c.761G>A | p.Arg254Gln | p.R254Q | Q9HAW7 | protein_coding | deleterious(0.01) | probably_damaging(0.998) | TCGA-AA-A00N-01 | Colorectum | colon adenocarcinoma | Male | >=65 | I/II | Unknown | Unknown | PD |
| UGT1A7 | SNV | Missense_Mutation | c.461N>A | p.Gly154Asp | p.G154D | Q9HAW7 | protein_coding | deleterious(0) | probably_damaging(0.982) | TCGA-AA-A010-01 | Colorectum | colon adenocarcinoma | Female | <65 | I/II | Chemotherapy | folinic | CR | |
| UGT1A7 | SNV | Missense_Mutation | rs765046704 | c.598N>A | p.Ala200Thr | p.A200T | Q9HAW7 | protein_coding | tolerated(0.3) | benign(0.011) | TCGA-D5-6928-01 | Colorectum | colon adenocarcinoma | Male | >=65 | I/II | Unknown | Unknown | SD |
| UGT1A7 | insertion | Frame_Shift_Ins | novel | c.671dupT | p.Lys225GlnfsTer9 | p.K225Qfs*9 | Q9HAW7 | protein_coding | TCGA-DM-A1D8-01 | Colorectum | colon adenocarcinoma | Female | <65 | III/IV | Unknown | Unknown | SD | ||
| UGT1A7 | insertion | Frame_Shift_Ins | novel | c.665_666insT | p.Lys225GlnfsTer9 | p.K225Qfs*9 | Q9HAW7 | protein_coding | TCGA-NH-A5IV-01 | Colorectum | colon adenocarcinoma | Female | >=65 | I/II | Unknown | Unknown | SD | ||
| UGT1A7 | SNV | Missense_Mutation | novel | c.289N>T | p.Arg97Cys | p.R97C | Q9HAW7 | protein_coding | tolerated(0.08) | benign(0) | TCGA-A5-A0G2-01 | Endometrium | uterine corpus endometrioid carcinoma | Female | <65 | III/IV | Unknown | Unknown | SD |
| UGT1A7 | SNV | Missense_Mutation | novel | c.128C>T | p.Ser43Leu | p.S43L | Q9HAW7 | protein_coding | tolerated(0.34) | benign(0.014) | TCGA-A5-A1OF-01 | Endometrium | uterine corpus endometrioid carcinoma | Female | <65 | I/II | Unknown | Unknown | SD |
| UGT1A7 | SNV | Missense_Mutation | novel | c.479N>T | p.Tyr160Phe | p.Y160F | Q9HAW7 | protein_coding | tolerated(0.09) | benign(0.346) | TCGA-A5-A7WK-01 | Endometrium | uterine corpus endometrioid carcinoma | Female | >=65 | I/II | Chemotherapy | carboplatin | PD |
| Page: 1 2 3 4 5 |
Top |
Related drugs of malignant transformation related genes |
| Identification of chemicals and drugs interact with genes involved in malignant transfromation |
| (DGIdb 4.0) |
| Entrez ID | Symbol | Category | Interaction Types | Drug Claim Name | Drug Name | PMIDs |
| 54577 | UGT1A7 | DRUGGABLE GENOME, ENZYME | NICOTINE | NICOTINE | 12167564 | |
| 54577 | UGT1A7 | DRUGGABLE GENOME, ENZYME | allopurinol | ALLOPURINOL | 27798726 | |
| 54577 | UGT1A7 | DRUGGABLE GENOME, ENZYME | methotrexate | METHOTREXATE | 29791011 | |
| 54577 | UGT1A7 | DRUGGABLE GENOME, ENZYME | febuxostat | FEBUXOSTAT | 27798726 | |
| 54577 | UGT1A7 | DRUGGABLE GENOME, ENZYME | ritonavir | RITONAVIR | 17058217 | |
| 54577 | UGT1A7 | DRUGGABLE GENOME, ENZYME | mycophenolic acid | 24220207 | ||
| 54577 | UGT1A7 | DRUGGABLE GENOME, ENZYME | oxcarbazepine | OXCARBAZEPINE | 27900402 | |
| 54577 | UGT1A7 | DRUGGABLE GENOME, ENZYME | atazanavir | ATAZANAVIR | 17058217 | |
| 54577 | UGT1A7 | DRUGGABLE GENOME, ENZYME | CURCUMIN | CURCUMIN | 15845768 | |
| 54577 | UGT1A7 | DRUGGABLE GENOME, ENZYME | risperidone | RISPERIDONE |
| Page: 1 2 |

Copyright 2023-Present -The University of Texas Health Science Center at Houston |