
|
|||||
|
 | |
| |
| |
| |
| |
| |
|
Gene: UGT1A1 |
Gene summary for UGT1A1 |
| Gene information | Species | Human | Gene symbol | UGT1A1 | Gene ID | 54658 |
| Gene name | UDP glucuronosyltransferase family 1 member A1 | |
| Gene Alias | BILIQTL1 | |
| Cytomap | 2q37.1 | |
| Gene Type | protein-coding | GO ID | GO:0001523 | UniProtAcc | P22309 |
Top |
Malignant transformation analysis |
| Identification of the aberrant gene expression in precancerous and cancerous lesions by comparing the gene expression of stem-like cells in diseased tissues with normal stem cells |
| Entrez ID | Symbol | Replicates | Species | Organ | Tissue | Adj P-value | Log2FC | Malignancy |
| 54658 | UGT1A1 | S41 | Human | Liver | Cirrhotic | 2.57e-02 | 1.59e-01 | -0.0343 |
| 54658 | UGT1A1 | HCC1_Meng | Human | Liver | HCC | 3.53e-46 | 1.93e-01 | 0.0246 |
| 54658 | UGT1A1 | S014 | Human | Liver | HCC | 1.25e-23 | 1.17e+00 | 0.2254 |
| 54658 | UGT1A1 | S015 | Human | Liver | HCC | 6.77e-12 | 8.25e-01 | 0.2375 |
| 54658 | UGT1A1 | S016 | Human | Liver | HCC | 4.08e-44 | 1.97e+00 | 0.2243 |
| 54658 | UGT1A1 | S028 | Human | Liver | HCC | 1.30e-07 | 2.56e-01 | 0.2503 |
| 54658 | UGT1A1 | S029 | Human | Liver | HCC | 3.42e-12 | 4.37e-01 | 0.2581 |
| Page: 1 |
| Tissue | Expression Dynamics | Abbreviation |
| Liver | 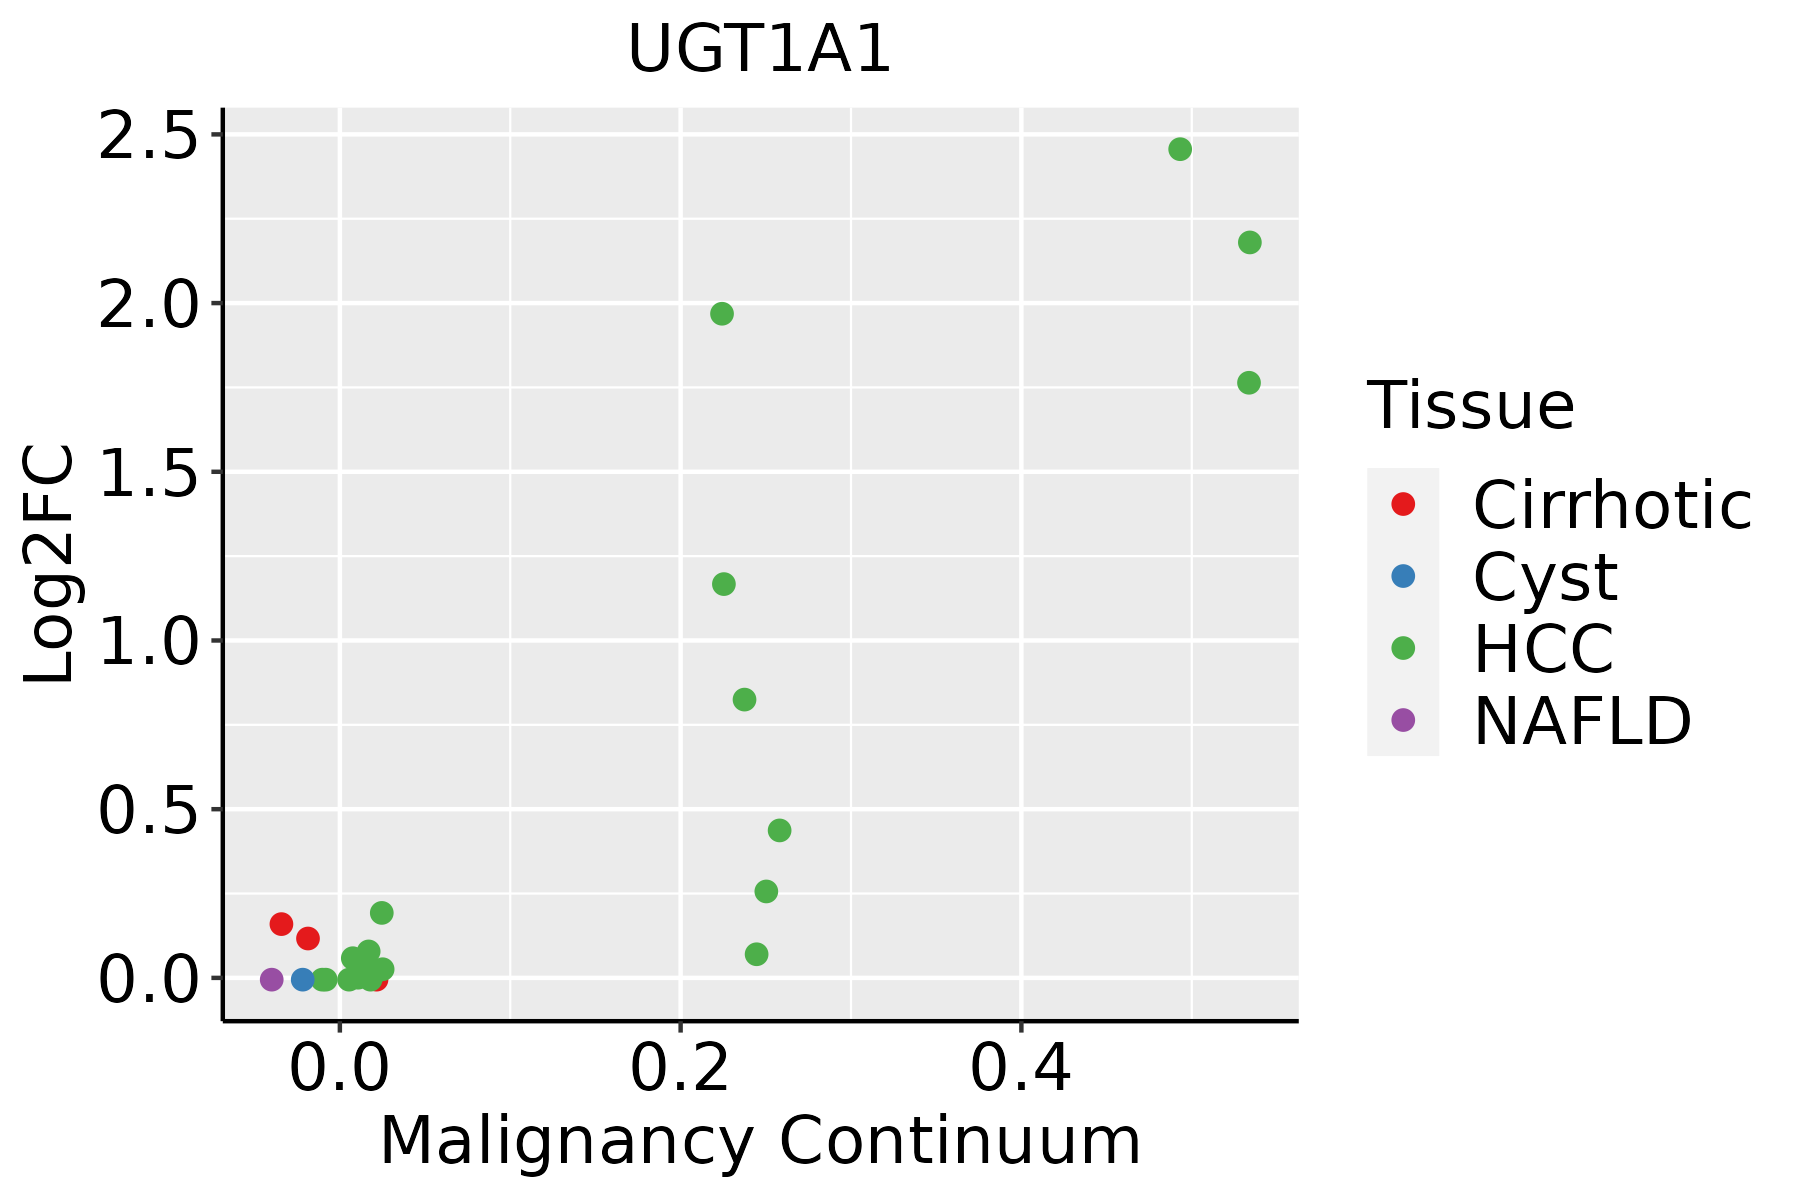 | HCC: Hepatocellular carcinoma |
| NAFLD: Non-alcoholic fatty liver disease |
| ∗log2FC in expression of this searched gene in stem-like cells from each diseased tissue sample relative to stem-like cells in normal samples in each tissue plotted against the malignancy continuum. Samples are colored based on if they are from different disease stage. |
Top |
Malignant transformation related pathway analysis |
| Find out the enriched GO biological processes and KEGG pathways involved in transition from healthy to precancer to cancer |
| Tissue | Disease Stage | Enriched GO biological Processes |
| Colorectum | AD |  |
| Colorectum | SER |  |
| Colorectum | MSS |  |
| Colorectum | MSI-H |  |
| Colorectum | FAP |  |
| ∗Top 15 enriched GO BP terms are showed in the bar plot of each disease state in each tissue. Each row represents a significant GO biological process which is colored according to the -log10(p.adjust). |
| Page: 1 2 3 4 5 6 7 8 9 |
| GO ID | Tissue | Disease Stage | Description | Gene Ratio | Bg Ratio | pvalue | p.adjust | Count |
| GO:000941020 | Esophagus | ESCC | response to xenobiotic stimulus | 253/8552 | 462/18723 | 4.55e-05 | 3.58e-04 | 253 |
| GO:00424401 | Esophagus | ESCC | pigment metabolic process | 50/8552 | 84/18723 | 7.34e-03 | 2.64e-02 | 50 |
| GO:190136111 | Liver | Cirrhotic | organic cyclic compound catabolic process | 213/4634 | 495/18723 | 1.58e-19 | 3.67e-17 | 213 |
| GO:001943911 | Liver | Cirrhotic | aromatic compound catabolic process | 202/4634 | 467/18723 | 6.93e-19 | 1.28e-16 | 202 |
| GO:004427011 | Liver | Cirrhotic | cellular nitrogen compound catabolic process | 195/4634 | 451/18723 | 2.99e-18 | 4.94e-16 | 195 |
| GO:004670011 | Liver | Cirrhotic | heterocycle catabolic process | 192/4634 | 445/18723 | 7.17e-18 | 1.12e-15 | 192 |
| GO:000820211 | Liver | Cirrhotic | steroid metabolic process | 143/4634 | 319/18723 | 2.79e-15 | 3.18e-13 | 143 |
| GO:000188912 | Liver | Cirrhotic | liver development | 81/4634 | 147/18723 | 2.99e-15 | 3.35e-13 | 81 |
| GO:006100812 | Liver | Cirrhotic | hepaticobiliary system development | 82/4634 | 150/18723 | 3.72e-15 | 4.09e-13 | 82 |
| GO:004854512 | Liver | Cirrhotic | response to steroid hormone | 146/4634 | 339/18723 | 7.87e-14 | 6.76e-12 | 146 |
| GO:007138312 | Liver | Cirrhotic | cellular response to steroid hormone stimulus | 90/4634 | 204/18723 | 1.04e-09 | 4.70e-08 | 90 |
| GO:004259412 | Liver | Cirrhotic | response to starvation | 87/4634 | 197/18723 | 1.85e-09 | 7.78e-08 | 87 |
| GO:003166712 | Liver | Cirrhotic | response to nutrient levels | 174/4634 | 474/18723 | 3.08e-09 | 1.27e-07 | 174 |
| GO:000941012 | Liver | Cirrhotic | response to xenobiotic stimulus | 165/4634 | 462/18723 | 6.82e-08 | 2.09e-06 | 165 |
| GO:005138411 | Liver | Cirrhotic | response to glucocorticoid | 65/4634 | 148/18723 | 2.53e-07 | 6.41e-06 | 65 |
| GO:004873212 | Liver | Cirrhotic | gland development | 154/4634 | 436/18723 | 4.03e-07 | 9.42e-06 | 154 |
| GO:003196011 | Liver | Cirrhotic | response to corticosteroid | 70/4634 | 167/18723 | 7.73e-07 | 1.62e-05 | 70 |
| GO:009730512 | Liver | Cirrhotic | response to alcohol | 96/4634 | 253/18723 | 1.97e-06 | 3.65e-05 | 96 |
| GO:001921611 | Liver | Cirrhotic | regulation of lipid metabolic process | 119/4634 | 331/18723 | 3.05e-06 | 5.39e-05 | 119 |
| GO:007138511 | Liver | Cirrhotic | cellular response to glucocorticoid stimulus | 30/4634 | 56/18723 | 3.46e-06 | 5.97e-05 | 30 |
| Page: 1 2 3 4 |
| Pathway ID | Tissue | Disease Stage | Description | Gene Ratio | Bg Ratio | pvalue | p.adjust | qvalue | Count |
| hsa01240 | Liver | Cirrhotic | Biosynthesis of cofactors | 66/2530 | 153/8465 | 3.11e-04 | 1.99e-03 | 1.23e-03 | 66 |
| hsa00983 | Liver | Cirrhotic | Drug metabolism - other enzymes | 34/2530 | 80/8465 | 1.08e-02 | 3.57e-02 | 2.20e-02 | 34 |
| hsa012401 | Liver | Cirrhotic | Biosynthesis of cofactors | 66/2530 | 153/8465 | 3.11e-04 | 1.99e-03 | 1.23e-03 | 66 |
| hsa009831 | Liver | Cirrhotic | Drug metabolism - other enzymes | 34/2530 | 80/8465 | 1.08e-02 | 3.57e-02 | 2.20e-02 | 34 |
| hsa012402 | Liver | HCC | Biosynthesis of cofactors | 103/4020 | 153/8465 | 4.67e-07 | 5.05e-06 | 2.81e-06 | 103 |
| hsa009832 | Liver | HCC | Drug metabolism - other enzymes | 54/4020 | 80/8465 | 2.25e-04 | 1.09e-03 | 6.08e-04 | 54 |
| hsa012403 | Liver | HCC | Biosynthesis of cofactors | 103/4020 | 153/8465 | 4.67e-07 | 5.05e-06 | 2.81e-06 | 103 |
| hsa009833 | Liver | HCC | Drug metabolism - other enzymes | 54/4020 | 80/8465 | 2.25e-04 | 1.09e-03 | 6.08e-04 | 54 |
| Page: 1 |
Top |
Cell-cell communication analysis |
| Identification of potential cell-cell interactions between two cell types and their ligand-receptor pairs for different disease states |
| Ligand | Receptor | LRpair | Pathway | Tissue | Disease Stage |
| Page: 1 |
Top |
Single-cell gene regulatory network inference analysis |
| Find out the significant the regulons (TFs) and the target genes of each regulon across cell types for different disease states |
| TF | Cell Type | Tissue | Disease Stage | Target Gene | RSS | Regulon Activity |
| ∗The dot plots of a searched regulon are shown for all cell subpopulations in each disease state of each tissue based on the regulon specific score inferred using pySCENIC and by calculating the average expression. |
| Page: 1 |
Top |
Somatic mutation of malignant transformation related genes |
| Annotation of somatic variants for genes involved in malignant transformation |
| Hugo Symbol | Variant Class | Variant Classification | dbSNP RS | HGVSc | HGVSp | HGVSp Short | SWISSPROT | BIOTYPE | SIFT | PolyPhen | Tumor Sample Barcode | Tissue | Histology | Sex | Age | Stage | Therapy Types | Drugs | Outcome |
| UGT1A1 | SNV | Missense_Mutation | c.749N>G | p.Ser250Cys | p.S250C | P22309 | protein_coding | deleterious(0.02) | benign(0.033) | TCGA-AC-A5XS-01 | Breast | breast invasive carcinoma | Female | >=65 | I/II | Hormone Therapy | femara | SD | |
| UGT1A1 | SNV | Missense_Mutation | novel | c.80N>A | p.Ala27Asp | p.A27D | P22309 | protein_coding | deleterious(0) | possibly_damaging(0.548) | TCGA-AN-A046-01 | Breast | breast invasive carcinoma | Female | >=65 | I/II | Unknown | Unknown | SD |
| UGT1A1 | SNV | Missense_Mutation | c.704N>T | p.Ser235Leu | p.S235L | P22309 | protein_coding | deleterious(0.01) | possibly_damaging(0.833) | TCGA-D8-A1JH-01 | Breast | breast invasive carcinoma | Female | <65 | I/II | Hormone Therapy | nolvadex | SD | |
| UGT1A1 | SNV | Missense_Mutation | novel | c.435T>G | p.Phe145Leu | p.F145L | P22309 | protein_coding | deleterious(0.01) | possibly_damaging(0.766) | TCGA-PE-A5DC-01 | Breast | breast invasive carcinoma | Female | >=65 | III/IV | Unknown | Unknown | SD |
| UGT1A1 | SNV | Missense_Mutation | c.513C>A | p.Phe171Leu | p.F171L | P22309 | protein_coding | tolerated(0.4) | benign(0.06) | TCGA-2W-A8YY-01 | Cervix | cervical & endocervical cancer | Female | <65 | I/II | Chemotherapy | cisplatin | CR | |
| UGT1A1 | SNV | Missense_Mutation | c.206N>A | p.Arg69Lys | p.R69K | P22309 | protein_coding | tolerated(1) | benign(0.001) | TCGA-C5-A7CL-01 | Cervix | cervical & endocervical cancer | Female | <65 | III/IV | Chemotherapy | cisplatin | PD | |
| UGT1A1 | SNV | Missense_Mutation | c.653N>T | p.Ser218Leu | p.S218L | P22309 | protein_coding | tolerated(0.94) | benign(0) | TCGA-IR-A3LK-01 | Cervix | cervical & endocervical cancer | Female | >=65 | I/II | Chemotherapy | cisplatin | PD | |
| UGT1A1 | SNV | Missense_Mutation | rs775184773 | c.190G>A | p.Ala64Thr | p.A64T | P22309 | protein_coding | tolerated(0.33) | benign(0.044) | TCGA-AA-3947-01 | Colorectum | colon adenocarcinoma | Female | <65 | I/II | Unknown | Unknown | SD |
| UGT1A1 | SNV | Missense_Mutation | novel | c.526N>T | p.Pro176Ser | p.P176S | P22309 | protein_coding | deleterious(0.02) | possibly_damaging(0.513) | TCGA-AG-A023-01 | Colorectum | rectum adenocarcinoma | Female | <65 | III/IV | Unknown | Unknown | PD |
| UGT1A1 | SNV | Missense_Mutation | c.538N>A | p.Glu180Lys | p.E180K | P22309 | protein_coding | deleterious(0.01) | benign(0.315) | TCGA-A5-A0G1-01 | Endometrium | uterine corpus endometrioid carcinoma | Female | >=65 | I/II | Unknown | Unknown | SD |
| Page: 1 2 3 4 |
Top |
Related drugs of malignant transformation related genes |
| Identification of chemicals and drugs interact with genes involved in malignant transfromation |
| (DGIdb 4.0) |
| Entrez ID | Symbol | Category | Interaction Types | Drug Claim Name | Drug Name | PMIDs |
| 54658 | UGT1A1 | CLINICALLY ACTIONABLE, ENZYME, DRUGGABLE GENOME | BELINOSTAT | BELINOSTAT | 26313268 | |
| 54658 | UGT1A1 | CLINICALLY ACTIONABLE, ENZYME, DRUGGABLE GENOME | Binimetinib | BINIMETINIB | ||
| 54658 | UGT1A1 | CLINICALLY ACTIONABLE, ENZYME, DRUGGABLE GENOME | Indacaterol | INDACATEROL | ||
| 54658 | UGT1A1 | CLINICALLY ACTIONABLE, ENZYME, DRUGGABLE GENOME | simvastatin | SIMVASTATIN | ||
| 54658 | UGT1A1 | CLINICALLY ACTIONABLE, ENZYME, DRUGGABLE GENOME | warfarin | WARFARIN | 26223945,29737521 | |
| 54658 | UGT1A1 | CLINICALLY ACTIONABLE, ENZYME, DRUGGABLE GENOME | letermovir | LETERMOVIR | 31022310 | |
| 54658 | UGT1A1 | CLINICALLY ACTIONABLE, ENZYME, DRUGGABLE GENOME | febuxostat | FEBUXOSTAT | 27798726 | |
| 54658 | UGT1A1 | CLINICALLY ACTIONABLE, ENZYME, DRUGGABLE GENOME | efavirenz | EFAVIRENZ | 24729586 | |
| 54658 | UGT1A1 | CLINICALLY ACTIONABLE, ENZYME, DRUGGABLE GENOME | erlotinib | ERLOTINIB | ||
| 54658 | UGT1A1 | CLINICALLY ACTIONABLE, ENZYME, DRUGGABLE GENOME | inhibitor | 252827462 | RITONAVIR |
| Page: 1 2 3 4 5 |

Copyright 2023-Present -The University of Texas Health Science Center at Houston |