| Tissue | Expression Dynamics | Abbreviation |
| Cervix |  | CC: Cervix cancer |
| HSIL_HPV: HPV-infected high-grade squamous intraepithelial lesions |
| N_HPV: HPV-infected normal cervix |
| Colorectum (GSE201348) |  | FAP: Familial adenomatous polyposis |
| CRC: Colorectal cancer |
| Colorectum (HTA11) |  | AD: Adenomas |
| SER: Sessile serrated lesions |
| MSI-H: Microsatellite-high colorectal cancer |
| MSS: Microsatellite stable colorectal cancer |
| Endometrium |  | AEH: Atypical endometrial hyperplasia |
| EEC: Endometrioid Cancer |
| Esophagus |  | ESCC: Esophageal squamous cell carcinoma |
| HGIN: High-grade intraepithelial neoplasias |
| LGIN: Low-grade intraepithelial neoplasias |
| Liver |  | HCC: Hepatocellular carcinoma |
| NAFLD: Non-alcoholic fatty liver disease |
| Lung | 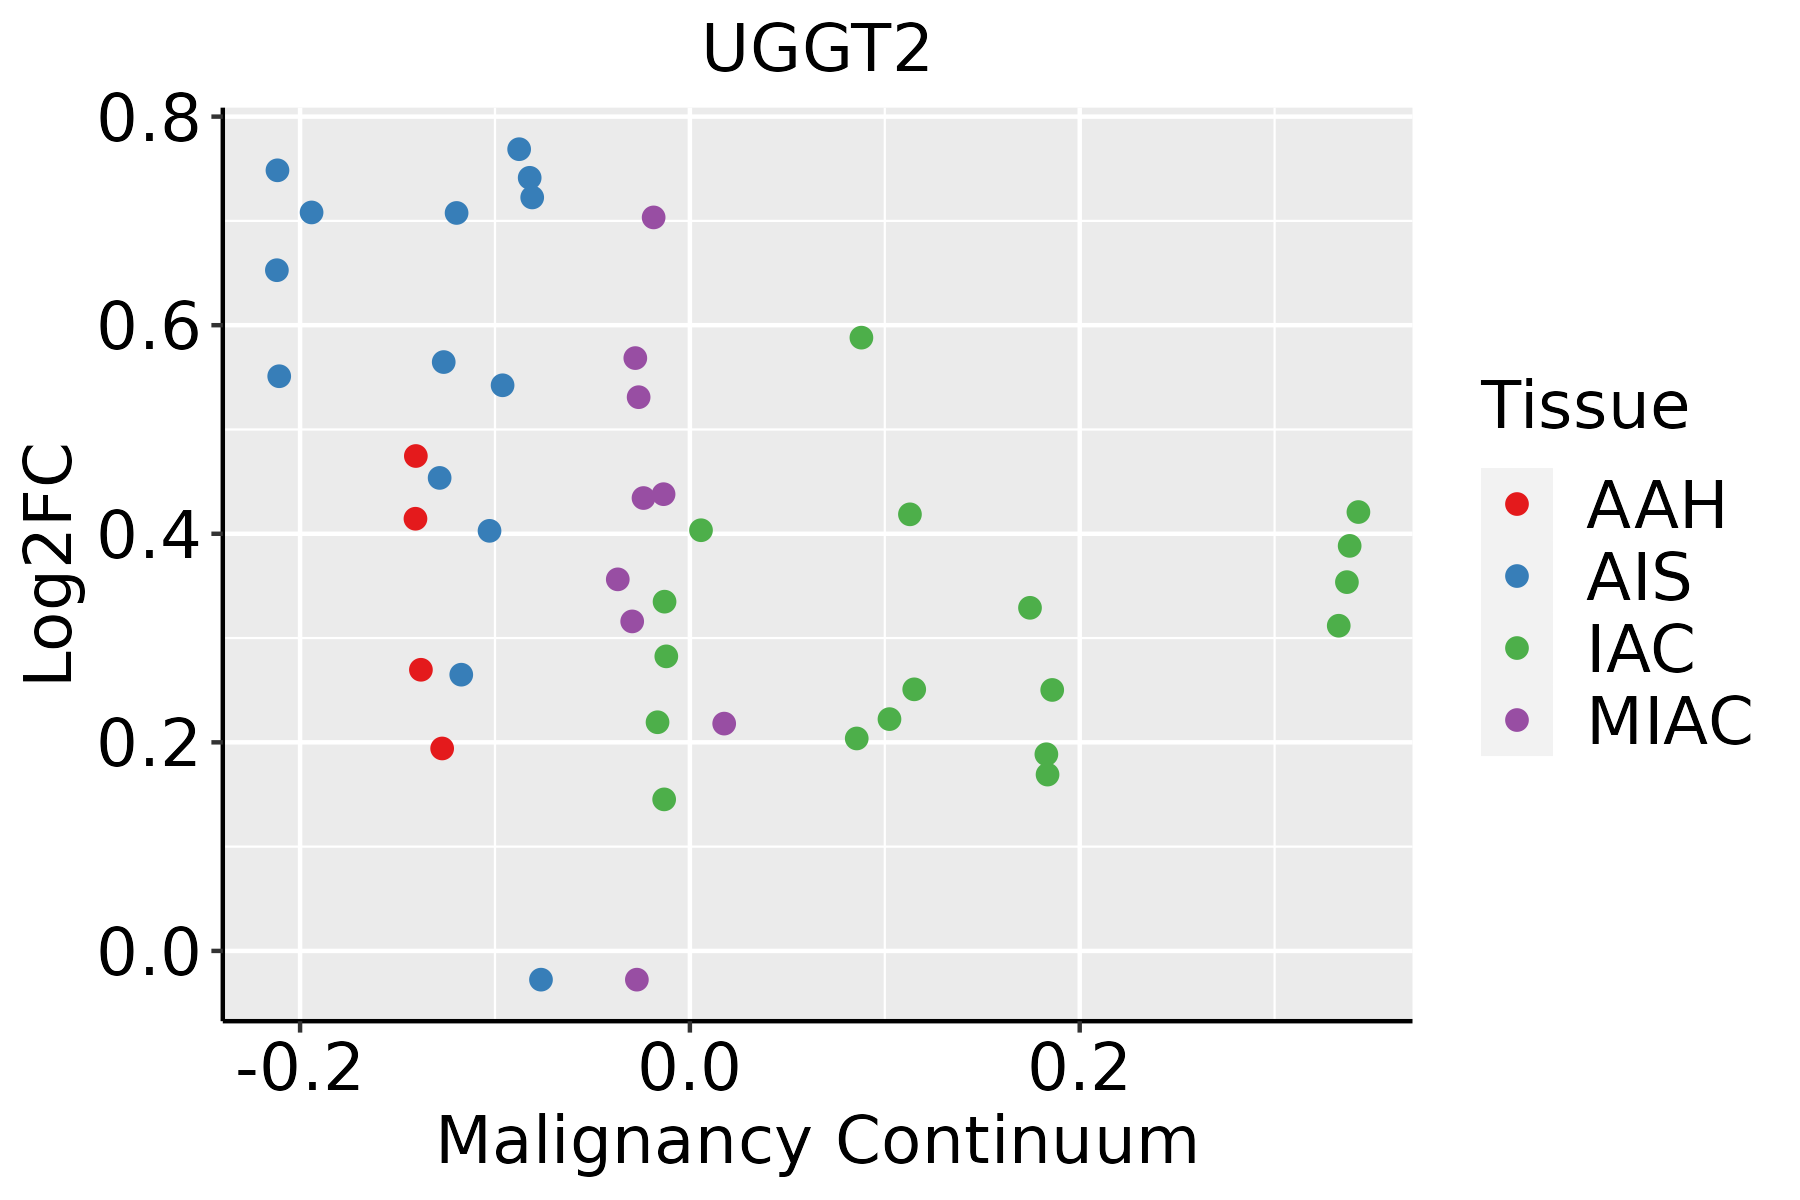 | AAH: Atypical adenomatous hyperplasia |
| AIS: Adenocarcinoma in situ |
| IAC: Invasive lung adenocarcinoma |
| MIA: Minimally invasive adenocarcinoma |
| Prostate | 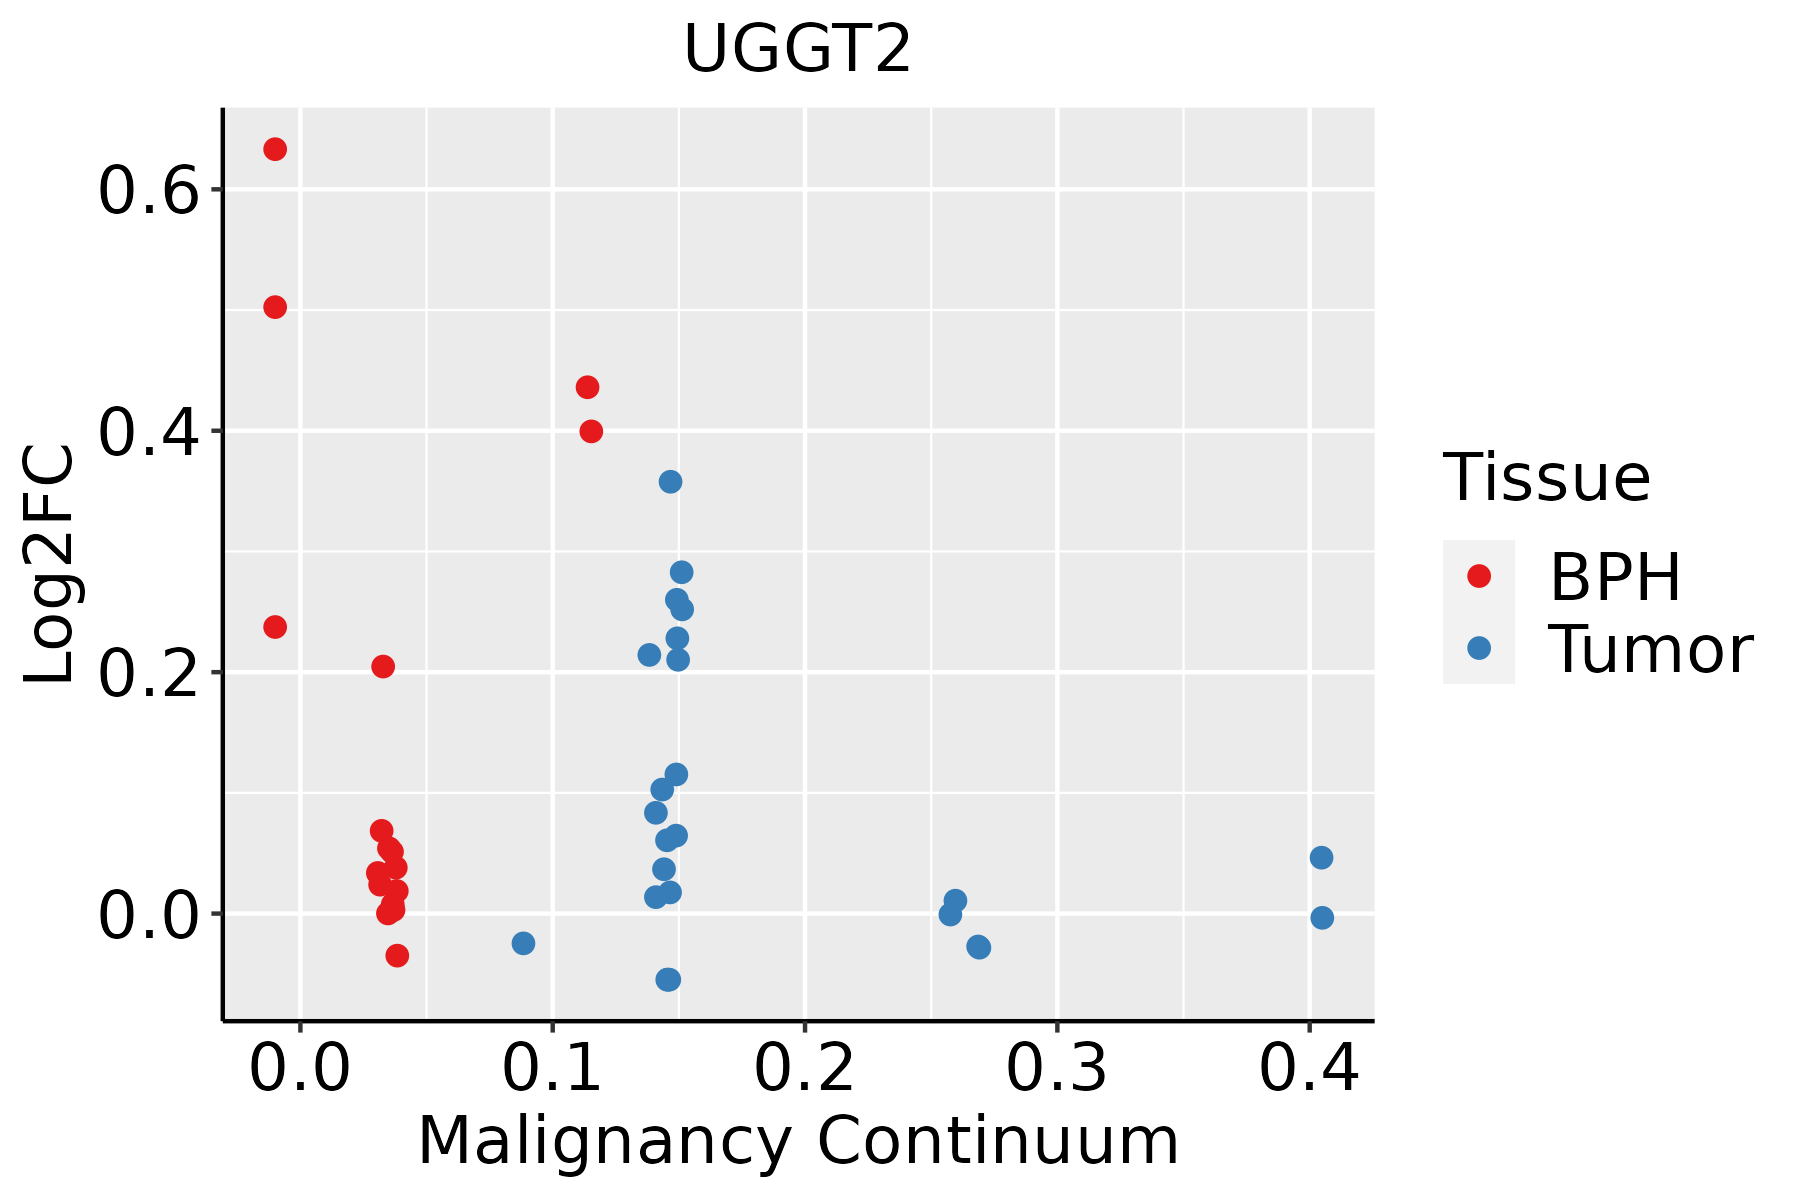 | BPH: Benign Prostatic Hyperplasia |
| Thyroid |  | ATC: Anaplastic thyroid cancer |
| HT: Hashimoto's thyroiditis |
| PTC: Papillary thyroid cancer |
| GO ID | Tissue | Disease Stage | Description | Gene Ratio | Bg Ratio | pvalue | p.adjust | Count |
| GO:001049810 | Cervix | CC | proteasomal protein catabolic process | 111/2311 | 490/18723 | 8.98e-11 | 1.58e-08 | 111 |
| GO:003497610 | Cervix | CC | response to endoplasmic reticulum stress | 57/2311 | 256/18723 | 5.81e-06 | 1.42e-04 | 57 |
| GO:003596610 | Cervix | CC | response to topologically incorrect protein | 39/2311 | 159/18723 | 1.68e-05 | 3.22e-04 | 39 |
| GO:003596710 | Cervix | CC | cellular response to topologically incorrect protein | 29/2311 | 116/18723 | 1.35e-04 | 1.66e-03 | 29 |
| GO:0010498 | Colorectum | AD | proteasomal protein catabolic process | 174/3918 | 490/18723 | 3.18e-14 | 7.66e-12 | 174 |
| GO:0034976 | Colorectum | AD | response to endoplasmic reticulum stress | 90/3918 | 256/18723 | 8.48e-08 | 4.28e-06 | 90 |
| GO:0018279 | Colorectum | AD | protein N-linked glycosylation via asparagine | 15/3918 | 23/18723 | 5.47e-06 | 1.40e-04 | 15 |
| GO:0018196 | Colorectum | AD | peptidyl-asparagine modification | 15/3918 | 24/18723 | 1.18e-05 | 2.62e-04 | 15 |
| GO:0035966 | Colorectum | AD | response to topologically incorrect protein | 54/3918 | 159/18723 | 8.85e-05 | 1.36e-03 | 54 |
| GO:0035967 | Colorectum | AD | cellular response to topologically incorrect protein | 42/3918 | 116/18723 | 1.04e-04 | 1.56e-03 | 42 |
| GO:0006515 | Colorectum | AD | protein quality control for misfolded or incompletely synthesized proteins | 14/3918 | 28/18723 | 6.01e-04 | 6.33e-03 | 14 |
| GO:0006487 | Colorectum | AD | protein N-linked glycosylation | 25/3918 | 65/18723 | 9.12e-04 | 8.71e-03 | 25 |
| GO:0009225 | Colorectum | AD | nucleotide-sugar metabolic process | 16/3918 | 36/18723 | 1.27e-03 | 1.12e-02 | 16 |
| GO:0006486 | Colorectum | AD | protein glycosylation | 64/3918 | 226/18723 | 4.86e-03 | 3.27e-02 | 64 |
| GO:0043413 | Colorectum | AD | macromolecule glycosylation | 64/3918 | 226/18723 | 4.86e-03 | 3.27e-02 | 64 |
| GO:0071712 | Colorectum | AD | ER-associated misfolded protein catabolic process | 7/3918 | 12/18723 | 5.09e-03 | 3.38e-02 | 7 |
| GO:0036503 | Colorectum | AD | ERAD pathway | 34/3918 | 107/18723 | 5.57e-03 | 3.63e-02 | 34 |
| GO:0070085 | Colorectum | AD | glycosylation | 67/3918 | 240/18723 | 5.78e-03 | 3.67e-02 | 67 |
| GO:00104981 | Colorectum | SER | proteasomal protein catabolic process | 132/2897 | 490/18723 | 3.08e-11 | 5.55e-09 | 132 |
| GO:00349761 | Colorectum | SER | response to endoplasmic reticulum stress | 74/2897 | 256/18723 | 3.01e-08 | 2.05e-06 | 74 |
| Pathway ID | Tissue | Disease Stage | Description | Gene Ratio | Bg Ratio | pvalue | p.adjust | qvalue | Count |
| hsa0414120 | Cervix | CC | Protein processing in endoplasmic reticulum | 55/1267 | 174/8465 | 1.74e-08 | 2.68e-07 | 1.58e-07 | 55 |
| hsa04141110 | Cervix | CC | Protein processing in endoplasmic reticulum | 55/1267 | 174/8465 | 1.74e-08 | 2.68e-07 | 1.58e-07 | 55 |
| hsa04141 | Colorectum | AD | Protein processing in endoplasmic reticulum | 80/2092 | 174/8465 | 5.96e-10 | 1.25e-08 | 7.96e-09 | 80 |
| hsa041411 | Colorectum | AD | Protein processing in endoplasmic reticulum | 80/2092 | 174/8465 | 5.96e-10 | 1.25e-08 | 7.96e-09 | 80 |
| hsa041412 | Colorectum | SER | Protein processing in endoplasmic reticulum | 60/1580 | 174/8465 | 4.20e-07 | 7.33e-06 | 5.32e-06 | 60 |
| hsa041413 | Colorectum | SER | Protein processing in endoplasmic reticulum | 60/1580 | 174/8465 | 4.20e-07 | 7.33e-06 | 5.32e-06 | 60 |
| hsa041414 | Colorectum | MSS | Protein processing in endoplasmic reticulum | 75/1875 | 174/8465 | 3.78e-10 | 8.44e-09 | 5.17e-09 | 75 |
| hsa041415 | Colorectum | MSS | Protein processing in endoplasmic reticulum | 75/1875 | 174/8465 | 3.78e-10 | 8.44e-09 | 5.17e-09 | 75 |
| hsa041418 | Colorectum | FAP | Protein processing in endoplasmic reticulum | 50/1404 | 174/8465 | 3.64e-05 | 3.68e-04 | 2.24e-04 | 50 |
| hsa041419 | Colorectum | FAP | Protein processing in endoplasmic reticulum | 50/1404 | 174/8465 | 3.64e-05 | 3.68e-04 | 2.24e-04 | 50 |
| hsa0414126 | Endometrium | AEH | Protein processing in endoplasmic reticulum | 62/1197 | 174/8465 | 5.97e-13 | 1.39e-11 | 1.01e-11 | 62 |
| hsa04141111 | Endometrium | AEH | Protein processing in endoplasmic reticulum | 62/1197 | 174/8465 | 5.97e-13 | 1.39e-11 | 1.01e-11 | 62 |
| hsa0414127 | Endometrium | EEC | Protein processing in endoplasmic reticulum | 64/1237 | 174/8465 | 2.17e-13 | 5.09e-12 | 3.80e-12 | 64 |
| hsa0414136 | Endometrium | EEC | Protein processing in endoplasmic reticulum | 64/1237 | 174/8465 | 2.17e-13 | 5.09e-12 | 3.80e-12 | 64 |
| hsa04141211 | Esophagus | ESCC | Protein processing in endoplasmic reticulum | 147/4205 | 174/8465 | 3.29e-22 | 1.10e-19 | 5.64e-20 | 147 |
| hsa04141310 | Esophagus | ESCC | Protein processing in endoplasmic reticulum | 147/4205 | 174/8465 | 3.29e-22 | 1.10e-19 | 5.64e-20 | 147 |
| hsa0414122 | Liver | HCC | Protein processing in endoplasmic reticulum | 146/4020 | 174/8465 | 7.34e-24 | 2.46e-21 | 1.37e-21 | 146 |
| hsa0414132 | Liver | HCC | Protein processing in endoplasmic reticulum | 146/4020 | 174/8465 | 7.34e-24 | 2.46e-21 | 1.37e-21 | 146 |
| hsa0414123 | Lung | AIS | Protein processing in endoplasmic reticulum | 35/961 | 174/8465 | 4.88e-04 | 4.39e-03 | 2.81e-03 | 35 |
| hsa0414133 | Lung | AIS | Protein processing in endoplasmic reticulum | 35/961 | 174/8465 | 4.88e-04 | 4.39e-03 | 2.81e-03 | 35 |
| Hugo Symbol | Variant Class | Variant Classification | dbSNP RS | HGVSc | HGVSp | HGVSp Short | SWISSPROT | BIOTYPE | SIFT | PolyPhen | Tumor Sample Barcode | Tissue | Histology | Sex | Age | Stage | Therapy Types | Drugs | Outcome |
| UGGT2 | SNV | Missense_Mutation | | c.1064T>C | p.Met355Thr | p.M355T | Q9NYU1 | protein_coding | deleterious(0) | possibly_damaging(0.521) | TCGA-A8-A09Z-01 | Breast | breast invasive carcinoma | Female | >=65 | I/II | Unknown | Unknown | SD |
| UGGT2 | SNV | Missense_Mutation | | c.4382N>C | p.Arg1461Thr | p.R1461T | Q9NYU1 | protein_coding | tolerated(0.23) | benign(0.028) | TCGA-AC-A23H-01 | Breast | breast invasive carcinoma | Female | >=65 | I/II | Unknown | Unknown | PD |
| UGGT2 | SNV | Missense_Mutation | rs763999611 | c.3946N>A | p.Leu1316Ile | p.L1316I | Q9NYU1 | protein_coding | deleterious(0) | probably_damaging(1) | TCGA-AN-A046-01 | Breast | breast invasive carcinoma | Female | >=65 | I/II | Unknown | Unknown | SD |
| UGGT2 | SNV | Missense_Mutation | novel | c.2272N>A | p.Leu758Ile | p.L758I | Q9NYU1 | protein_coding | tolerated(0.05) | benign(0.023) | TCGA-AN-A046-01 | Breast | breast invasive carcinoma | Female | >=65 | I/II | Unknown | Unknown | SD |
| UGGT2 | SNV | Missense_Mutation | novel | c.4330N>T | p.Pro1444Ser | p.P1444S | Q9NYU1 | protein_coding | deleterious(0) | probably_damaging(1) | TCGA-AR-A2LE-01 | Breast | breast invasive carcinoma | Female | >=65 | I/II | Hormone Therapy | tamoxiphen | PD |
| UGGT2 | SNV | Missense_Mutation | | c.2320N>T | p.Gly774Trp | p.G774W | Q9NYU1 | protein_coding | deleterious(0) | probably_damaging(0.997) | TCGA-B6-A0WY-01 | Breast | breast invasive carcinoma | Female | <65 | III/IV | Unknown | Unknown | PD |
| UGGT2 | SNV | Missense_Mutation | novel | c.808N>A | p.Gly270Arg | p.G270R | Q9NYU1 | protein_coding | deleterious(0.01) | probably_damaging(1) | TCGA-BH-A0B8-01 | Breast | breast invasive carcinoma | Female | <65 | I/II | Hormone Therapy | arimidex | SD |
| UGGT2 | SNV | Missense_Mutation | | c.1899N>A | p.Met633Ile | p.M633I | Q9NYU1 | protein_coding | tolerated(0.15) | benign(0) | TCGA-BH-A0DZ-01 | Breast | breast invasive carcinoma | Female | <65 | I/II | Chemotherapy | docetaxel | SD |
| UGGT2 | SNV | Missense_Mutation | | c.3423G>C | p.Trp1141Cys | p.W1141C | Q9NYU1 | protein_coding | deleterious(0) | probably_damaging(0.999) | TCGA-BH-A18I-01 | Breast | breast invasive carcinoma | Female | <65 | I/II | Chemotherapy | taxotere | CR |
| UGGT2 | SNV | Missense_Mutation | | c.3202N>C | p.Asp1068His | p.D1068H | Q9NYU1 | protein_coding | deleterious(0) | probably_damaging(1) | TCGA-BH-A18Q-01 | Breast | breast invasive carcinoma | Female | <65 | I/II | Unknown | Unknown | SD |


